Zig Zag with Delta and Price
- Indicators
- Kok Jye Yen
- Version: 2.1
- Updated: 21 September 2018
- Activations: 5
The ZigZag indicator provide a good perspective on how the prices are moving, especially when identifying the higher highs or the lower lows. Without using the mouse to measure the extremums, the ZigZag indication can sometimes give a false sense of how much the market have moved, especially when the scale is changed. Hence, the idea for this indicator is born.
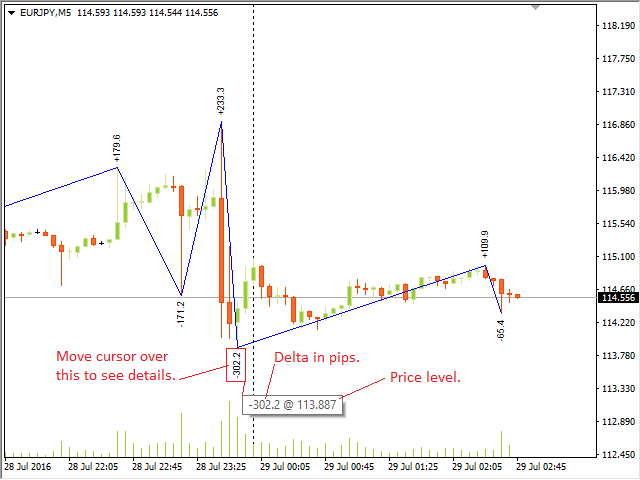
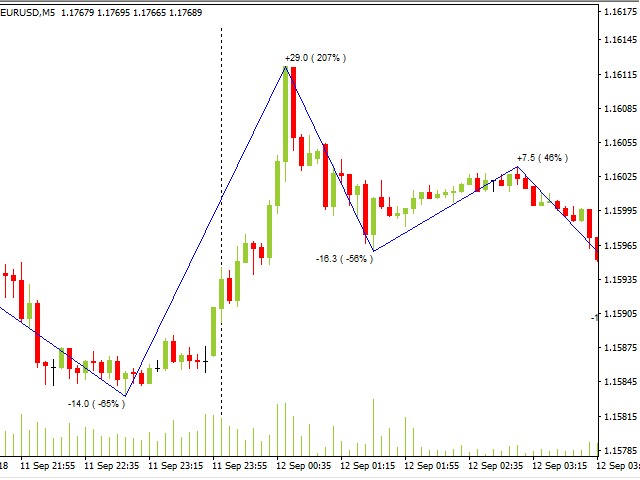
This indicator provides the typical zig-zag indication with the value added movement delta in pips at each extremums (extreme points). The original intent was to have both delta in pips and price level displayed on the chart, but after many trials and evaluations, it was concluded that the best option is to only display the delta in pips and with the price hidden tool-tip display; so when the mouse cursor is over the delta value, a text will pop-up indicating both the delta and price level. This way, over crowding the chart with too many text is prevented.
Finally, with this indicator, one can easy the tell the volatility at one glance, and trade decision can be quickly made.
Indicator parameters
- Depth - the number of bars, which is to scan for high and low.
- Deviation - the number of points (0.1 pip per point), which is use to determine high or low.
- Backstep - The number of bars, which is use to look back when determining the highest or lowest point.
- Text Color - The color of the text, which is displayed on the chart.





User didn't leave any comment to the rating