Moving Average Crossover Bars ago Dashboard
- Indicators
- John Benjamin
- Version: 2.0
- Updated: 2 December 2021
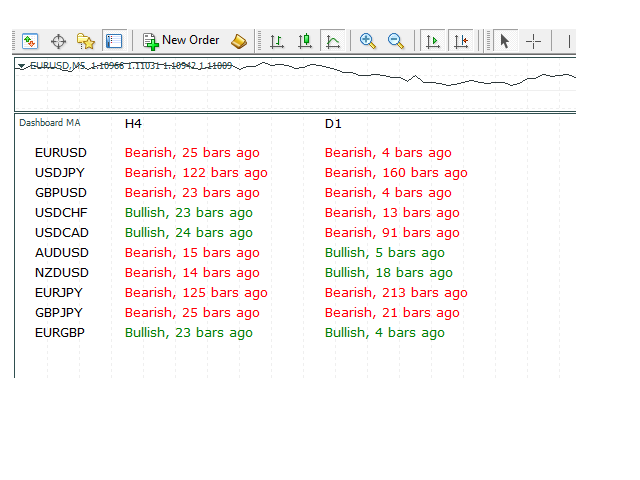
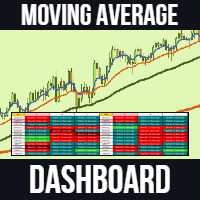
Moving Average Dashboard Bars ago is a unique multi currency, multi time frame dashboard. The dashboard is very simple. You select two moving averages, the instruments and timeframes
The Moving Average Dashboard Bars ago then shows how how many bars ago the moving averages made a bullish or bearish crossover. It also shows you in real time when there is a bullish or a bearish crossover. The indicator plots in a subwindow.
The Moving Average Dashboard Bars ago can be beneficial if you are trading with moving averages.
Settings
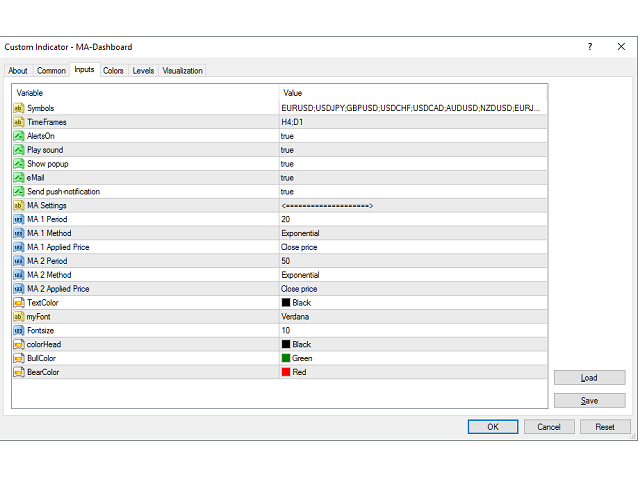
- Symbols: Add up to 20 symbols seperated by a semi-colon (;) It also supports symbol suffixes
- TimeFrames: Select up to 9 time frames, separated by a semi-colon (;)
- AlertsOn: true
- Play sound: true
- Show popup: true
- email: true
- Send push-notification: true
MA Settings
- MA 1 Period: default 20
- MA 1 Method: Choose from drop down (EMA, SMA, SMMA, LWMA)
- MA 1 Applied Price: Drop down (Close/Open/High/Low)
- MA 2 Period: default 50
- MA 2 Method: Choose from drop down (EMA, SMA, SMMA, LWMA)
- MA 2 Applied Price: Drop down (Close/Open/High/Low)
- Text Color, Font customizations







Hi john, Excellent thanks a lot, warmly
after using it it is really very good
well done
Thank you to make it free
warmly