CCI FIBO
- Indicators
- Vladimir Skorina
- Version: 5.0
- Updated: 1 December 2021
- Activations: 5
The CCI FIBO trend indicator displays the real sentiment of the market. Does not redraw.
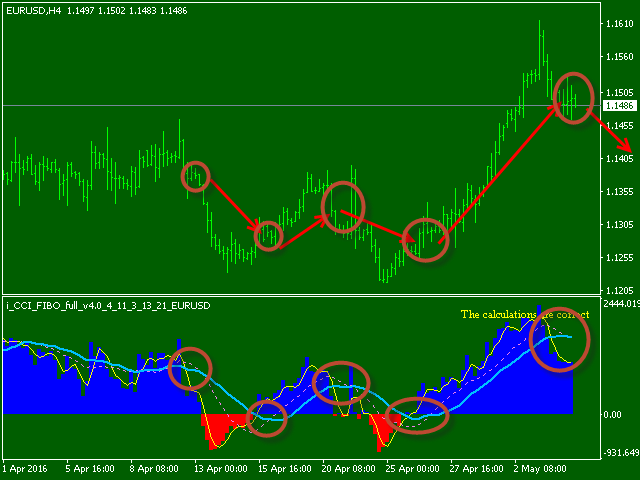
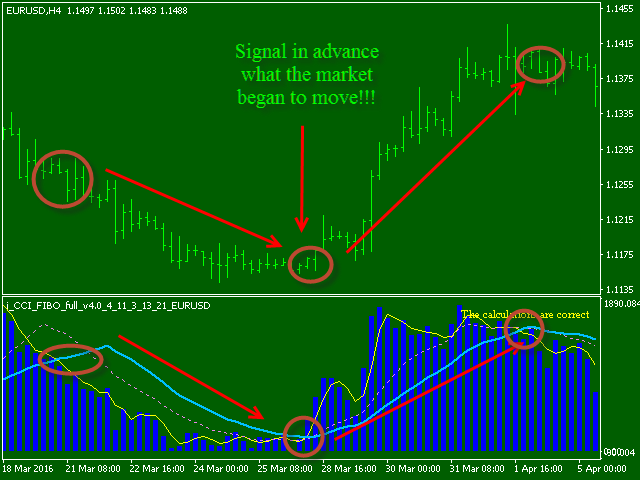
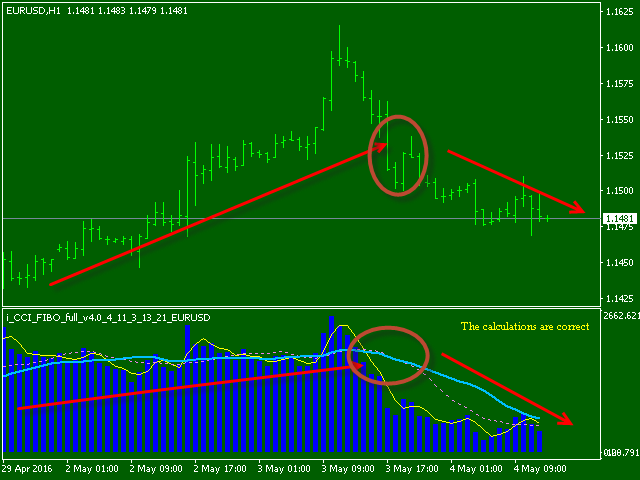
The CCI FIBO indicator is based on the processed values of the standard CCI indicator. The indicator is able to display the slowing\reversal of the price during the trend movement (for exiting the position, and with some experience to display the opening in the opposite direction, for example, to use in scalping). It shows spikes in a flat. The idea of the indicator was that there are indicators that are good for showing the trend, but are bad during flats. And conversely, there are indicators, that are good for showing flats, but generate false signals during trends. This indicator was created specifically to be good at displaying the trend and to quickly readjust during flats.
Indicator parameters
- The number of bars to display indicator - the number of bars to display. Implemented more for increasing the calculation speed.
- Calculating the sensitivity (1 to 15) - Calculation sensitivity. 15 shows the exact market sentiment. below 10 - it is necessary to consult the values for the specific market behavior. It can be reduced, if there are insufficient bars for calculation.
- Calculating the depth (1 to 4) - Calculation depth. 4 is the best. When lower (3, 2, 1) the accuracy of the calculation decreases.
- Enable moving average 1 - Enable the first moving average
- Enable moving average 2 - Enable the second moving average
- Enable moving average 3 - Enable the third moving average
- Period moving average 1 - The number of bars for smoothing the first moving average
- Period moving average 2 - The number of bars for smoothing the second moving average
- Period moving average 3 - The number of bars for smoothing the third moving average
- Enable signal at the intersection of the middle-level number 1 - Enable the signal when the first moving average intersects a certain specified level
- At what level signals - The level to generate the signal
- What kind of music will play at signal - The audio file to play when the first moving average crosses the level
Trading features
It is possible to smooth the values with three moving averages. Three moving averages are displayed by default.
It shows good trading signals from М5 to D1. On М1 there is a lot of noise, but trading is also possible.
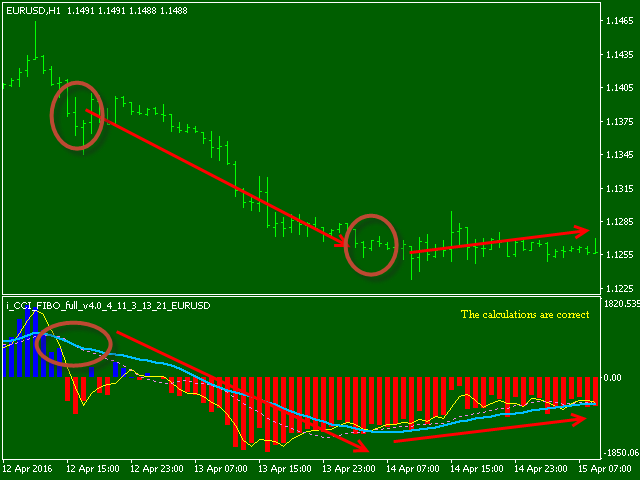
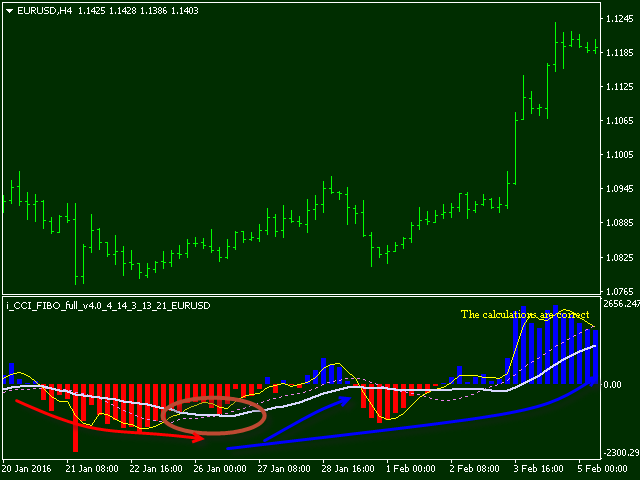
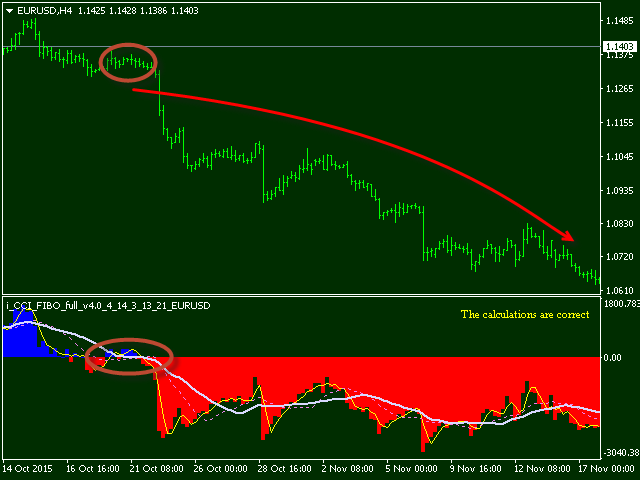
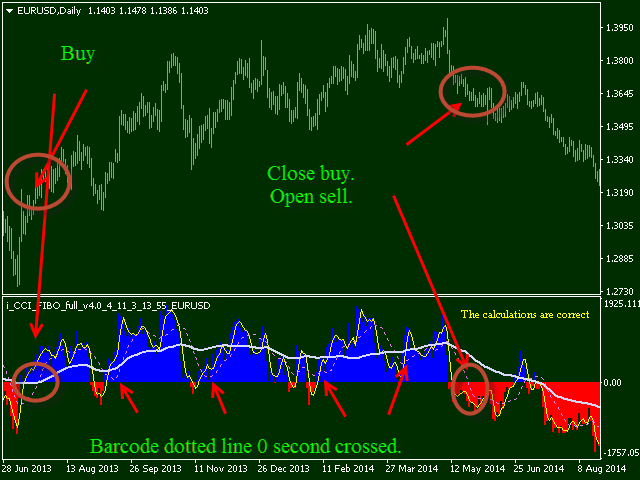
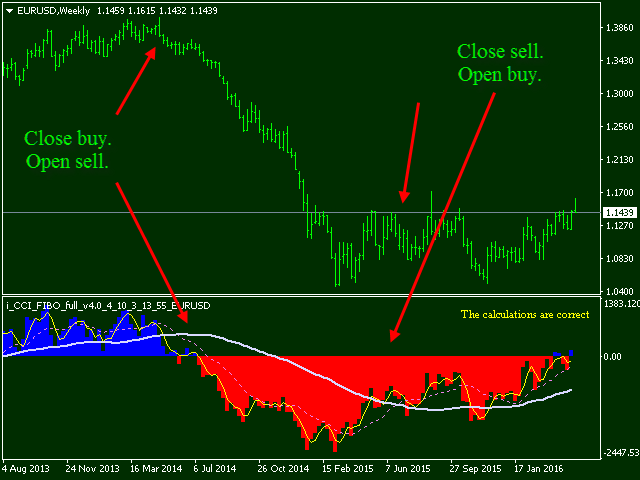
The blue color of the histogram shows that the market is in the buying phase. The red color of the histogram shows that the market is more inclined to sell. These readings are also clearly visible during flats. When the exit from the flat does not display anything but the boundaries for exiting it, the CCI FIBO indicator will stick to one direction. Rapid spikes sometimes happen in the market, but the indicator is not very susceptible to such things. This is why the averaged have been added. A moving average of 3 or 5 allows to smooth the spikes.
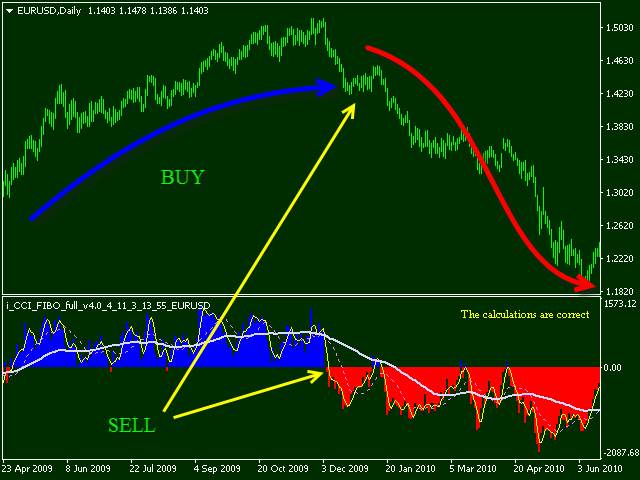
The indicator generates good signals when the moving average crosses the zero point of the indicator. The crossing of the zero point from below indicates that the market is inclined to buy. And vice-versa. From above is for selling.
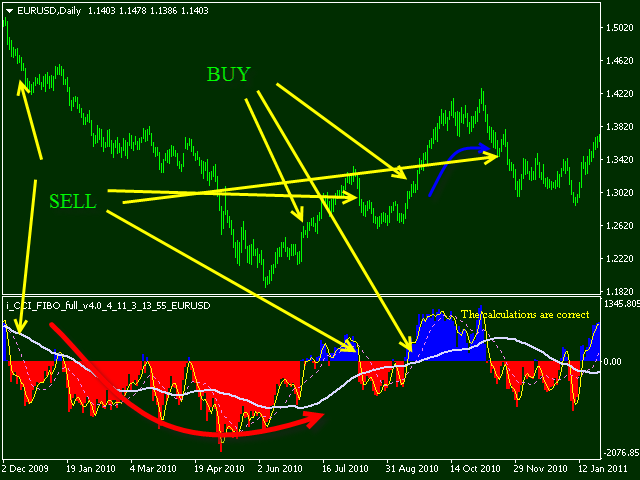
The fast moving average crossing the slower (second and third moving averages) from below can also serve as a buy signal. Similarly, the fast moving average crossing the slow ones (two averages) from above for selling.
It is a good idea to monitor the slope of the slowest moving average. If it is above or below zero. If the slope of the slowest is pointed downwards and it is broken by two faster moving averages from above, then it is a good signal to sell. Similarly, for buying. The upward slope of the moving average, two faster one breaking it from below.
There is an EA based on the crossing of the moving averages, displayed are the results for H1 and H4.
