• Overview
  • Reviews (18)
  • Comments (17)
  • What's new

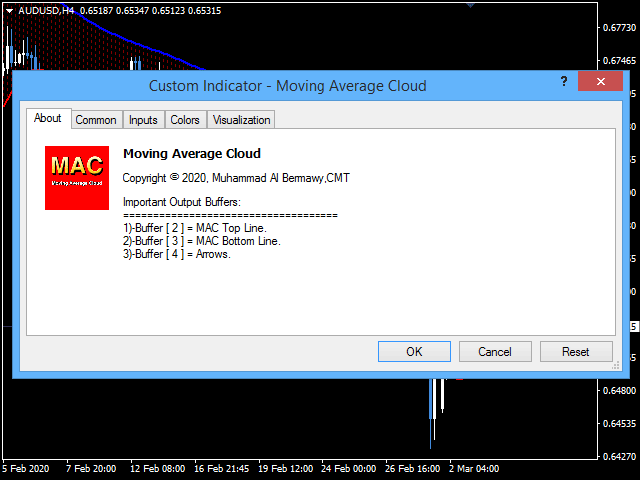
Moving Average Cloud

4.93

Or "MAC".

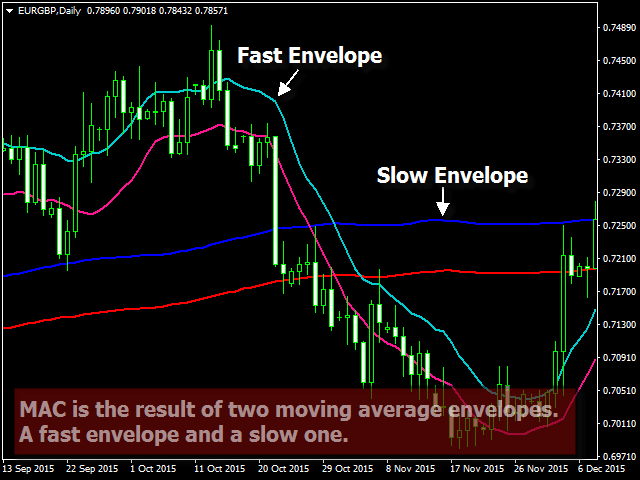
This is an indicator designed to help you capture and trade the trend. The idea behind this indicator can be explained in the next steps:

  1. Draw a fast-moving average Envelope.
  2. Draw a slow-moving average Envelope.
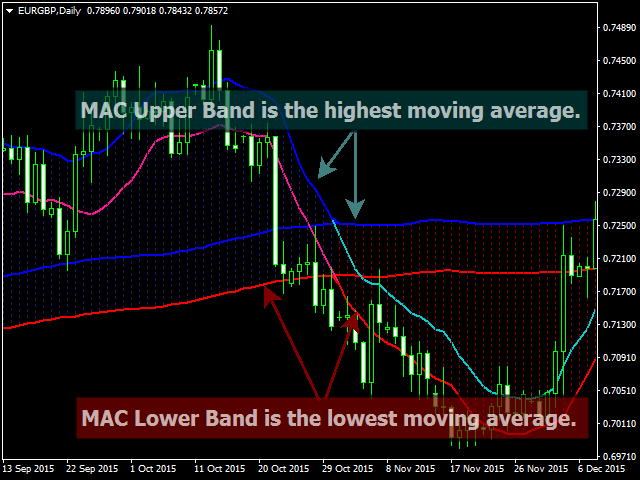
  3. The MAC Upper Band is the highest value between the high of both Envelopes.
  4. The MAC Lower Band is the lowest value between the low of both Envelopes.
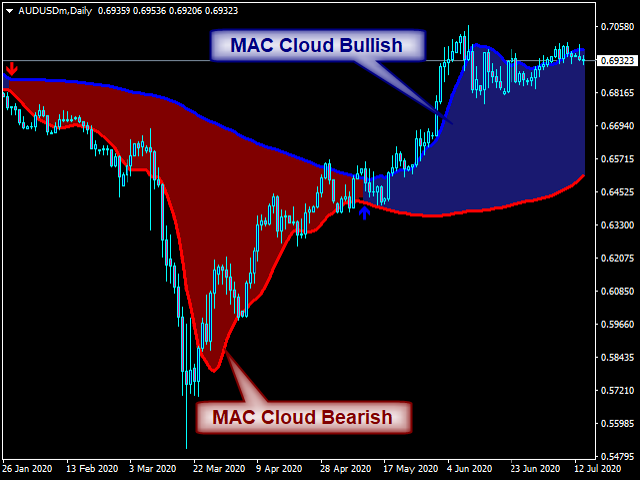
  5. The MAC Histogram Cloud fills the distance between two bands to show you change in direction.
  6. Blue Cloud indicates the uptrend while Red Cloud indicates the downtrend.
► Read next blog to see how to use MAC buffers to build your own EA or scanner:

https://www.mql5.com/en/blogs/post/734293


How to use MAC

  • Use MAC Clouds as a filter to help you identify trend direction.
  • Trade with your usual trading tools in the direction of MAC Clouds only to eliminate false signals as much as possible.
  • Use suggested entry arrows to help you finding strong trending points to start from.

MAC Features

    • MAC does not repaint or recalculate its results.
    • It works on cryptocurrencies, stock, index, oil, gold, and on all time frames.
    • Sound, email alerts and Mobile Notification.
    • Buy, sell arrows to help to identifying trend signals.
    • Well-designed parameters to help the user easily navigate between them.
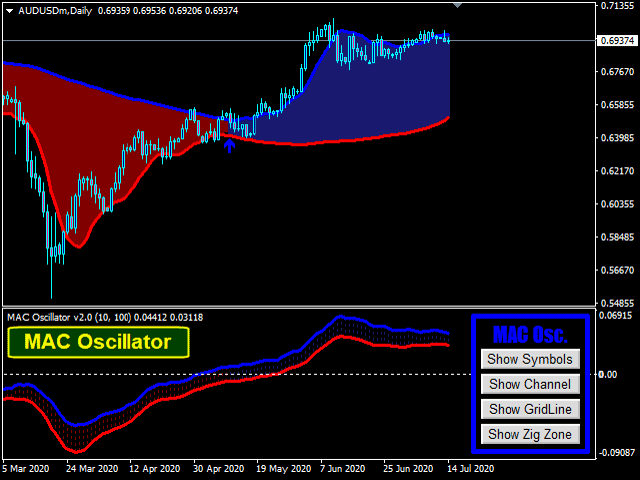
    • Buffer to build your own expert advisors.
    • Four different color lists to choose from.

    MAC Parameters

    (1) INDICATOR PARAMETERS

    • Fast Moving Average.Default is 10
    • Slow Moving Average.Default is 100
    • Moving Average Method.Default is "Simple" Method.

    (2) ALERTS

    • Show Arrows & Vertical Lines.Default is to show arrows only.
    • Arrow Size.Default is one.
    • Alert message.Choose to use or stop alert sound and message (default is true).
    • Send Email.The option to send emails to the user (default is false).
    • Send Mobile Notification.The option to send mobile notifications to the user (default is false).

    (3) INDICATOR STYLE

    • Chart Colors List.The user can choose between four different color lists for his chart or he can choose (Do Nothing) if he wants to use his own list.
    • Bullish Cloud Color.Default is Blue.
    • Bearish Cloud Color.Default is Red.
    • Upper Cloud Edge Color.Default is Midnight Blue
    • Lower Cloud Edge Color.Default is Maroon.
    • Cloud Edge Line Width.Default is one.


    If you have any questions then please, contact me via a private message or, write them in the comment section.
    Muhammad Al Bermaui, CMT

    Reviews 18
    davevicens
    321
    davevicens 2023.10.17 16:39 
     

    An execellent indicator. First trade First win!! Good Job

    awasthisp
    764
    awasthisp 2023.08.20 09:53 
     

    This is an execellent indicator. it does give a big help to get more successful trades. Good job

    Hisham Ghoneim
    301
    Hisham Ghoneim 2022.08.18 10:39 
     

    Great work as usual

    Recommended products
    Signal trend indicator. Detects the direction of the trend and is coloured accordingly.  Has built in audible and visual alerts when trends change. Can send notifications to your phone or email. Allows Trend and Counter-Trend trading. Works on all timeframes, all currency pairs, metals, indices and cryptocurrencies. Can be used with binary options. Distinctive features No re-drawing; Simple and clear settings; Four types of alerts; Works on all timeframes and all trading tools; Su
    HMA Trend Professional MT4
    Pavel Zamoshnikov
    4.57 (7)
    Improved version of the free HMA Trend indicator (for MetaTrader 4) with statistical analysis. HMA Trend is a trend indicator based on the Hull Moving Average (HMA) with two periods. HMA with a slow period identifies the trend, while HMA with a fast period determines the short-term movements and signals in the trend direction. The main differences from the free version: Ability to predict the probability of a trend reversal using analysis of history data. Plotting statistical charts for analyz
    Master Scalping M1 is an innovative indicator that uses an algorithm to quickly and accurately determine the trend.The indicator calculates the time of opening and closing positions, the indicator's algorithms allow you to find the ideal moments to enter a deal (buy or sell an asset), which increase the success of transactions for most traders. Benefits of the indicator: Easy to assemble, does not overload the chart with unnecessary information. Can be used as a filter for any strategy. Works on
    Trend Ray
    Andriy Sydoruk
    The indicator shows the potential trend direction by cyclical-wave dependence. Thus, all the rays of the intersection will be optimal rays, in the direction of which the price is expected to move, taking into account the indicator period. Rays can be used as a direction for potential market movement. But we must not forget that the approach must be comprehensive, the indicator signals require additional information to enter the market.
    Strong Retracement Points Pro demo edition! SRP (Strong Retracement/Reversal Points) is a powerful and unique support and resistance indicator. It displays the closest important levels which we expect the price retracement/reversal! If all level are broken from one side, it recalculates and draws new support and resistance levels, so the levels might be valid for several days depending on the market! If you are still hesitating to start using this wonderful tool, you can check this link to see h
    The indicator allows you to trade binary options. The recommended time frame is М1 and the expiration time is 1,2,3 minutes. The indicator suitable for auto and manual trading. A possible signal is specified as a arrows above/under a candle. You should wait until the candle closes! Arrows are not re-painted Trade sessions: TOKYO section (Half-end) Currency pairs: USD/JPY Working time frame: M1 Expiration time: 1,2,3 minutes. The indicator also shows good results when using the martingale strateg
    FREE
    Noize Absorption Index MT4
    Ekaterina Saltykova
    5 (1)
    Noize Absorption Index - is the manual trading system that measures the difference of pressure between bears forces and bulls forces. Green line - is a noize free index that showing curent situation. Zero value of index shows totally choppy/flat market.Values above zero level shows how powerfull bullish wave is and values below zero measures bearish forces.Up arrow appears on bearish market when it's ready to reverse, dn arrow appears on weak bullish market, as a result of reverse expectation. S
    TWO PAIRS SQUARE HEDGE METER INDICATOR Try this brilliant 2 pairs square indicator It draws a square wave of the relation between your two inputs symbols when square wave indicates -1 then it is very great opportunity to SELL pair1 and BUY Pair2 when square wave indicates +1 then it is very great opportunity to BUY pair1 and SELL Pair2 the inputs are : 2 pairs of symbols         then index value : i use 20 for M30 charts ( you can try other values : 40/50 for M15 , : 30 for M30 , : 10 for H1 ,
    What are Heiken Ashi Candles? Heiken Ashi, derived from the Japanese term 'Heikin Ashi,' translates to average price bars. It's an indicator depicting price bars on a chart. Formula for Heiken Ashi candles: - Heiken Ashi opening price: (previous candle's opening + closing price) / 2 - Closing price Heiken Ashi: (opening + high + low + closing) / 4 - Heiken Ashi peak: Max of high, opening, or closing price - Heiken Ashi bottom price: Min of low, opening, or closing price How to Read Heik
    Trade History Drawer
    David Leander Tschacher
    Trade History Drawer is an indicator for MetaTrader 4. It shows trades on the chart and draws them in customized colors. Furthermore, the indicator shows a trade summary and saves a CSV history file for either one selected pair or all pairs. Inputs General Settings Number Trades : Number of trades to be drawn on the chart, if -1 then all trades Magic Number : Only trades with this magic number, if -1 then ignore Line Style : Line Style Line Thickness : Line Thickness Arrow Size :
    TS krachobor
    Magomed Zakaryaev
    Всем привет! Выставляю свою торговую стратегию для форекс (далее - ТС). После покупки или аренды ТС пишете мне, я вас добавляют в закрытый чат телеграм, где дам все индикаторы и поддержку по торговле, и мы вместе будем торговать. Статистику по торговле в ТС я добавлю чуть позже, так как открыл новый счет по ТС, что бы было наглядно как проходит торговля. Кроме этого  я дам счет и пароль инвестора, можете сами смотреть в живую торговлю и решить для себя подходит ли она для вас. Два режима, 1) Сре
    The principle of this indicator is very simple: detecting the trend with Moving Average, then monitoring the return point of graph by using the crossing of Stochastic Oscillator and finally predicting BUY and SELL signal with arrows, alerts and notifications. The parameters are fixed and automatically calculated on each time frame. Example: If you install indicator on EURUSD, timeframe M5: the indicator will detect the main trend with the Moving Average on this timeframe (for example the Moving
    Blahtech Market Profile
    Blahtech Limited
    4.61 (18)
    Was: $249  Now: $99   Market Profile defines a number of day types that can help the trader to determine market behaviour. A key feature is the Value Area, representing the range of price action where 70% of trading took place. Understanding the Value Area can give traders valuable insight into market direction and establish the higher odds trade. It is an excellent addition to any system you may be using. Blahtech Limited presents their Market Profile indicator for the MetaTrader community. Ins
    Cosmic Diviner X Planet
    Olena Kondratenko
    4 (2)
    This unique multi-currency strategy simultaneously determines the strength of trends and market entry points, visualizing this using histograms on the chart. The indicator is optimally adapted for trading on the timeframes М5, М15, М30, Н1. For the convenience of users, the indicator renders the entry point (in the form of an arrow), recommended take profit levels (TP1, TP2 with text labels) and the recommended Stop Loss level. The take profit levels (TP1, TP2) are automatically calculated for
    Volume by Price MT4
    Brian Collard
    4.71 (14)
    The Volumebyprice.com Indicator for MetaTrader 4 features Volume Profile and Market Profile TPO (Time Price Opportunity). Volume and TPO histogram bar and line charts. Volume Footprint charts. TPO letter and block marker collapsed and split structure charts. Session filtering and grouping. Static, dynamic and flexible range segmentation and compositing methods with relative and absolute visualizations. Graphical layering, positioning and styling options to suit the user's analytic and aesthetic
    First of all Its worth emphasizing here that this Trading Tool is Non-Repainting Non-Redrawing and Non-Lagging Indicator Which makes it ideal for professional trading . Online course, user manual and demo. The Smart Price Action Concepts Indicator is a very powerful tool for both new and experienced traders . It packs more than 20 useful indicators into one combining advanced trading ideas like Inner Circle Trader Analysis and Smart Money Concepts Trading Strategies . This indicator focuses on
    RSX Signal 2 AM
    Andriy Matviyevs'kyy
    The indicator displays the signals of the RSX oscillator on the price chart. (To display these signals in a separate window, along with the oscillator, another indicator is used -  RSX Osc 4 AM ). It is optimal to use the indicator signals as signals to open a trade when the price overcomes the maximum or minimum of the bar at which the signal was given. An opposite signal cancels the previous signal. Settings: Data period for indicator calculation - data period for indicator calculation; Data
    FREE
    The indicator builds current quotes, which can be compared with historical ones and on this basis make a price movement forecast. The indicator has a text field for quick navigation to the desired date. Options: Symbol - selection of the symbol that the indicator will display; SymbolPeriod - selection of the period from which the indicator will take data; IndicatorColor - indicator color; Inverse - true reverses quotes, false - original view; Next are the settings of the te
    An indicator of pattern #31 ("Long Island") from Encyclopedia of Chart Patterns by Thomas N. Bulkowski. The second gap is in the opposite direction. Parameters: Alerts - show alert when an arrow appears   Push - send a push notification when an arrow appears (requires configuration in the terminal) GapSize - minimum gap size in points ArrowType - a symbol from 1 to 17 ArrowVShift - vertical shift of arrows in points   ShowLevels - show levels ColUp - color of an upward line ColDn - color of
    BE auto
    Muhammad Ridzuan Mohd Radzali
    5 (2)
    Indicator automatically draw bullish and bearish engulfing without any rules. Bearish and Bullish engulf is well known area for supply and demand area marking. This indicator can be used in any strategy that required supply demand zone. Show Last Engulf : Enable this option to show unfresh engulfing  Candle to calculate : set 0 will load all history bar and can use up more memory Bearish Engulfing Colour : Pick any colour that suit Bearish Engulfing Colour  : Pick any colour that suit -Use thi
    FREE
    VR Cub
    Vladimir Pastushak
    VR Cub is an indicator for getting high-quality entry points. The indicator was developed to facilitate mathematical calculations and simplify the search for entry points into a position. The trading strategy for which the indicator was written has been proving its effectiveness for many years. The simplicity of the trading strategy is its great advantage, which allows even novice traders to successfully trade with it. VR Cub calculates position opening points and Take Profit and Stop Loss targe
    TrendPlus
    Sivakumar Subbaiya
    4.21 (14)
    Trend Plus   Trendplus  Indicator   Time Frame: Suitable for any time frame.  Purpose: Trend Prediction. Blue and red candle indicate the buy and sell call respectively. Buy: When the blue candle is formed buy call is initiated. close the buy trades when the next red candle will formed.   Sell: When the Red candle is formed Sell call is initiated. close the Sell trades when the next blue candle will formed.   Happy trade!!
    FREE
    Owl smart levels
    Sergey Ermolov
    4.63 (54)
    MT5 version  |  FAQ The Owl Smart Levels Indicator  is a complete trading system within the one indicator that includes such popular market analysis tools as  Bill Williams' advanced fractals , Valable ZigZag which builds  the correct wave structure  of the market, and  Fibonacci levels  which mark the exact levels of entry into the market and places to take profits. Detailed description of the strategy Instructions for working with the indicator Advisor-assistant in trading Owl Helper Private
    Wave Wolf MT4
    Andrei Salanevich
    The Wave Wold MT4 Forex indicator is designed to search for Wolf waves and display them in the current window of the trading terminal. An excellent indicator for traders who use Wolf waves in trading. Its application in trading strategies will significantly increase their efficiency and profitability. INFORMATION ABOUT THE INDICATOR Unlike other Wolf wave indicators, the Wave Wold MT4 forex indicator has a number of features that significantly increase its effectiveness: The first is the
    The new update makes this indicator a complete tool for studying, analyzing and operating probabilistic patterns. It includes: On-chart Multi-asset percentage monitor. Configurable martingales. Twenty-one pre-configured patterns , including Mhi patterns and C3. An advanced pattern editor to store up to 5 custom patterns. Backtest mode to test results with loss reports. Trend filter. Hit operational filter. Martingale Cycles option. Various types of strategies and alerts. Confluence between patte
    Indicator equipped with a win rate calculation system [Indicator Features] This indicator allows for intuitive and easy confirmation of regular technical analysis through sign signals.  Moreover, it can check the appropriateness of the current parameters by verifying the win rate and includes an automatic win rate determination system that refrains from generating signals when the win rate is low.  This reduces unnecessary entries and enables trading only during periods of high win rates. [
    This is a new strategy for SUPPLY DEMAND areas It is based on a calculation using the tick volume to detect the big price action in market for both bear /bull actions this smart volume action candles are used to determine the supply and demand areas prices in between main supply and demand lines indicate sideway market  up arrows will be shown when prices moves above the main supply and the secondary supply lines Down arrows will be shown when prices moves below the main demand and the secondary
    ZhiBiCCI MT4
    Qiuyang Zheng
    5 (1)
    [ZhiBiCCI] indicators are suitable for all cycle use, and are also suitable for all market varieties. [ZhiBiCCI] Green solid line is a reversal of bullish divergence. The green dotted line is a classic bullish divergence. [ZhiBiCCI] The solid line to the red is a reverse bearish divergence. The red dotted line is a classical bearish divergence. [ZhiBiCCI] can be set in the parameters (Alert, Send mail, Send notification), set to (true) to send instant signals to the alarm window, email, in
    The indicator displays the data of the Stochastic oscillator from a higher timeframe on the chart. The main and signal lines are displayed in a separate window. The stepped response is not smoothed. The indicator is useful for practicing "manual" forex trading strategies, which use the data from several screens with different timeframes of a single symbol. The indicator uses the settings that are identical to the standard ones, and a drop-down list for selecting the timeframe. Indicator Parame
    Rainbow MT4
    Jamal El Alama
    Rainbow MT4 is a technical indicator based on Moving average with period 34 and very easy to use. When price crosses above MA and MA changes color to green, it’s a signal to buy. When price crosses below MA and MA changes color to red, it’s a signal to sell. The Expert advisor ( Rainbow EA MT4) based on Rainbow MT4 indicator, as you can see in the short video below is now available here .
    FREE
    Buyers of this product also purchase
    Gann Made Easy
    Oleg Rodin
    4.93 (87)
    Gann Made Easy is a professional and easy to use Forex trading system which is based on the best principles of trading using the theory of mr. W.D. Gann. The indicator provides accurate BUY and SELL signals including Stop Loss and Take Profit Levels. You can trade even on the go using PUSH notifications. PLEASE CONTACT ME AFTER PURCHASE TO GET MY TRADING TIPS PLUS A GREAT BONUS! Probably you heard already many times about Gann trading methods. Usually Gann's theory is very complex thing not only
    Scalper Inside PRO
    Alexey Minkov
    4.75 (59)
    An exclusive indicator that utilizes an innovative algorithm to swiftly and accurately determine the market trend. The indicator automatically calculates opening, closing, and profit levels, providing detailed trading statistics. With these features, you can choose the most appropriate trading instrument for the current market conditions. Additionally, you can easily integrate your own arrow indicators into Scalper Inside Pro to quickly evaluate their statistics and profitability. Scalper Inside
    TPSpro RFI Levels
    Roman Podpora
    4.86 (21)
    Reversal First Impulse levels (RFI)    INSTRUCTIONS        RUS       -       ENG              R ecommended to use with an indicator   -   TPSpro  TREND PRO -  Version MT5 A key element in trading is zones or levels from which decisions to buy or sell a trading instrument are made. Despite attempts by major players to conceal their presence in the market, they inevitably leave traces. Our task was to learn how to identify these traces and interpret them correctly. Main functions: Displaying activ
    CURRENTLY 26% OFF Best Solution for any Newbie or Expert Trader! This Indicator is a unique, high quality and affordable trading tool because we have incorporated a number of proprietary features and a new formula. With only ONE chart you can read Currency Strength for 28 Forex pairs! Imagine how your trading will improve because you are able to pinpoint the exact trigger point of a new trend or scalping opportunity? User manual: click here That's the first one, the original! Don't buy a worthle
    Currency Strength Wizard is a very powerful indicator that provides you with all-in-one solution for successful trading. The indicator calculates the power of this or that forex pair using the data of all currencies on multiple time frames. This data is represented in a form of easy to use currency index and currency power lines which you can use to see the power of this or that currency. All you need is attach the indicator to the chart you want to trade and the indicator will show you real str
    M1 Arrow
    Oleg Rodin
    5 (14)
    M1 Arrow is an indicator which is based on natural trading principles of the market which include volatility and volume analysis. The indicator can be used with any time frame and forex pair. One easy to use parameter in the indicator will allow you to adapt the signals to any forex pair and time frame you want to trade. The Arrows DO NOT REPAINT and DO NOT LAG! The algorithm is based on the analysis of volumes and price waves using additional filters. The intelligent algorithm of the indicato
    TPSproTREND PrO
    Roman Podpora
    4.78 (18)
    TPSpro TRENDPRO  - is a trend indicator that automatically analyzes the market and provides information about the trend and each of its changes, as well as giving signals for entering trades without redrawing! The indicator uses each candle, analyzing them separately. referring to different impulses - up or down impulse. Exact entry points into transactions for currencies, crypto, metals, stocks, indices!  -  Version MT5               DETAILED DESCRIPTION                R ecommended to use with
    AT Forex Indicator MT4
    Marzena Maria Szmit
    5 (2)
    The AT Forex Indicator MT4 is a sophisticated trading tool designed to provide traders with a comprehensive analysis of multiple currency pairs. This   powerful indicator   simplifies the complex nature of the forex market, making it accessible for both novice and experienced traders. AT Forex Indicator uses   advanced algorithms   to detect trends, patterns and is an essential tool for traders aiming to enhance their forex trading performance. With its robust features, ease of use, and reliabl
    Indicator : RealValueIndicator Description : RealValueIndicator is a powerful tool designed specifically for trading on the EURUSD pair. This indicator analyzes all EUR and USD pairs, calculates their real currency strength values, and displays them as a single realistic value to give you a head start on price. This indicator will tell you moves before they happen if you use it right. RealValueIndicator allows you to get a quick and accurate overview of the EURUSD currency pair tops and bottoms,
    FX Power MT4 NG
    Daniel Stein
    5 (12)
    Trading GOLD, and currencies, with the dog walk strategy  - super smart Trading GOLD, and currencies, with the breakout strategy  - super easy Visit our all-new   Stein Investments Welcome Page   to get the latest information, updates and trading strategies. FX Power MT4 NG  is the next generation of our long-time very popular currency strength meter, FX Power.  And what does this next-generation strength meter offer? Everything you have loved about the original FX Power  PLUS GOLD/XAU stre
    Currently 20% OFF ! Best Solution for any Newbie or Expert Trader! This dashboard software is working on 28 currency pairs plus one. It is based on 2 of our main indicators (Advanced Currency Strength 28 and Advanced Currency Impulse). It gives a great overview of the entire Forex market plus Gold or 1 indices. It shows Advanced Currency Strength values, currency speed of movement and signals for 28 Forex pairs in all (9) timeframes. Imagine how your trading will improve when you can watch the e
    Atomic Analyst
    Issam Kassas
    5 (3)
    First of all Its worth emphasizing here that this Trading Indicator is   Non-Repainting , Non Redrawing and Non Lagging Indicator   Indicator, Which makes it ideal from both manual and robot trading.  User manual: settings, inputs and strategy . The Atomic Analyst  is a PA Price Action Indicator that uses Strength and Momentum of the price to find a better edge in the market. Equipped with Advanced filters which help remove noises and false signals, and Increase Trading Potential. Using Multipl
    GOLD Impulse with Alert
    Bernhard Schweigert
    4.56 (9)
    This indicator is a super combination of our 2 products  Advanced Currency IMPULSE with ALERT  and  Currency Strength Exotics . It works for all time frames and shows graphically impulse of strength or weakness for the 8 main currencies plus one Symbol! This Indicator is specialized to show currency strength acceleration for any symbols like Gold, Exotic Pairs, Commodities, Indexes or Futures. Is first of its kind, any symbol can be added to the 9th line to show  true currency strength accelerat
    Introducing   Quantum Trend Sniper Indicator , the groundbreaking MQL5 Indicator that's transforming the way you identify and trade trend reversals! Developed by a team of experienced traders with trading experience of over 13 years,   Quantum Trend Sniper Indicator   is designed to propel your trading journey to new heights with its innovative way of identifying trend reversals with extremely high accuracy. ***Buy Quantum Trend Sniper Indicator and you could get Quantum Breakout Indicator fo
    TrendMaestro
    Stefano Frisetti
    5 (3)
    note: this indicator is for METATRADER4, if you want the version for METATRADER5 this is the link:  https://www.mql5.com/it/market/product/108106 TRENDMAESTRO ver 2.4 TRENDMAESTRO recognizes a new TREND in the bud, he never makes mistakes. The certainty of identifying a new TREND is priceless. DESCRIPTION TRENDMAESTRO identifies a new TREND in the bud, this indicator examines the volatility, volumes and momentum to identify the moment in which there is an explosion of one or more of these data a
    Legacy of Gann
    Pavel Zamoshnikov
    4.85 (13)
    The indicator very accurately determines the levels of the possible end of the trend and profit fixing. The method of determining levels is based on the ideas of W.D.Gann, using an algorithm developed by his follower Kirill Borovsky. Extremely high reliability of reaching levels (according to K. Borovsky  - 80-90%) Indispensable for any trading strategy – every trader needs to determine the exit point from the market! Precisely determines targets on any timeframes and any instruments (forex, met
    JULY OFFER 80% OFF next price for unlimited version will be 17000$. This is the only time you can get this institutional and professional indicator at this price for unlimited version. Don't dare to miss this. The tool I am about to introduce to you you can't compare it with other tools due to its strategy and accuracy level in predicting the next price directional movement . This tool is designed for serious traders who have decided to make a difference through trading. Be the next person to wi
    Quantum Breakout Indicator PRO
    Bogdan Ion Puscasu
    4.96 (26)
    Introducing   Quantum Breakout PRO , the groundbreaking MQL5 Indicator that's transforming the way you trade Breakout Zones! Developed by a team of experienced traders with trading experience of over 13 years, Quantum Breakout PRO is designed to propel your trading journey to new heights with its innovative and dynamic breakout zone strategy. Quantum Breakout Indicator will give you signal arrows on breakout zones with 5 profit target zones and stop loss suggestion based on the breakout box.
    Enigmera
    Ivan Stefanov
    5 (4)
    ENIGMERA: The core of the market (If the demo of mql5.com doesn't working and you want to try Enigmera please message me.) Introduction This indicator and trading system is a remarkable approach to the financial markets . ENIGMERA uses the fractal cycles to accurately calculate support and resistance levels. It shows the authentic accumulation phase and gives direction and targets.  A system that works whether we are in a trend or a correction.   How does it operate? ENIGMERA comprises of fol
    ICT, SMC, SMART MONEY CONCEPTS, SMART MONEY, Smart Money Concept, Support and Resistance, Trend Analysis, Price Action, Market Structure, Order Blocks, BOS/CHoCH,   Breaker Blocks ,  Momentum Shift, Supply&Demand Zone/Order Blocks , Strong Imbalance, HH/LL/HL/LH,    Fair Value Gap, FVG,  Premium  &   Discount   Zones, Fibonacci Retracement, OTE, Buy Side Liquidity, Sell Side Liquidity, BSL/SSL Taken, Equal Highs & Lows, MTF Dashboard, Multiple Time Frame, BigBar, HTF OB, HTF Market Structure,  L
    Advanced Supply Demand
    Bernhard Schweigert
    4.92 (313)
    CURRENTLY 26% OFF !! Best Solution for any Newbie or Expert Trader! This indicator is a unique, high quality and affordable trading tool because we have incorporated a number of proprietary features and a new formula. With this update, you will be able to show double timeframe zones. You will not only be able to show a higher TF but to show both, the chart TF, PLUS the higher TF: SHOWING NESTED ZONES. All Supply Demand traders will love it. :) Important Information Revealed Maximize the potenti
    TrendDecoder Premium
    Christophe Pa Trouillas
    5 (6)
    Identify ranges  | Get earliest signals of Trends  | Get clear exits before reversal  | Spot the Fibo levels the price will test Non-repainting, non-delayed indicator - ideal for manual and automated trading - for all assets and all time units $69   for launch - then back to >>   $149 After purchase,   please contact me on this channel   for recommended and personalised settings MT5   version:  Click here Get our full method with  BladeSCALPER  and   PowerZONES What is it about? TrendDECOD
    Advanced Currency IMPULSE with ALERT
    Bernhard Schweigert
    4.91 (495)
    CURRENTLY 31% OFF !! Best Solution for any Newbie or Expert Trader! This indicator is a unique, high quality and affordable trading tool because we have incorporated a number of proprietary features and a secret formula. With only ONE chart it gives Alerts for all 28 currency pairs. Imagine how your trading will improve because you are able to pinpoint the exact trigger point of a new trend or scalping opportunity! Built on new underlying algorithms it makes it even easier to identify and confir
    FX Volume
    Daniel Stein
    4.61 (36)
    Visit our all-new   Stein Investments Welcome Page   to get the latest information, updates and trading strategies. FX Volume is the FIRST and ONLY volume indicator that provides a REAL insight into the market sentiment from a broker's point of view. It provides awesome insights into how institutional market participants, like brokers, are positioned in the Forex market, much faster than COT reports. Seeing this information directly on your chart is the real game-changer and breakthrough solut
    Cycle Sniper
    Elmira Memish
    4.41 (37)
    NEW YEAR SALE PRICE FOR LIMITED TIME!!! Please contact us after your purchase and we will send you the complimentary indicators to complete the system Cycle Sniper is not a holy grail but when you use it in a system which is explained in the videos, you will feel the difference. If you are not willing to focus on the charts designed with Cycle Sniper and other free tools we provide, we recommend not buying this indicator. We recommend watching the videos about the indiactor and system before pu
    Entry Points Pro
    Yury Orlov
    4.7 (226)
    Top indicator for MT4 providing accurate signals to enter a trade without repainting! Watch  the video  (6:22) with an example of processing only one signal that paid off the indicator! It can be applied to any financial assets:  forex, cryptocurrencies, metals, stocks, indices.  MT5 version is here   It will provide pretty accurate trading signals and tell you when it's best to open a trade and close it. Most traders improve their trading results during the first trading week with the help of t
    PTS Precision Index Oscillator V2
    PrecisionTradingSystems
    5 (2)
    The Precision Index Oscillator (Pi-Osc) by Roger Medcalf of Precision Trading Systems First of all, if you have any questions please contact me via my website which you can find by searching the above title. Version 2 has been carefully recoded to be super fast to load up on your chart and some other technical improvements have been incorporated to enhance experience. Pi-Osc was created to provide accurate trade timing signals designed to find extreme   exhaustion points, the points that markets
    ZeusArrow Smart Liquidity Finder  Smart Liquidity Finder is Ai controlled indicator based on the Idea of Your SL is My Entry. It scan and draws the major Liquidity areas on chart partitioning them with Premium and Discount Zone and allows you find the best possible trading setups and help you decide the perfect entry price to avoid getting your Stop Loss hunted . Now no more confusion about when to enter and where to enter. Benefit from this one of it's kind trading tool powered by Ai an trade
    Welcome to the world of SMC (Smart Money Concepts) Trading, where we empower traders with the tools and knowledge to make smarter trading decisions. Our latest addition to our suite of trading tools is the SMC Trading Pro indicator, version 1.0. Key Features: Major Market Structure Identification with BODY break. Order Block must be in Major Swing ( not Small Swing ). Order Block with Fair Value Gap Detection. Order Block in Discount | Premium zone. Filter for only Bullish, Bearish or All Order
    A. What is A2SR ?   * It's a leading technical indicator (no repaint, no lagging). -- Guidance : -- at   https://www.mql5.com/en/blogs/post/734748/page4#comment_16532516 -- and  https://www.mql5.com/en/users/yohana/blog A2SR has a special technique in determining the levels of Support ( demand ) and Resistance ( supply ) . Unlike the ordinary way that we seen on the net, A2SR has a original concept in determining actual SR levels. The original technique was not taken from the internet,
    More from author
    True Direction Oscillator
    Muhammad Elbermawi
    4.89 (494)
    Or (TDO)  which is an index that measures the price rate of change using the principle of " Pure Momentum ". When a security price advances from 10 to 15 then the price rate of change is 150% but when it declines back from 15 to 10 then the price rate of change is 33.3% only. That is why technical analysis indicators like "Price Rate of Change" (ROC) or "Momentum" give higher readings for ascending price movements than those given to descending ones. TDO fixes this problem to help traders at re
    Bermaui Manual EA
    Muhammad Elbermawi
    5 (10)
    This is a semi-automatic expert advisor that trades the grid system. The idea is to gradually take different positions in the market, then to calculate the break-even level for them. When the prices pass this break-even by a predetermined distance all opened orders are closed. Important Information Here is the user's guide:   https://www.mql5.com/en/blogs/post/730567 You can try this EA with any of my other products, here:    https://www.mql5.com/en/users/bermaui314/seller Important Featur
    MASR Bands
    Muhammad Elbermawi
    4.64 (11)
    Or M oving A verage S upport R esistance Bands . MASR Bands indicator is a moving average surrounded by two bands that work together as support and resistance levels. Statistically, MASR Bands contain price candles 93% of the time. Here is how it is calculated in steps: 1. The first step is to calculate the highest high (HHV) and the lowest low (LLV) for an X period of time. 2. The second step is to divide HHV by LLV to get how wide is the distance between them as a percentage. I call the
    Bermaui Deviation Percent
    Muhammad Elbermawi
    4.94 (129)
    Or ( BD% ) which is a volatility index that measures volatility in percent rather than points. The idea of BD% is to make an index depending on the Classic Standard Deviation (CSD) that moves between 0 and 100 percent. You can use BD% to compare volatility for the same security in different time periods or different time-frames. In addition, you can use BD% to compare volatility between different securities in different markets in terms of percent rather than points. HOW TO USE "BD%" I
    Bermaui Bands
    Muhammad Elbermawi
    4.94 (90)
    Bermaui Bands (BB) is a technical analysis tool that helps filter between ranging and trending price movements. The idea behind this indicator can be explained in the next steps: Calculate Standard Deviation as an oscillator that moves between 0 and 100. I will name it Bermaui Deviation percent (BD %). If "BD %" is near zero then volatility is at its extreme. In addition, if "BD %" is near 100 then volatility is very low. High volatility means a great probability for a trending market, while low
    Bermaui Pin Bars
    Muhammad Elbermawi
    5 (22)
    Bermaui Pin Bars   Or (BPB) is an indicator that finds Pin Bars price action pattern on the chart. Pin Bars is a shortcut for "Pinocchio Bars" which is a classic bar pattern alternative to Japanese candlesticks with tall upper or lower shadows and very small bodies like Hammer, Inverted-Hammer, Hanging Man, Shooting Star, Dragon Fly Doji or Grave Stone Doji. Bermaui Pin Bars indicator find this pattern depending on a formula that can be explained in the next steps: At first BPB calculate the
    Bermaui RSI Candles
    Muhammad Elbermawi
    5 (7)
    The idea of this indicator is to draw RSI in the form of candles that can be compared with price charts to generate buy and sell signals. The indicator is not my invention. I founded it on the internet several years ago. I updated the code, added alert functions, added the Bermaui Utilities group of tools. The indicator calculates the RSI of all the prices that are used to draw candlesticks (RSI of the open, high, low & close). It uses the highest of them to draw the RSI candles high wick & the
    Classic Keltner Channel
    Muhammad Elbermawi
    4.9 (40)
    Or CKC. This indicator works depending on the classic ten-day moving average rule described by Chester W. Keltner (1909–1998). All parameters are set to the classic version of the Keltner system by default, while the user can change them if he wants. Important Information    Read CKC Manual:   https://www.mql5.com/en/blogs/post/736577    CKC Expert Advisor Example:   https://www.mql5.com/en/blogs/post/734150 About Keltner Channel Formula 1. Calculate the Center Line as a simple moving aver
    BACD Cloud
    Muhammad Elbermawi
    4.57 (7)
    Or B ermaui A verage C onvergence D ivergence Cloud , which is an oscillator that shows trend direction and measures its strength in percent. BACD Cloud calculation is as follow: 1- Calculate two exponential moving average. One of them is faster than the other. I will call the first (Fast) and the second (Slow) 2- Find the center between them, where: Center MA = (Fast + Slow) / 2 3- Calculate BACD Line as follow: BACD = 100 * (Fast / Center MA) 4- Calculate the BACD Signal Line, which i
    Or DBD%. The indicator consists of colored tape that shows trading signals depending on two Bermaui Deviation Oscillator (BD%) and two moving averages. Bermaui Deviation Percent is a volatility index that measures volatility in percent rather than points. The idea of BD% is to make an index depending on Classic Standard Deviation (CSD) that moves between 0 and 100 percent. Important Information DBD% expert advisor example:  https://www.mql5.com/en/blogs/post/731145 If you want to know mor
    Bermaui Channel
    Muhammad Elbermawi
    5 (27)
    This is a price channel that shows five important price levels on the chart. Those levels are: 1. The Highest High (HH) of the previous x bars. 2. The Highest Low (HL) of the previous x bars. 3. The Center Line. 4. The Lowest High (LH) of the previous x bars. 5. The Lowest Low (LL) of the previous x bars. How does Bermaui Channels Captures Overbought  area Think of the distance between HH and HL levels as an overbought area. When the price candles or bars crosses the HL to the upside this
    Horus EA
    Muhammad Elbermawi
    3.67 (3)
    Horus EA for MT4 Thousands of years ago, the ancient Egyptians invented a counting system that they used to measure their lands and weighing their commodities. This system was known as the " Eye of Horus ". The Eye of Horus was associated with the myth of the god Osiris and became one of the sacred symbols of the pharaohs. I used the mathematical equations in the Eye of Horus with the Fibonacci sequence to build a negative progression money management system that is 89% safer than the famous
    Filter:
    davevicens
    321
    davevicens 2023.10.17 16:39 
     

    An execellent indicator. First trade First win!! Good Job

    awasthisp
    764
    awasthisp 2023.08.20 09:53 
     

    This is an execellent indicator. it does give a big help to get more successful trades. Good job

    Muhammad Elbermawi
    52356
    Reply from developer Muhammad Elbermawi 2023.08.20 10:01
    Thanks a lot for the great review 💚🙏
    Hisham Ghoneim
    301
    Hisham Ghoneim 2022.08.18 10:39 
     

    Great work as usual

    [Deleted] 2021.03.21 22:25 
     

    User didn't leave any comment to the rating

    Brandon Kyle Fricke
    485
    Brandon Kyle Fricke 2021.03.16 20:13 
     

    Great confirmation to my current strategy

    Paulina Andrea Madariaga Figueroa
    4147
     

    Best indicators

    Mohamed Osman
    184
    Mohamed Osman 2020.11.28 17:45 
     

    I love it

    jaugusto111
    326
    jaugusto111 2020.10.23 11:26 
     

    Indicador muito bom e completo, basta saber filtrar os sinais de entrada, para ter bons resultados. Muito obrigado Srº Muhammad por desenvolver indicadores tão bons a preços acessíveis.

    Malcolm David Parker
    475
    Malcolm David Parker 2020.07.23 21:29 
     

    Looking good so far.

    lauro1956
    4476
    lauro1956 2020.07.19 17:59 
     

    good morning Very good indicator Thank you

    allname29
    239
    allname29 2020.07.19 10:51 
     

    excellent indicator, I like 👍⭐⭐⭐⭐⭐

    z354x2
    137
    z354x2 2020.07.19 09:34 
     

    This indicator works great, and the support is terrific, too!

    Ferrari888
    593
    Ferrari888 2020.07.03 20:58 
     

    Очень хороший индикатор советую! Спасибо Мухаммад что Вы есть.

    jxdxpolo22
    401
    jxdxpolo22 2020.06.20 23:38 
     

    Simple Indicator to use. It works well.

    IK°L
    815
    IK°L 2020.06.13 03:02 
     

    This is an indicator that you have to have, simple but enormously well developed the idea graphically, great indicator !!

    Lasse Michael Holm
    1318
    Lasse Michael Holm 2020.06.07 22:51 
     

    At last, an indicator that works for me. 10 stars! Just grab this one 😃👍

    Frank Paetsch
    7117
    Frank Paetsch 2019.05.16 01:51 
     

    Sehr schöner Indikator

    Mohamed Trader
    309
    Mohamed Trader 2019.01.04 22:48 
     

    User didn't leave any comment to the rating

    Reply to review
    Version 3.1 2020.07.30
    A small bug in the vertical lines code was fixed.
    Version 3.0 2020.07.14
    Welcome to MAC version 3.0:
    ------------------------------------
    1) I have enhanced the alert and notifications to work better with the MT4 system tester.
    2) The "MAC Cloud Width" now changes automatically depending on the chart scale.
    .
    Note:
    -------
    I didn't make any changes to the MAC's basic formula. It is still the same.
    Version 2.1 2020.03.02
    Fixed a small text error in the description.
    Version 2.0 2020.03.02
    1. Enhanced the calculation method.
    2. Added color lists, for a better chart view.
    3. Enhanced all the alerts.
    4. Arranged the inputs to be more user friendly.
    5. Added buffers to indicator description.
    6. Added a buffer for Arrow Signals (buffer #4).
    .
    Note:

    I didn't make any changes on MAC basic formula. It is still the same.