• Overview
  • Reviews
  • Comments (3)
  • What's new

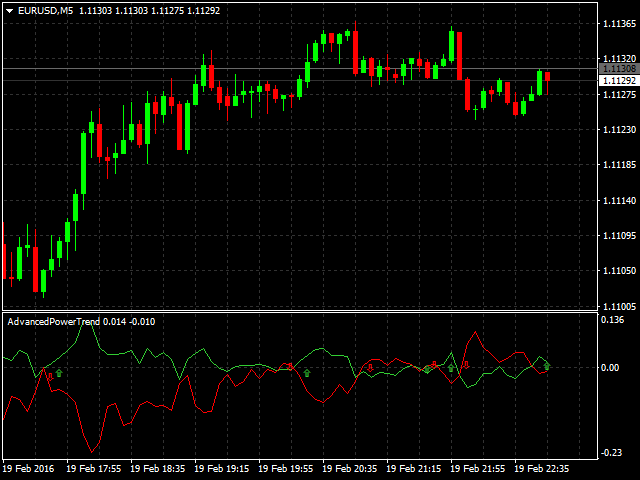
Advanced Power Trend MT5

Unique "scalping" trend indicator with the feature of multi-layered smoothing of the resulting lines and a wide selection of parameters. It helps determine a probable change in the trend or a correction virtually near the very beginning of the movement. The toggled intersection arrows are fixed and appear at the opening of a new bar, but, with enough experience, it is possible to look for entry opportunities as soon as the indicator lines intersect at the unfinished bar. The signal appearance limit levels are added to the indicator as an additional filtration.

Parameters:
  • PeriodMA - primary moving average calculation period
  • MethodMA - primary moving average calculation method
  • PriceMA - primary moving average calculation applied price
  • BasePeriod - base trend period
  • BaseMethod - averaging method of the base trend line
  • BasePrice - applied price of the base trend line
  • PowerPeriod - trend strength calculation period
  • PowerPrice - trend strength calculation price
  • PeriodBaseSmooth - period of the additional smoothing of the trend line
  • BaseLineSmoothMethod - method of the additional smoothing of the trend line
  • PeriodPowerSmooth - period of the additional smoothing of the strength line
  • PoweLineSmoothMethod - method of the additional smoothing of the strength line
  • ShowArrows - enable the display of the intersection arrows
  • Levels - additional filtering levels when displaying the intersection arrows
  • ShowInitialLevels - enable the automatic plotting of the indicator on the chart at non-zero value
  • ShowCrossCalcComment - enable notification about the current value of the possible intersection point of the lines
  • ArrowUpCode - up arrow code
  • ArrowDnCode - down arrow code
  • AddDigits - enable additional precision of readings
Recommended products
Owl Smart Levels MT5
Sergey Ermolov
4.38 (37)
MT4 version  |   FAQ The Owl Smart Levels Indicator is a complete trading system within the one indicator that includes such popular market analysis tools as Bill Williams' advanced fractals , Valable ZigZag which builds the correct wave structure of the market, and Fibonacci levels which mark the exact levels of entry into the market and places to take profits. Detailed description of the strategy Instructions for working with the indicator Advisor-assistant in trading Owl Helper Private User
The indicator detects divergence signals - the divergences between the price peaks and the MACD oscillator values. The signals are displayed as arrows in the additional window and are maintained by the messages in a pop-up window, e-mails and push-notifications. The conditions which formed the signal are displayed by lines on the chart and in the indicator window. The indicator parameters MacdFast - fast MACD line period MacdSlow - slow MACD line period MacdSignal - MACD signal line period Mac
TrendDetect
Pavel Gotkevitch
The Trend Detect indicator combines the features of both trend indicators and oscillators. This indicator is a convenient tool for detecting short-term market cycles and identifying overbought and oversold levels. A long position can be opened when the indicator starts leaving the oversold area and breaks the zero level from below. A short position can be opened when the indicator starts leaving the overbought area and breaks the zero level from above. An opposite signal of the indicator can
All about time and price by ICT. This indicator provides a comprehensive view of ICT killzones, Silver Bullet times, and ICT Macros, enhancing your trading experience.  In those time windows price either seeks liquidity or imbalances and you often find the most energetic price moves and turning points. Features: Automatic Adaptation: The ICT killzones intelligently adapt to the specific chart you are using. For Forex charts, it follows the ICT Forex times: In EST timezone: Session: Asia: 20h00-0
Fractal 358 Plus
Renato Fridschtein
Fractal 358 Plus is a predictive indicator that provides the clearest sight of price movements. Identifying graphic patterns such as Caixote (Crate), Pivot and Inside Candle , it shows entries and exits spots, as well as threats to your trades in the markets. It comes ready to use with B3 Mini Index (WIN$ series) and can be adjusted to use with any asset and timeframe. Fractal 358 unravels price movement Based on the Fibonacci sequence, Fractal 358 is a new and different way of reading and un
Trend Monitor MT5
Pavel Zamoshnikov
3.67 (3)
The indicator generates early signals basing on ADX reading data combined with elements of price patterns. Works on all symbols and timeframes. The indicator does not redraw its signals. You see the same things on history and in real time. For better visual perception signals are displayed as arrows (in order not to overload the chart). Features The best results are obtained when the indicator works on two timeframes. For example: M30 – the indicator shows the main trend; M5 – the indicator ge
MetaCOT 2 is a set of indicators and specialized utilities for the analysis of the U.S. Commodity Futures Trading Commission reports. Thanks to the reports issued by the Commission, it is possible to analyze the size and direction of the positions of the major market participants, which brings the long-term price prediction accuracy to a new higher-quality level, inaccessible to most traders. These indicators, related to the fundamental analysis, can also be used as an effective long-term filter
Indicator and Expert Adviser  EA Available in the comments section of this product. Download with Indicator must have indicator installed for EA to work. Mt5 indicator alerts for bollinger band and envelope extremes occurring at the same time. Buy signal alerts occur when A bullish candle has formed below both the lower bollinger band and the lower envelope  Bar must open and close below both these indicators. Sell signal occur when A bear bar is formed above the upper bollinger band and upp
Your Pointer is no ordinary Forex channel. This corridor is built on the basis of the analysis of several candles, starting from the last one, as a result of which the extremes of the studied interval are determined. They are the ones who create the channel lines. Like all channels, it has a middle line as well as a high and low line. This channel is worth watching for its unusual behavior. The use of the Your Pointer indicator allows the trader to react in time to the price going beyond the bo
Indicator for determining flat and trend. If the price is below any of the two histograms and two lines (red and blue), this is a sell zone. When purchasing this version of the indicator, MT4 version for one real and one demo account - as a gift (to receive, write me a private message)! If the price is above any of the two histograms and two lines (red and blue), this is a buy zone. MT4 version:  https://www.mql5.com/ru/market/product/3793 If the price is between two lines or in the zone
Point Black
Ignacio Agustin Mene Franco
Black Card Pack indicator 5/1 point black It has the strategy of professional bollingers where each arrow gives you a different entry signal. It is used to operate in m1 and in d1 It is used for scalping and intraday, modified for forex markets ! suitable for all pairs modified for synthetic index markets suitable for all pairs! Ideal for volatility and jumps!
PipFinite Breakout EDGE MT5
Karlo Wilson Vendiola
4.84 (114)
The Missing Edge You Need To Catch Breakouts Like A Pro. Follow a step-by-step system that detects the most powerful breakouts! Discover market patterns that generate massive rewards based on a proven and tested strategy. Unlock Your Serious Edge Important information here www.mql5.com/en/blogs/post/723208 The Reliable Expert Advisor Version Automate Breakout EDGE signals using "EA Breakout EDGE" Click Here Have access to the game changing strategy that will take your trading to the n
Supertrend indicator uses a combination of a moving average and average true range to detect the trend of a trading instrument. Supertrend indicator for MetaTrader 5 easily shows the trend as a line following the price. Triple SuperTrend Histo indicator  calculate  three supertrends to show the trend as a histogram. Changing the color from red to green means you can BUY , from green to red means you can SELL . Description of the method of drawing a histogram. The price is above the EMA 20
ATR Line
Evgeny Levchenko
The indicator - "ATR Line" determines the current trend and gives signals to buy (green arrow to the top) or sell (red arrow to the bottom). The indicator calculation is based on the deviation of the average price of the instrument from its average true range - ATR. The moving average of prices is used to reduce "market noise". If the main line of the indicator - "ATR Line" is lower the instrument price chart, then the market is in a "bullish" trend. If the main line of the indicator is higher t
Atomic Analyst MT5
Issam Kassas
5 (14)
First of all Its worth emphasizing here that this Trading Indicator is   Non-Repainting   , Non Redrawing and Non Lagging Indicator   Indicator, Which makes it ideal from both manual and robot trading.  User manual: settings, inputs and strategy . The Atomic Analyst  is a PA Price Action Indicator that uses Strength and Momentum of the price to find a better edge in the market. Equipped with Advanced filters which help remove noises and false signals, and Increase Trading Potential. Using Mult
Ichimoku Aiko MTF
Michael Jonah Randriamampionontsoa
Ichimoku Aiko MTF is a collection of technical indicators that show support and resistance levels, as well as momentum and trend direction. It is a multi-timeframe indicator so you don't need to change the chart timeframe when you want to see the ichimoku clouds on a higher timeframe.  eg. The chart timeframe is M15 and you want to see on the M15 timeframe chart the H1 ichimoku indicators (the ichimoku in Metatrader can't do that) that's why you need to use Ichimoku Aiko MTF.
Automated Trendlines MT5
Georgios Kalomoiropoulos
Trendlines  are the most essential tool of technical analysis in forex trading.  Unfortunately, most  traders don’t draw them correctly. Automated Trendlines indicator is a professional tool for serious traders that help you visualize the trending movement of the markets . AMAZING OFFER --> Activations from 5 to 20 for "MTF Supply Demand Zones" and "Automated Trendlines" There are two types of Trendlines Bullish Trendlines and Bearish Trendlines. In the uptrend, Forex trend line is drawn th
Renko System
Marco Montemari
This indicator can be considered as a trading system. It offers a different view to see the currency pair: full timeless indicator, can be used for manual trading or for automatized trading with some expert advisor. When the price reaches a threshold a new block is created according to the set mode. The indicator beside the Renko bars, shows also 3 moving averages. Features renko mode median renko custom median renko 3 moving averages wicks datetime indicator for each block custom notificatio
Candle Pattern Finder MT5
Pavel Zamoshnikov
4.33 (6)
This indicator searches for candlestick patterns. Its operation principle is based on Candlestick Charting Explained: Timeless Techniques for Trading Stocks and Futures by Gregory L. Morris. If a pattern is detected, the indicator displays a message at a bar closure. If you trade using the MetaTrader 4 terminal, then you can download the full analogue of the " Candle Pattern Finder for MT4 " indicator It recognizes the following patterns: Bullish/Bearish (possible settings in brackets) : Hamme
Swing Tracer
Ely Alsedy
5 (2)
it depends on ATR period to get swing points to help make better trading decisions  blue dot and red dot is the default color scheme of course you can change it later if you'd like  you can change the following : ATR PERIOD  sending notifications number of times to send notifications  sending notifications to your smart phone that's it very simple to use just drag and drop and follow the trend 
The 123 Pattern is one of the most popular, powerful and flexible chart patterns. The pattern is made up of three price points: a bottom, a peak or valley, and a Fibonacci retracement between 38.2% and 71.8%. A pattern is considered valid when the price breaks beyond the last peak or valley, moment at which the indicator plots an arrow, rises an alert, and the trade can be placed. [ Installation Guide | Update Guide | Troubleshooting | FAQ | All Products ] Clear trading signals Customizable c
The Trend Trade indicator displays assumed turning points of the price on the chart in the direction of the trend after correction. It is based on the data of the Prise Reversal oscillator with the period 6 and indicators which characterize strength and availability of the trend. When the value of Prise Reversal is in overbought or oversold area (area size is set by a user), and the current trend is confirmed, the Trend Trade indicator draws an arrow pointed to the further assumed price movement
Furia
Osaeldi Honorato De Jesus
The Fúria indicator was developed to work when the market is in trend, that is, you will rarely see any signs in consolidation zones. It can be used for both Forex and Binary Options. The signs plotted on the graph do not repaint or recalculate, even if you close and reopen your MT4 / MT5 they will be there. Wait for the signal to set on the candle before you can enter the next candle. ================================================== * BUFFERS: 0 (CALL) and 1 (PUT); * TYPE OF ENTRY: n
Leave a review for this product, and receive another "Free" product that you choose. You can see my other products here: https://www.mql5.com/en/users/zakri/seller Trend Detective is an advanced trend detection indicator which shows accurate entry points in direction of trend. It uses smart technology in order to detect entry points, trend changing points, and TP points. It also shows hit rate for current chart using selected parameters. Hit rate for this indicator on different charts can be
PipFinite Exit EDGE MT5
Karlo Wilson Vendiola
4.89 (36)
Did You Have A Profitable Trade But Suddenly Reversed? In a solid strategy, exiting a trade is equally important as entering. Exit EDGE helps maximize your current trade profit and avoid turning winning trades to losers. Never Miss An Exit Signal Again Monitor all pairs and timeframes in just 1 chart www.mql5.com/en/blogs/post/726558 How To Trade You can close your open trades as soon as you receive a signal Close your Buy orders if you receive an Exit Buy Signal. Close your Sell orde
Time And Sales Delta
Evgeny Shevtsov
5 (2)
The indicator displays the delta and the cumulative delta based on the "Time & Sales" deals list data. In addition to the standard timeframes, the indicator displays data regarding the seconds timeframes (S5, S10, S15, S20, S30) to choose from. Using the rectangle, user can select an arbitrary area in the indicator subwindow to view the ratio of the volumes of deals of buyers and sellers within this area. Indicator features: The indicator works correctly only on those trading symbols for whi
Bober Real MT5
Arnold Bobrinskii
4.76 (17)
Bober Real MT5 is a fully automatic Forex trading Expert Advisor. This robot was made in 2014 year and did a lot of profitbale trades during this period. So far over 7000% growth on my personal account. There was many updates but 2019 update is the best one. The robot can run on any instrument, but the results are better with EURGBP, GBPUSD, on the M5 timeframe. Robot doesn't show good results in tester or live account if you run incorrect sets. Set files for Live accounts availible only for c
Elevate Your Trading Experience with Wamek Trend Consult!   Unlock the power of precise market entry with our advanced trading tool designed to identify early and continuation trends. Wamek Trend Consult empowers traders to enter the market at the perfect moment, utilizing potent filters that reduce fake signals, enhancing trade accuracy, and ultimately increasing profitability.   Key Features: 1. Accurate Trend Identification: The Trend Consult indicator employs advanced algorithms and unparall
The standard Bollinger Bands indicator has been improved by integrating additional indications from the Standard Deviation indicator (StdDev), which gives an additional filter for confirming trading signals. In addition, the color of the indicator's lines shows the beginning of a trend, its development and exhaustion. This indicator has a signal block that notifies the trader of the beginning of the trend on any time frame to which it is attached. Settings Type of messages - select the type of
Double HMA MTF for MT5
Pavel Zamoshnikov
3.67 (3)
This is an advanced multi-timeframe version of the popular Hull Moving Average (HMA) Features Two lines of the Hull indicator of different timeframes on the same chart. The HMA line of the higher timeframe defines the trend, and the HMA line of the current timeframe defines the short-term price movements. A graphical panel with HMA indicator data from all timeframes at the same time . If the HMA switched its direction on any timeframe, the panel displays a question or exclamation mark with a tex
Buyers of this product also purchase
First of all Its worth emphasizing here that this Trading System is Non-Repainting   , Non Redrawing and Non Lagging Indicator Which makes it ideal from both manual and robot trading .  Online course, manual and download presets. The Smart Trend Trading System MT5 is a comprehensive trading solution tailored for new and experienced traders . It combines over 10 premium indicators and features more than 7 robust trading strategies , making it a versatile choice for diverse market conditions . Tre
Quantum Trend Sniper
Bogdan Ion Puscasu
4.91 (43)
Introducing   Quantum Trend Sniper Indicator , the groundbreaking MQL5 Indicator that's transforming the way you identify and trade trend reversals! Developed by a team of experienced traders with trading experience of over 13 years,   Quantum Trend Sniper Indicator   is designed to propel your trading journey to new heights with its innovative way of identifying trend reversals with extremely high accuracy. ***Buy Quantum Trend Sniper Indicator and you could get Quantum Breakout Indicator fo
Gold Stuff mt5
Vasiliy Strukov
4.89 (178)
Gold Stuff mt5 is a trend indicator designed specifically for gold and can also be used on any financial instrument. The indicator does not redraw and does not lag. Recommended time frame H1. Contact me immediately after the purchase to get   personal bonus!  You can get a free copy of our Strong Support and Trend Scanner indicator, please pm. me! Settings  and manual   here   SETTINGS Draw Arrow - on off. drawing arrows on the chart. Alerts -   on off audible alerts. E-mail notification - on of
First of all Its worth emphasizing here that this Trading Tool is Non Repainting , Non Redrawing and Non Lagging Indicator , Which makes it ideal for professional trading . Online course, user manual and demo. The Smart Price Action Concepts Indicator is a very powerful tool for both new and experienced traders . It packs more than 20 useful indicators into one , combining advanced trading ideas like Inner Circle Trader Analysis and Smart Money Concepts Trading Strategies . This indicator focus
FX Volume MT5
Daniel Stein
4.94 (17)
Visit our all-new   Stein Investments Welcome Page   to get the latest information, updates and trading strategies. FX Volume is the FIRST and ONLY volume indicator that provides a REAL insight into the market sentiment from a broker's point of view. It provides awesome insights into how institutional market participants, like brokers, are positioned in the Forex market, much faster than COT reports. Seeing this information directly on your chart is the real game-changer and breakthrough solut
FX Power MT5 NG
Daniel Stein
5 (5)
Trading GOLD, and currencies, with the dog walk strategy  - super smart Trading GOLD, and currencies, with the breakout strategy  - super easy Visit our all-new   Stein Investments Welcome Page   to get the latest information, updates and trading strategies. FX Power MT5 NG  is the next generation of our long-time very popular currency strength meter, FX Power.  And what does this next-generation strength meter offer? Everything you have loved about the original FX Power  PLUS GOLD/XAU st
Trend Screener Pro MT5
STE S.S.COMPANY
4.88 (64)
Unlock the Power of  Trends trading with Trend Screener Indicator: Your Ultimate Trend Trading Solution powered by fuzzy logic and Multi-currencies System ! Elevate your trend trading with Trend Screener, the revolutionary trend indicator powered by   fuzzy logic.  It is a powerful trend-following indicator that combines over  13 premium tools and features and 3 trading strategies  , making it a versatile choice to   make your Metatrader a Trend Analyzer. LIMITED TIME OFFER : Trend Screener Indi
Reversal First Impulse levels (RFI)      INSTRUCTIONS        RUS       -       ENG              R ecommended to use with an indicator   -   TREND PRO -  Version MT4                 A key element in trading is zones or levels from which decisions to buy or sell a trading instrument are made. Despite attempts by major players to conceal their presence in the market, they inevitably leave traces. Our task was to learn how to identify these traces and interpret them correctly. Main functions:: Di
Bill Williams Advanced
Siarhei Vashchylka
5 (5)
Bill Williams Advanced is designed for automatic chart analysis using Bill Williams' "Profitunity" system. The indicator analyzes four timeframes at once. Manual (Be sure to read before purchasing) Advantages 1. Automatically analyzes the chart using the "Profitunity" system of Bill Williams. The found signals are placed in a table in the corner of the screen. 2. Equipped with a trend filter based on the Alligator indicator. Most of the system signals are recommended to be used only accordi
Top indicator for MT5   providing accurate signals to enter a trade without repainting! It can be applied to any financial assets:   forex, cryptocurrencies, metals, stocks, indices .  Watch  the video  (6:22) with an example of processing only one signal that paid off the indicator! MT4 version is here It will provide pretty accurate trading signals and tell you when it's best to open a trade and close it. Most traders improve their trading results during the first trading week with the help of
ICT, SMC, SMART MONEY CONCEPTS, SMART MONEY, Smart Money Concept, Support and Resistance, Trend Analysis, Price Action, Market Structure, Order Blocks, BOS/CHoCH,   Breaker Blocks ,  Momentum Shift,   Supply&Demand Zone/Order Blocks , Strong Imbalance, HH/LL/HL/LH,    Fair Value Gap, FVG,  Premium  &   Discount   Zones, Fibonacci Retracement, OTE, Buy Side Liquidity, Sell Side Liquidity, BSL/SSL Taken, Equal Highs & Lows, MTF Dashboard, Multiple Time Frame, BigBar, HTF OB, HTF Market Structure, 
TrendMaestro5
Stefano Frisetti
note: this indicator is for METATRADER4, if you want the version for METATRADER5 this is the link:  https://www.mql5.com/it/market/product/108106 TRENDMAESTRO ver 2.4 TRENDMAESTRO recognizes a new TREND in the bud, he never makes mistakes. The certainty of identifying a new TREND is priceless. DESCRIPTION TRENDMAESTRO identifies a new TREND in the bud, this indicator examines the volatility, volumes and momentum to identify the moment in which there is an explosion of one or more of these data a
** All Symbols x All Timeframes scan just by pressing scanner button ** ***Contact me after purchase to send you instructions and add you in "123 scanner group" for sharing or seeing experiences with other users. After 17 years of experience in the markets and programming, Winner indicator is ready. I would like to share with you! Introduction The 123 Pattern Scanner indicator with a special enhanced algorithm is a very repetitive common pattern finder with a high success rate . Interestingly,
TPSproTREND PrO MT5
Roman Podpora
4.88 (8)
TPSpro TRENDPRO  - is a trend indicator that automatically analyzes the market and provides information about the trend and each of its changes, as well as giving signals for entering trades without redrawing! The indicator uses each candle, analyzing them separately. referring to different impulses - up or down impulse. Exact entry points into transactions for currencies, crypto, metals, stocks, indices!  -  Version MT4               DETAILED DESCRIPTION               R ecommended to use with
Profit from market structure changes as price reverses and pulls back. The market structure reversal alert indicator identifies when a trend or price move is approaching exhaustion and ready to reverse. It alerts you to changes in market structure which typically occur when a reversal or major pullback are about to happen. The indicator identifies breakouts and price momentum initially, every time a new high or low is formed near a possible exhaustion point. The indicator draws in a rectangle on
Introducing   Quantum Breakout PRO , the groundbreaking MQL5 Indicator that's transforming the way you trade Breakout Zones! Developed by a team of experienced traders with trading experience of over 13 years,   Quantum Breakout PRO   is designed to propel your trading journey to new heights with its innovative and dynamic breakout zone strategy. Quantum Breakout Indicator will give you signal arrows on breakout zones with 5 profit target zones and stop loss suggestion based on the breako
XQ Indicator MetaTrader 5
Marzena Maria Szmit
5 (1)
Step into the realm of Forex trading with confidence and precision using XQ, a cutting-edge Forex indicator designed to elevate your trading game to unprecedented heights. Whether you're a seasoned trader or just stepping into the world of currency exchange, XQ Forex Indicator empowers you with the insights and signals needed to make informed trading decisions. The signal conditions are a combination of three indicators, and XQ Forex Indicator only display  medium and long-term trends . The ind
AW Trend Predictor MT5
AW Trading Software Limited
4.78 (58)
The combination of trend and breakdown levels in one system. An advanced indicator algorithm filters market noise, determines the trend, entry points, as well as possible exit levels. Indicator signals are recorded in a statistical module, which allows you to select the most suitable tools, showing the effectiveness of the signal history. The indicator calculates Take Profit and Stop Loss marks. Manual and instruction ->  HERE  / MT4 version ->  HERE How to trade with the indicator:  Trading wit
Golden Gate Algo MT5
James David Lane
4 (6)
Introducing GoldenGate Algo: A Cutting-Edge Trading Solution!  Discover a revolutionary approach to trading with GoldenGate Algo (GGA), an advanced indicator designed to elevate your trading experience. GGA provides a comprehensive set of features to empower users with precision and confidence in their trading decisions. Send me a message once you have purchased for access to the private Telegram. No re-painting! Pairs:   Any TimeFrames:   15m up to H1 Key Features: Buy and Sell Arrow Indic
"Piranha" - an autonomous trading system that determines overbought and oversold levels on the chart. Red and blue zones represent overbought and oversold levels respectively. Entry points are marked with arrows: a downward arrow in the red zone for "sell" and an upward arrow in the blue zone for "buy". The Take profit level is indicated by the green moving average. Key features: Adjusting the Take profit level as the green moving average changes position. Averaging ability when a new market e
Quantum Heiken Ashi PRO MT5
Bogdan Ion Puscasu
4.5 (8)
Introducing the Quantum Heiken Ashi PRO charts with integrated alerts Designed to provide clear insights into market trends, the Heiken Ashi candles are renowned for their ability to filter out noise and eliminate false signals. Say goodbye to confusing price fluctuations and hello to a smoother, more reliable chart representation. What makes the Quantum Heiken Ashi PRO truly unique is its innovative formula, which transforms traditional candlestick data into easy-to-read colored bars. Red and g
Easy By Sell is a market indicator for opening and closing positions. It becomes easy to track market entries with alerts. It indicates trend reversal points when a price reaches extreme values ​​and the most favorable time to enter the market. it is as effective as a Fibonacci to find a level but it uses different tools such as an algorithm based on ATR indicators and Stochastic Oscillator. You can modify these two parameters as you wish to adapt the settings to the desired period. My othe
IX Power MT5
Daniel Stein
5 (3)
IX Power   finally brings the unbeatable precision of FX Power to all your trading symbols. It accurately determines the intensity of short, medium and long-term trends in your favourite indices, stocks, commodities, ETFs, and even cryptocurrencies. You can   analyse everything   your terminal has to offer. Try it out and experience how   your timing improves significantly   when trading. Read about our latest strategic development -  Easy scalping with IX Power Visit our all-new   Stein Inve
Advanced Supply Demand MT5
Bernhard Schweigert
4.53 (15)
Best Solution for any Newbie or Expert Trader! This indicator is a unique, high quality and affordable trading tool because we have incorporated a number of proprietary features and a new formula. With this update, you will be able to show double timeframe zones. You will not only be able to show a higher TF but to show both, the chart TF, PLUS the higher TF: SHOWING NESTED ZONES. All Supply Demand traders will love it. :) Important Information Revealed Maximize the potential of Advanced Suppl
Gartley Hunter Multi
Siarhei Vashchylka
5 (7)
Gartley Hunter Multi - An indicator for searching for harmonic patterns simultaneously on dozens of trading instruments and on all possible timeframes. Manual (Be sure to read before purchasing) | Version for MT4 Advantages 1. Patterns: Gartley, Butterfly, Shark, Crab. Bat, Alternate Bat, Deep Crab, Cypher 2. Simultaneous search for patterns on dozens of trading instruments and on all possible timeframes 3. Search for patterns of all possible sizes. From the smallest to the largest 4. A
The ADR Reversal Indicator shows you at a glance where price is currently trading in relation to it's normal average daily range. You will get instant alerts via pop-up, email or push when price exceeds it's average range and levels above it of your choosing so you can jump into pullbacks and reversals quickly. The indicator draws horizontal lines on the chart at the average daily range extremes and also extensions above those levels which have mathematical probabilities attached to them of pric
Fractal Advanced MT5
Siarhei Vashchylka
5 (3)
Fractal Advanced - displays Fractal and Alligator indicators on the price chart. Has wide options for settings and customization. It is also equipped with alerts and a hotkey system. Manual (Be sure to read before purchasing) | Version for MT4 Advantages 1. The indicator does not fill the entire chart with fractals, but allows you to display only relevant signals. 2. The number of fractals is adjusted by scrolling the mouse while holding down the Shift key. 3. Instantly show/hide the Alligator
FxaccurateLS
Shiv Raj Kumawat
WHY IS OUR FXACCCURATE LS MT5 THE PROFITABLE ? PROTECT YOUR CAPITAL WITH RISK MANAGEMENT Gives entry, stop and target levels from time to time. It finds Trading opportunities by analyzing what the price is doing during established trends. POWERFUL INDICATOR FOR A RELIABLE STRATEGIES We have made these indicators with a lot of years of hard work. It is made at a very advanced level. Established trends provide dozens of trading opportunities, but most trend indicators completely ignore them!
This dashboard shows the latest available   harmonic patterns   for the selected symbols, so you will save time and be more efficient /   MT4 version . Free Indicator:   Basic Harmonic Pattern Indicator columns Symbol:  the selected symbols will appear Trend:   bullish or bearish Pattern:  type of pattern (gartley, butterfly, bat, crab, shark, cypher or ABCD) Entry:  entry price SL:  stop loss price TP1:   1st take profit price TP2:  2nd take profit price TP3:  3rd take profit price Current
MTF Supply Demand Zones MT5
Georgios Kalomoiropoulos
Next Generation Of Automated Supply And Demand Zones. New and Innovative Algorithm that Works At Any Chart. All Zones Are Being Created Dynamically According To Price Action Of The Market. AMAZING OFFER --> Activations from 5 to 20 for "MTF Supply Demand Zones" and "Automated Trendlines" TWO TYPES OF ALERTS -->  1) WHEN PRICE HITS A ZONE    2)WHEN A NEW ZONE IS FORMED  If you get the MTF Supply Demand Zones you can join the " Trade Like Me " Video Series. It contains 14 Live Sessions wh
More from author
The indicator allows you to determine the current price direction and market volatility. This version of the Traders Dynamic Index (TDI) has the redrawing of the historical data eliminated, the algorithm calculation speed optimized, more external parameters for a more precise adjustments, and its functionalities extended: added the selection of the initial oscillator and the smoothing methods of the averages. Parameters: Mode Osc - estimation oscillator selection; Period Osc - the calculation
Mini Charts MT5
Sergey Efimenko
4.91 (23)
The indicator displays minimized charts of any symbol from any timeframe. The maximum number of displayed charts is 28. The charts can be located both in the main and bottom window. Two display modes: candles and bars. Amount of displayed data (bars and candles) and chart sizes are adjustable. To work with a mini chat, you must first put the desired indicator(s) on a regular chart, then save it as a template and apply a template for the mini chart via the appropriate parameter, for example, for
FREE
The utility is designed to change the symbol of the current, all or selected charts, change the timeframe , as well as to synchronously move through the history of all charts (automatically or by clicking the button). The list of symbols is read from the "Market Watch" or is set manually. The color, size and position of the buttons are customizable. Synchronization of charts occurs according to the time of the first visible bar when you press the "SYNC" button or when moving the mouse/keyboard i
CPM Extended MT5
Sergey Efimenko
4.43 (7)
The algorithm is based on the idea of the Currency Power Meter indicator. In this version, the number of displayed values is unlimited, its code is more compact and fast, values of the current bar can be obtained through indicator buffers. What the indicator shows : a thin band and the upper number in front of the currency shows the relative strength index for the last N hours (N is set in the parameters in the variable 'Hours'), a wider band shows the daily index. The more currency pairs using
FREE
Mini Charts
Sergey Efimenko
4.31 (16)
The indicator displays minimized charts of any symbol from any timeframe. The maximum number of displayed charts is 28. The charts can be located both in the main and bottom window. Two display modes: candles and bars. Amount of displayed data (bars and candles) and chart sizes are adjustable. Parameters: Corner - display start corner (selected from the list) CandleMode - display mode: true - candles, false - bars ShowLastBid - enable/disable the last price display LastBidShiftX - last price lin
FREE
This is a linear indicator of a currency power having the ability to filter by smoothing values. It shows the current power of selected currencies (the maximum number is 8), as well as historical values. Calculation depends on the selected chart timeframe the indicator is launched at. The indicator displays data as lines for all currencies or as a histogram for the current currency pair. The intersection of the currency strength indices for the current currency pair is additionally displayed as
The uniqueness of this indicator lies in the volume accounting algorithm: accumulation occurs directly for the selected period without reference to the beginning of the day. The last bars can be excluded from the calculation, then the current data will have less influence on the significant levels (volumes) formed earlier. For a more accurate calculation, data from the M1 graph is used by default. The step of distribution of price volumes is regulated. By default, the right border of the display
CPM Extended
Sergey Efimenko
4.6 (20)
The algorithm is based on the idea of the Currency Power Meter indicator. In this version, the number of displayed values is unlimited, its code is more compact and fast, values of the current bar can be obtained through indicator buffers. What the indicator shows : a thin band and the upper number in front of the currency shows the relative strength index for the last N hours (N is set in the parameters in the variable 'Hours'), a wider band shows the daily index. The more currency pairs using
FREE
Extended version of the "Keltner Channel" indicator. This is an analytical tool that allows you to determine the ratio of the price position relative to its volatility. You can use 26 types of moving average and 11 price options to calculate the middle line of the indicator. Configurable alerts will notify you when the price touches the upper or lower border of the channel. Available average types: Simple Moving Average, Exponential Moving Average, Wilder Exponential Moving Average, Linear Weig
The indicator displays harmonic patterns on the chart based on Dynamic ZigZag ( https://www.mql5.com/en/market/product/5356 ) and is almost a complete analog of one of the versions of well-known korHarmonics. The indicator recognizes the following patterns and their varieties: ABCD, Gartley (Butterfly, Crab, Bat), 3Drives, 5-0, Batman, SHS, One2One, Camel, Triangles, WXY, Fibo and Vibrations. Only display of ABCD and Gartley patterns is enabled in the settings by default. The reverse line allows
This is an MTF indicator of support and resistance levels based on Advanced ZigZag Dynamic and/or Extended Fractals indicator extremums with price labels (can be disabled). More higher TFs can be selected for MTF mode. By default, the levels are generated based on ZigZag indicator dots. Fractals indicator dots can also be used together with ZigZag or instead of it. In order to simplify the use and save CPU time, calculation is performed once per each bar at its opening. Parameters: ForcedTF - ch
The indicator shows harmonic patterns on the chart without repainting with the minimum possible lag. The search for indicator tops is based on the wave principle of price analysis. Advanced settings allow you to choose parameters for your trading style. At the opening of a candle (bar), when a new pattern is formed, an arrow of the probable direction of the price movement is fixed, which remains unchanged. The indicator recognizes the following patterns and their varieties: ABCD, Gartley (Butter
The indicator allows you to determine the current price direction and market volatility. This version of the Traders Dynamic Index  (TDI) has the redrawing of the historical data eliminated, the algorithm calculation speed optimized, more external parameters for a more precise adjustments, and its functionalities extended: added the selection of the initial oscillator and the smoothing methods of the averages. Parameters: Mode Osc - estimation oscillator selection; Period Osc - the calculation p
Advanced Power Trend
Sergey Efimenko
5 (2)
Unique "scalping" trend indicator with the feature of multi-layered smoothing of the resulting lines and a wide selection of parameters. It helps determine a probable change in the trend or a correction virtually near the very beginning of the movement. The toggled intersection arrows are fixed and appear at the opening of a new bar, but, with enough experience, it is possible to look for entry opportunities as soon as the indicator lines intersect at the unfinished bar. The signal appearance li
The uniqueness of this indicator lies in the volume accounting algorithm: accumulation occurs directly for the selected period without reference to the beginning of the day. The last bars can be excluded from the calculation, then the current data will have less influence on the significant levels (volumes) formed earlier. For a more accurate calculation, data from the M1 graph is used by default. The step of distribution of price volumes is regulated. By default, the right border of the display
True SSRC nrp
Sergey Efimenko
5 (2)
The indicator shows (optional): Spearman's rank correlation coefficient, Pearson's linear correlation coefficient, Kendall's rank correlation coefficient, and Fechner's sign correlation coefficient. This oscillator shows the points of possible market reversal when the price goes beyond the overbought and oversold levels. There are 4 methods for additional filtering of the obtained values: simple, exponential, smoothed, linearly weighted. After the bar is closed, the values are fixed and not rep
If you trade by levels, then this indicator is for you. The indicator displays support and resistance levels for the selected timeframes, additionally showing how many points to the nearest levels, as well as between which levels the current price is in the form of a color scale and percentages. Location anywhere on the chart, the ability to scale, the calculation offset taking into account the hourly difference of your broker, the choice of colors and other parameters will allow you to cus
This is an extended version of Keltner channel. You can use 21 types of Moving Average and 11 methods of calculating the indicator's center line. Moving Average types: Simple Moving Average, Exponential Moving Average, Wilder Exponential Moving Average, Linear Weighted Moving Average, Sine Weighted Moving Average, Triangular Moving Average, Least Square Moving Average (or EPMA, Linear Regression Line), Smoothed Moving Average, Hull Moving Average by Alan Hull, Zero-Lag Exponential Moving Average
The indicator displays harmonic patterns on the chart based on Dynamic ZigZag ( https://www.mql5.com/en/market/product/5357 ) and is almost a complete analog of one of the versions of well-known korHarmonics. The indicator recognizes the following patterns and their varieties: ABCD, Gartley (Butterfly, Crab, Bat), 3Drives, 5-0, Batman, SHS, One2One, Camel, Triangles, WXY, Fibo and Vibrations. Only display of ABCD and Gartley patterns is enabled in the settings by default. The reverse line allows
This is an MTF indicator of support and resistance levels based on Advanced ZigZag Dynamic and/or Extended Fractals indicator extremums with price labels (can be disabled). More higher TFs can be selected for MTF mode. By default, the levels are generated based on ZigZag indicator dots. Fractals indicator dots can also be used together with ZigZag or instead of it. In order to simplify the use and save CPU time, calculation is performed once per each bar at its opening. Parameters: ForcedTF - ch
This is a linear indicator of a currency power having the ability to filter by smoothing values. It shows the current power of selected currencies (the maximum number is 8), as well as historical values. Calculation depends on the selected chart timeframe the indicator is launched at. The indicator displays data as lines for all currencies or as a histogram for the current currency pair. The intersection of the currency strength indices for the current currency pair is additionally displayed as
The indicator shows harmonic patterns on the chart without repainting with the minimum possible lag. The search for indicator tops is based on the wave principle of price analysis. Advanced settings allow you to choose parameters for your trading style. At the opening of a candle (bar), when a new pattern is formed, an arrow of the probable direction of the price movement is fixed, which remains unchanged. The indicator recognizes the following patterns and their varieties: ABCD, Gartley (Butter
The utility is designed to   change the symbol   of the current, all or selected charts,   change the timeframe , as well as to   synchronously move through the history   of all charts (automatically or by clicking the button). The list of symbols is read from the "Market Watch" or is set manually. The color, size and position of the buttons are customizable. Synchronization of charts occurs according to the time of the first visible bar when you press the "SYNC" button or when moving the mouse/
The indicator shows (optional): Spearman's rank correlation coefficient, Pearson's linear correlation coefficient, Kendall's rank correlation coefficient, and Fechner's sign correlation coefficient. This oscillator shows the points of possible market reversal when the price goes beyond the overbought and oversold levels. There are 4 methods for additional filtering of the obtained values: simple, exponential, smoothed, linearly weighted. After the bar is closed, the values are fixed and not rep
If you trade by levels, then this indicator is for you. The indicator displays support and resistance levels for the selected timeframes, additionally showing how many points to the nearest levels, as well as between which levels the current price is in the form of a color scale and percentages. Location anywhere on the chart, the ability to scale, the calculation offset taking into account the hourly difference of your broker, the choice of colors and other parameters will allow you to cus
Filter:
No reviews
Reply to review
Version 1.2 2022.07.12
The code has been optimized for the current version of the terminal.
Version 1.1 2020.04.08
Optimized for the current version of the terminal.