Extended Traders Dynamic Index
- Indicators
- Sergey Efimenko
- Version: 1.6
- Updated: 28 November 2021
- Activations: 10
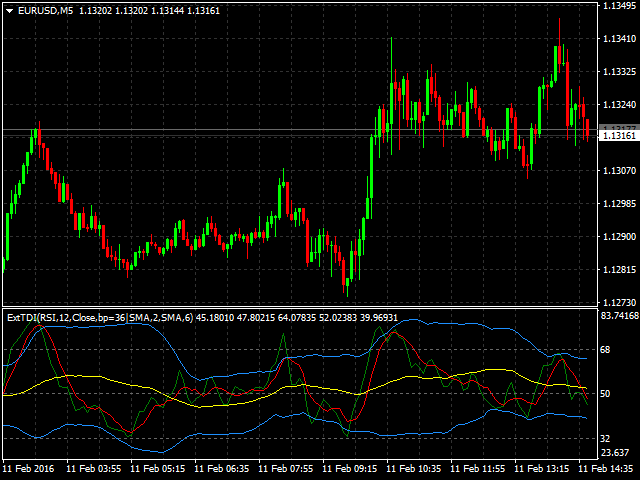
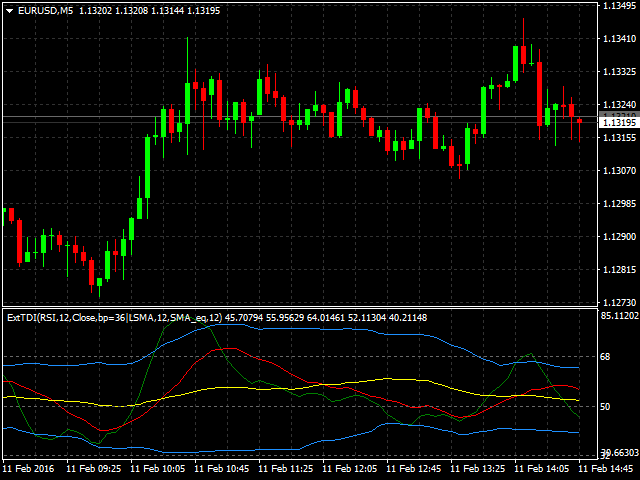
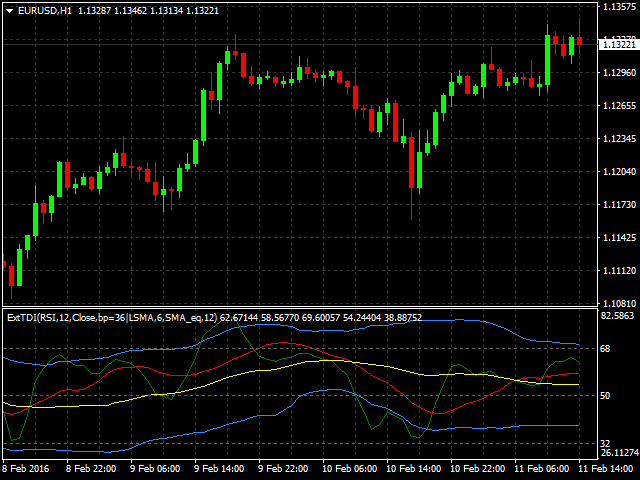
The indicator allows you to determine the current price direction and market volatility. This version of the Traders Dynamic Index (TDI) has the redrawing of the historical data eliminated, the algorithm calculation speed optimized, more external parameters for a more precise adjustments, and its functionalities extended: added the selection of the initial oscillator and the smoothing methods of the averages.
Parameters:
- Mode Osc - estimation oscillator selection;
- Period Osc - the calculation period of the oscillator used;
- Price Osc - applied price for the oscillation calculation;
- Osc volatility bands period - volatility period of the oscillator;
- Osc volatility bands multiplier - volatility multiplier of the oscillator;
- Smoothing Osc price line period - smoothing period of the main line;
- Smoothing Osc price line method - smoothing method of the main line;
- Smoothing Osc signal line period - smoothing period of the signal line;
- Smoothing Osc signal line method - smoothing method of the signal line;
- Use original levels - enables the addition of the initial horizontal levels of the indicator.
Have been using this for some time and it is very good . Would be even better if you could switch time frames in it so you could have the 5 min and 15 min on the 5 min chart .