Elliott Wave Counter
- Utilities
- Omar Alkassar
- Version: 1.70
- Updated: 20 August 2023
- Activations: 10
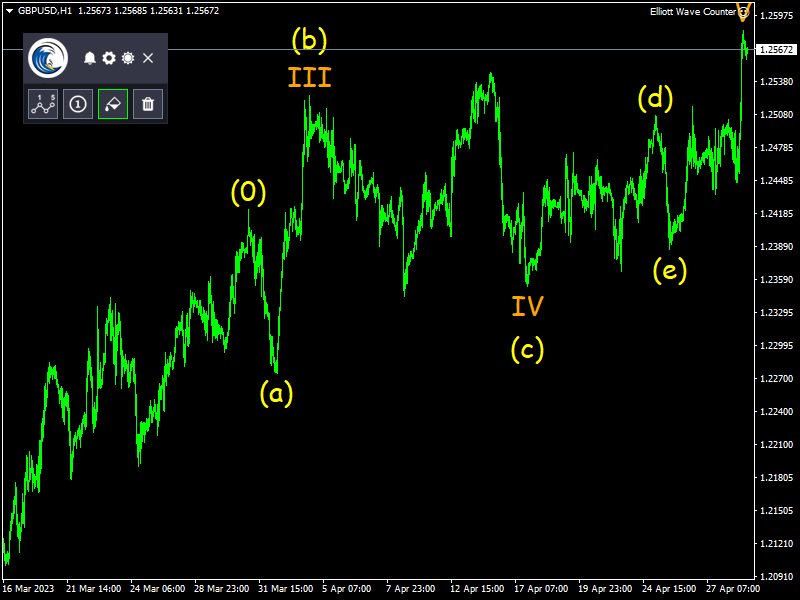
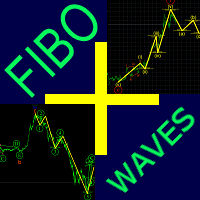
Elliott Wave Counter is a panel for rapid and user-friendly manual markup of Elliott waves. One can select a color and a level of marks. There are also functions for removing the last markup and the entire markup made by the tool. Markup is made in one click. Click five times - have five waves! Elliott Wave Counter will be a great instrument both for beginners and professional analysts of Elliott waves.
Elliott Wave Counter Installation & Inputs Guide
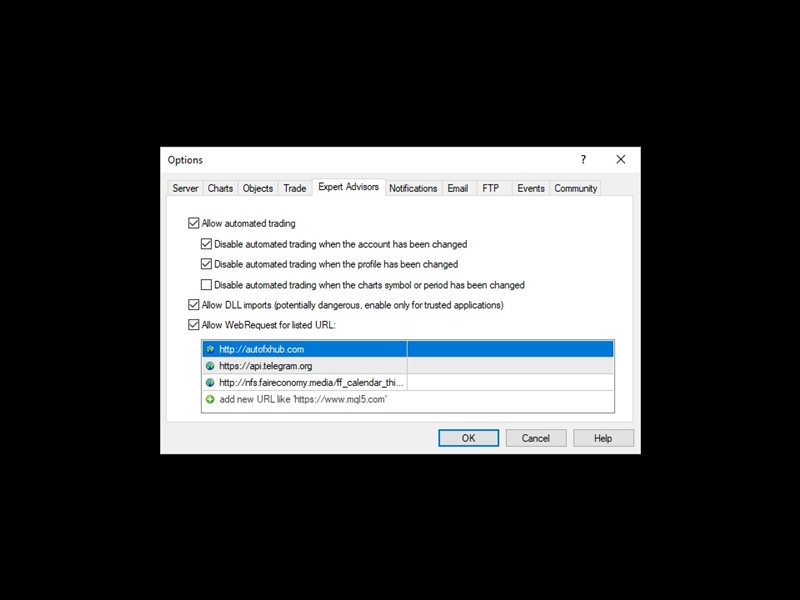
if you want to get notifications about the EA add URL (http://autofxhub.com) MT5 terminal (see screenshot).
MT4 Version https://www.mql5.com/en/market/product/14016
MT5 Version https://www.mql5.com/en/market/product/15081
General Inputs:
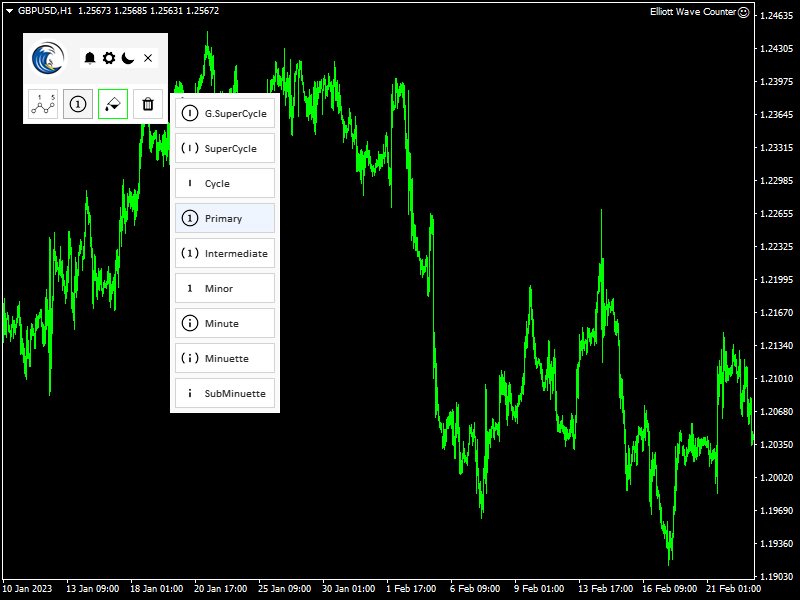
- Wave Type Button: This button allows users to select the type of wave pattern they want to highlight on the chart. The options available include impulse waves, corrective waves, and other custom wave patterns.
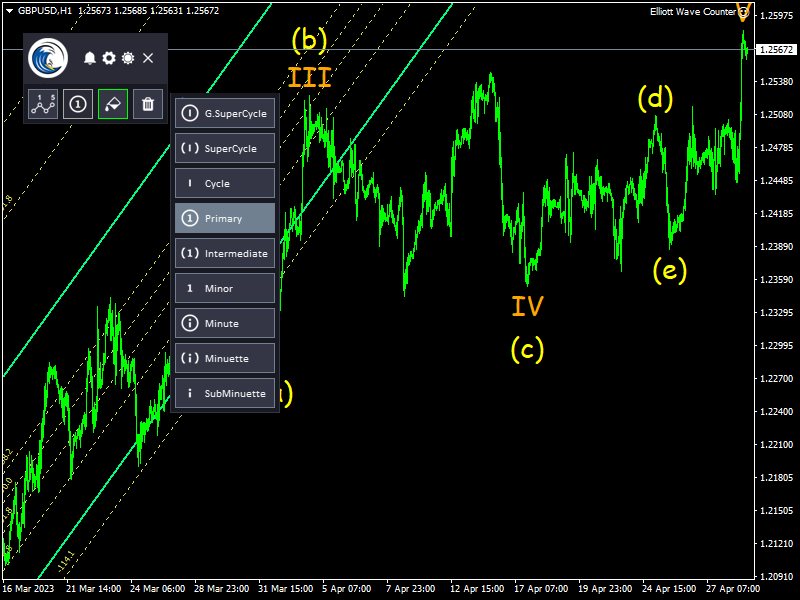
- Wave Level Button: This button allows users to select the level of wave pattern they want to highlight on the chart. The options available include primary, intermediate, and minor wave levels.
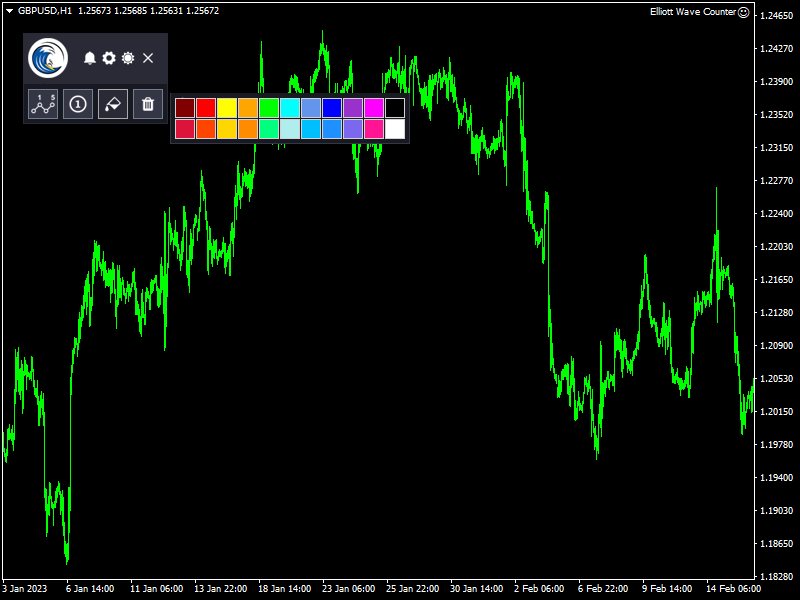
- Wave Color: This button allows users to choose the color of the wave patterns they want to highlight on the chart. Users can select from a range of colors to suit their preference.
- Delete All Button: This button allows users to delete all selected objects on the chart, including any wave patterns that have been marked using the Elliott Wave Counter.
How the program works:
One chart for all pairs: You can use the same window to see different charts, the tool automatically hides objects from other pairs and show it again when you come back to the first one.
First, Select the type of wave pattern you want to highlight on the chart using the Wave Type button. The options available include impulse waves, corrective waves, and other custom wave patterns.
Select the level of wave pattern you want to highlight on the chart using the Wave Level button. The options available include primary, intermediate, and minor wave levels.
Then if you need to change the color of the wave, you can choose the color of the wave patterns you want to highlight on the chart using the Wave Color button. This allows you to customize the appearance of the wave patterns to suit your preference (this will help you to differentiate between alternate wave counts).
The tool is ready to start marking, after clicking, you can place labels on the chart by moving the mouse and pressing the draw shortcut. Simply move your mouse to the desired bar where your wave starts. A curser line will indicate the bar that you are pointing at. If you place your mouse below the bar the low of the bar will be used as price reference, if you place your pointer above the bar the high of it will be the price reference. Make a click when ready.
After setting the wave's start point, the first wave will appear under the mouse. This could be 1, A or W depending upon the pattern that you are counting. In the same manner, set the point for placing the first wave. No matter how high or low you place your wave, the curser line will be your wave's time reference, and the high (if you clicked above the bar) or the low (if you clicked below the bar) will be your wave's price reference. Price reference and time reference will be used to calculate the projections for the next waves.
Select/Deselect Waves.
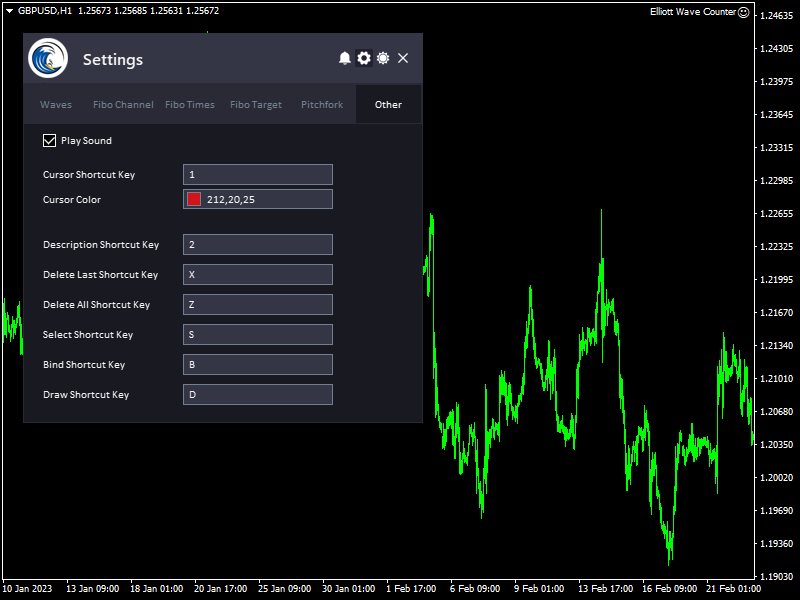
Now, by pressing select shortcut key you can select/deselects all objects on the chart.
Deleting all objects:
If you want to delete all objects on the chart, including any wave patterns that have been marked using the Elliott Wave Counter, click on the Delete All button or press the delete all shortcut key.
Deleting the last wave:
Just click on one of the pattern's waves, and then press the delete last shortcut key and the last wave of your pattern will be deleted. Press the key as many times as you need to reach the desired wave and delete it.
Bind Waves:
You can also press bind shortcut key to move the labels to the high and low and organize it.
Fibonacci Channel:
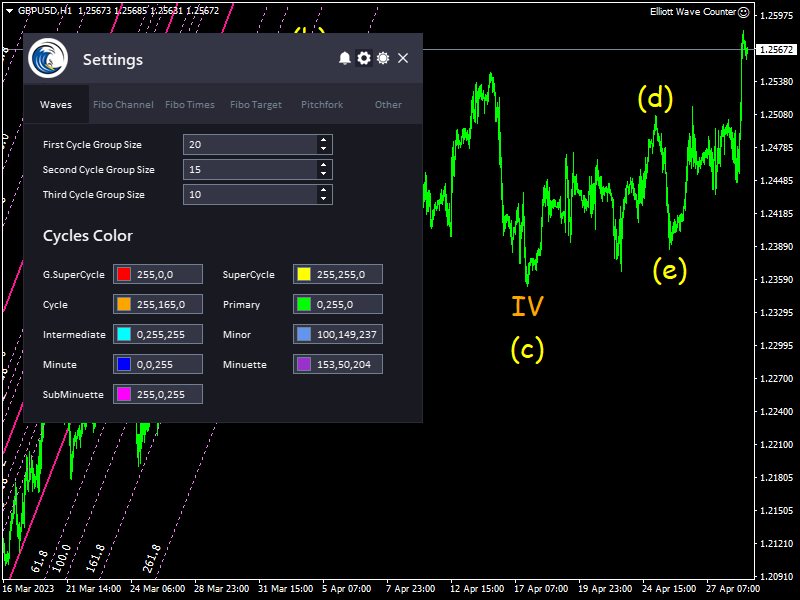
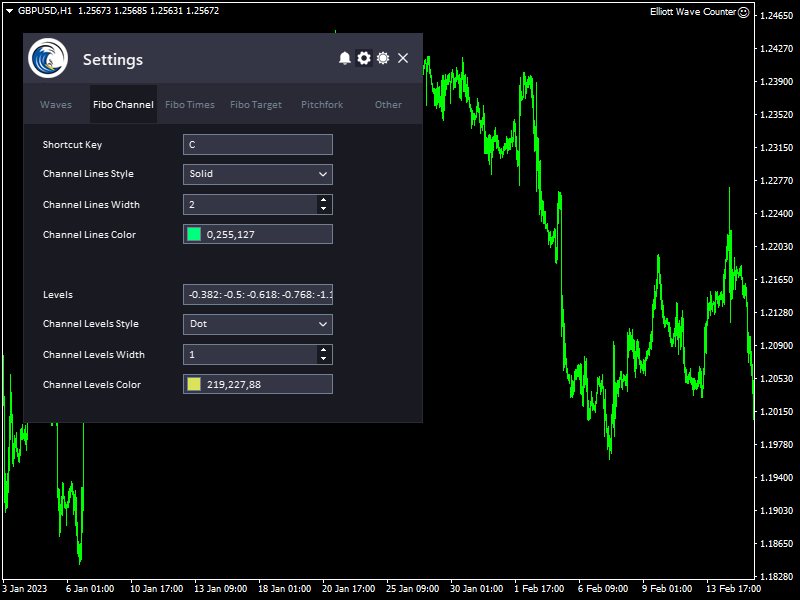
When selecting the waves and pressing the Fibonacci Channel shortcut key, the tool will display the channels between the waves.
Fibonacci time zones:
When selecting the waves and pressing the Fibonacci Times shortcut key, the tool will display the Fibonacci time zones between the waves.
Fibonacci expansion levels:
When selecting the waves and pressing the Fibonacci Target shortcut key, the tool will display the Fibonacci expansion levels between the waves.
Pitchfork levels:
When selecting the waves and pressing the Pitchfork shortcut key, the tool will display the Pitchfork levels between the waves.
And more...
Feel free to give your opinion about the tool .... and please inform me of any improvements needed to be done.
Please contact me for any questions or assistance here.
#tags Elliott wave count counter marker technical analysis trading tool graphing GUI
