Monitor para Gradiente Linear
- Indicators
- Rodrigo Bordini Correa
- Version: 1.0
- Activations: 5
HedgingMonitor: Professional Order Visualization for MT5
HedgingMonitor is a professional indicator for MetaTrader 5 that displays detailed information about all your open and pending orders in an organized and customizable visual panel. Ideal for traders who use hedging strategies or manage multiple orders simultaneously.
Key Features:
-
Intuitive Visual Interface: View all your orders in a single panel, with color coding to quickly identify buy orders (green) and sell orders (red).
-
Price Organization: Orders are automatically displayed from highest to lowest price, allowing you to quickly visualize the distribution of your positions.
-
Detailed Display: For each order, see the type (Buy/Sell), price, volume, current profit, and Take Profit with distance in points.
-
Advanced Formatting: Clear visual separators, allowing you to quickly locate the most important information.
-
Custom Design: Adjust colors, font size, positioning, and other visual characteristics according to your preference.
-
Page Navigation: Support for viewing multiple orders with an integrated navigation system when you have more orders than fit on the screen.
-
Order Differentiation: Clear visual distinction between open orders (B/S) and pending orders (BP/SP).
-
Real-Time Updates: Continuous monitoring of the current status of orders with automatic updates.
Interface Overview
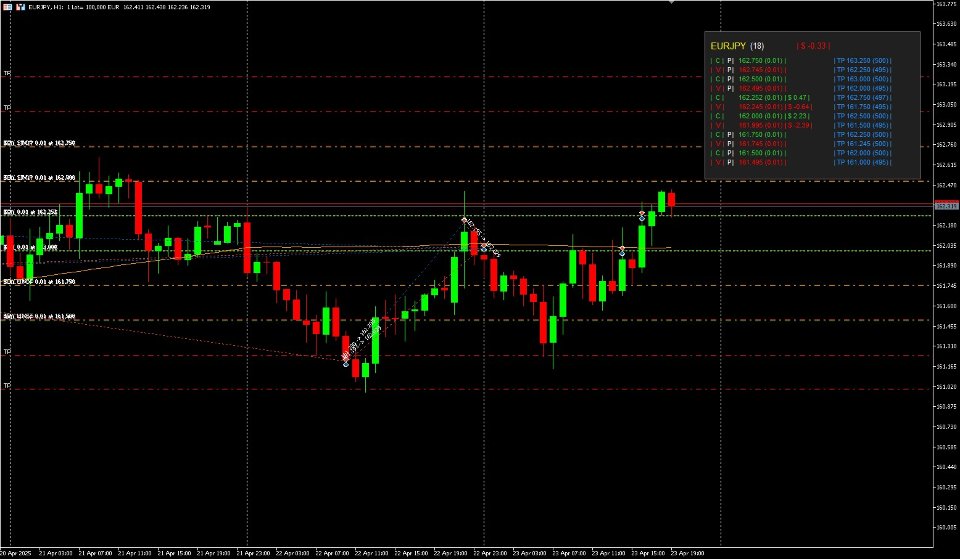
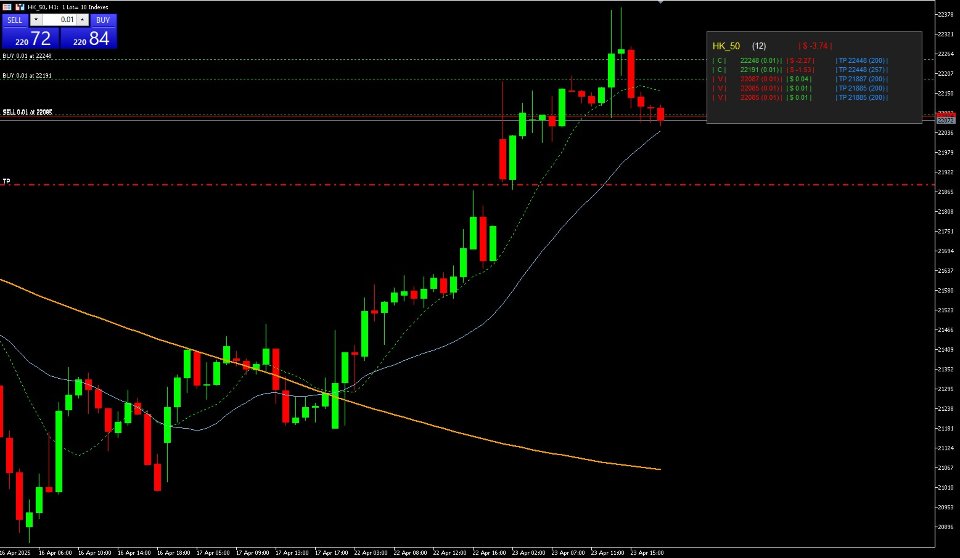
HedgingMonitor presents an elegant visual panel that appears directly on your MetaTrader 5 chart, displaying all your open positions and pending orders in an organized manner.
Detailed Functionality (from top to bottom)
Panel Header
- Asset Name: Displayed in yellow and larger font, clearly shows the symbol being monitored (e.g., EURUSD).
- Current Spread: Appears right after the asset name in parentheses (e.g., (2)), indicating the current spread in points.
- Total Balance: Centered at the top of the panel, shows the total profit/loss of open positions in the format "| $ 135.65 |". Green color indicates profit, while red indicates loss.
Order List
All orders are organized by price, from highest to lowest, making it easy to visualize the distribution of your positions.
Display Format for Open Orders:
- Order Type: "| B |" (Buy in green) or "| S |" (Sell in red) between vertical bars of the same color, for quick identification.
- Price and Volume: Displayed in the color corresponding to the order (green for buy, red for sell) in the format "1.1050 (0.10) |" - where the first value is the entry price and the value in parentheses is the volume in lots.
- Profit/Loss: Displayed in the format "| $ 2.35 |" in green for profit or red for loss. This field shows the current result of the position.
- Take Profit: If configured, appears in blue in the format "| TP 1.1150 (100) |" - the first value is the TP price and the value in parentheses is the distance in points to the TP.
Display Format for Pending Orders:
- Order Type: "| B | P |" (Buy Pending) or "| S | P |" - the main letter (B/S) in the corresponding color (green/red) and the letter P in white.
- Price and Volume: Same format as open orders.
- Central Field: Intentionally empty for pending orders (since they don't have current profit/loss).
- Take Profit: Same format as open orders.
Navigation
If you have more orders than can be displayed at once (more than 18 by default):
- Navigation Buttons: Buttons "|<|" and "|>|" allow you to navigate between order pages.
- Page Indicator: Between the navigation buttons, shows the current page and the total (e.g., "1/3").
Color Coding and Motivations
- Green (Buy): Used to quickly identify buy orders, following market convention.
- Red (Sell): Used to quickly identify sell orders, following market convention.
- Yellow (Symbol): Highlights the name of the asset being monitored.
- Blue (Take Profit): Visually differentiates Take Profit information from the rest.
- White (Letter P): Clearly highlights that the order is pending and has not yet been executed.
Customization
The indicator allows you to customize:
- Colors for each element (text, background, buy, sell, TP)
- Font size and font type
- Panel positioning on the chart
- Maximum number of visible lines
Practical Benefits
- Visual Organization: Eliminates the need to switch between windows to check your positions.
- Hedging Strategy Monitoring: Perfect for traders who maintain simultaneous buy and sell positions.
- Risk Visualization: Price organization helps you quickly visualize the distribution of your exposures.
- Take Profit Management: Clearly see the distance in points to your target, facilitating decisions about adjustments.
- Focused Design: Shows only relevant information, without visual clutter.
This indicator is designed for traders who value clarity, organization, and efficiency in managing multiple positions, especially useful in complex hedging or grid strategies.
