Cross MA dashboard
- Indicators
- Sergei Gromov
- Version: 2.20
- Activations: 20
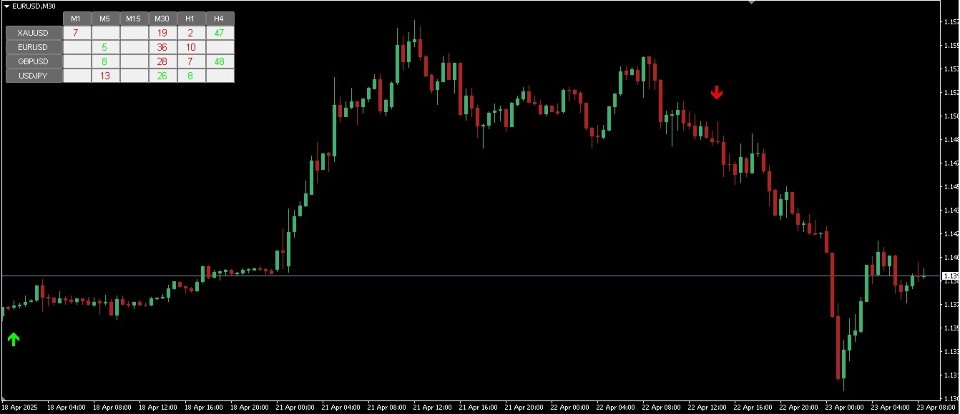
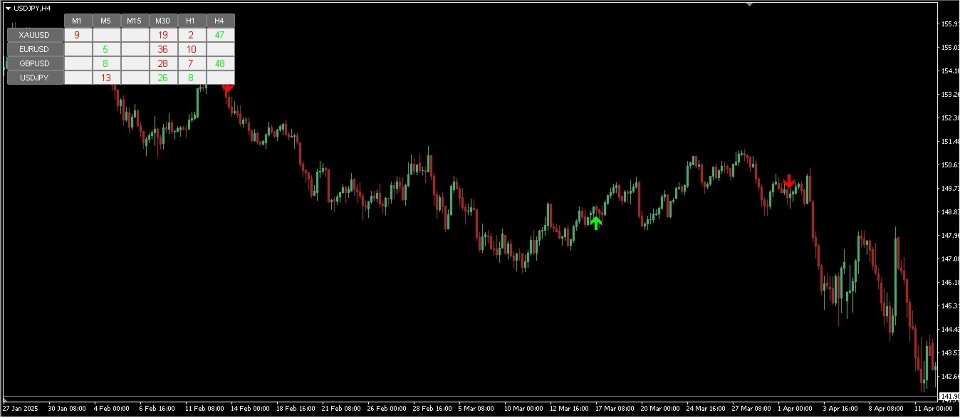
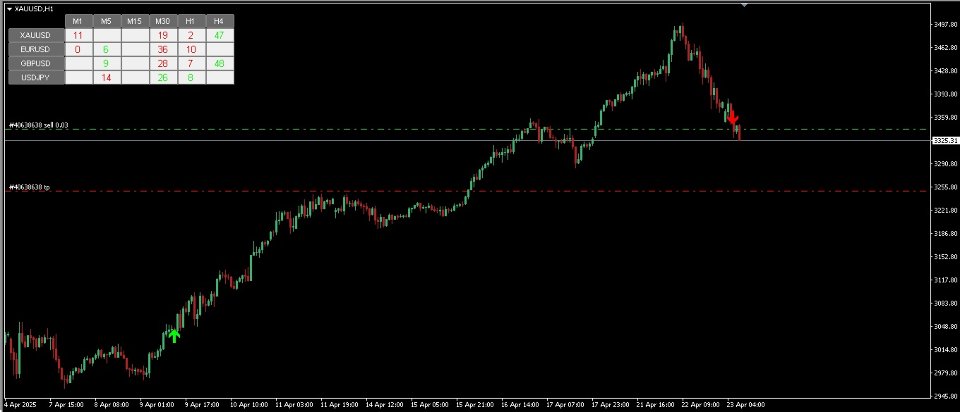
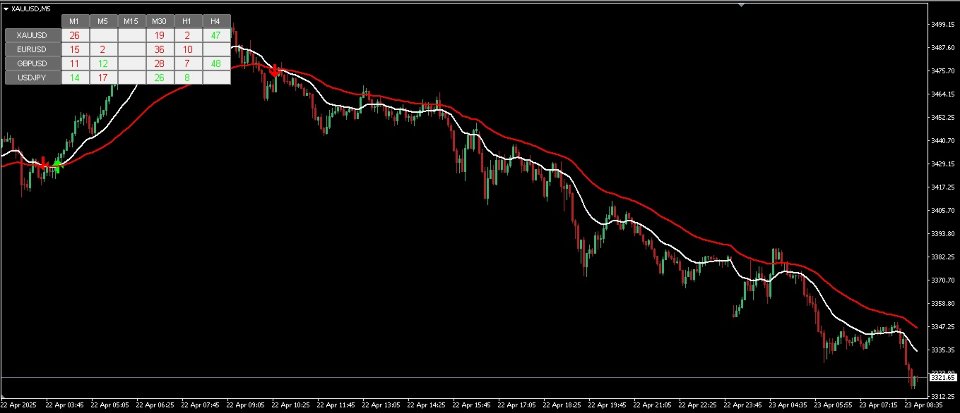
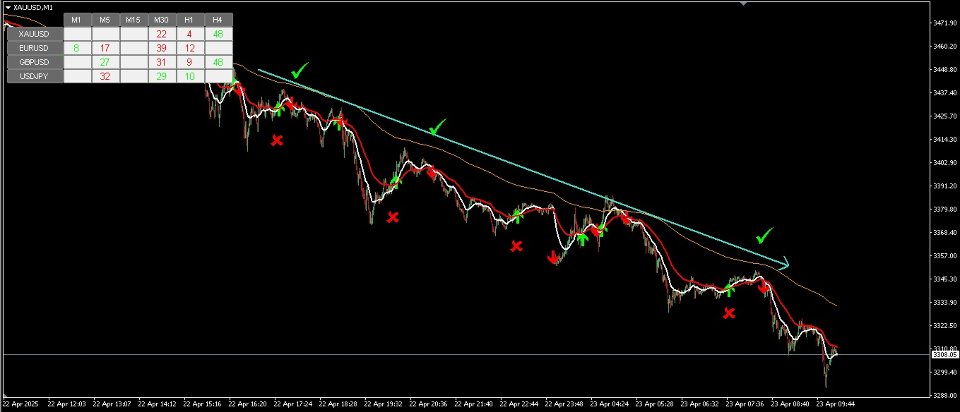
Convenient Dashboard for Moving Average Crossover Trading Strategy. On the panel, numbers display how many candles ago a signal occurred. The number 0 means the signal is on the current candle (it may disappear if the crossover does not hold). The number 1 means the signal was on the previous candle (arrows remain, as moving averages have confirmed the crossover). Moving averages can optionally be added, but the indicator works without them.
✅ Advantages of the indicator:
🚀 Automatic signals — Arrows appear instantly at crossover points (moving averages can be placed on the chart for visual reference if needed).
👁️ Visual simplicity — Colored markers instead of complex charts.
🌐 Multi-currency monitoring — Track multiple instruments in a single window.
⏰ Time-saving — No manual timeframe switching required.
🛡️ Reliability — Built on standard MT4 algorithms.
🔧 How it works:
Generates signals based on two moving averages (fast and slow). The indicator does not require moving averages to be plotted on the chart, but they can be added for visualization.
Crossovers trigger:
🟢 Green upward arrow — When the fast MA crosses above the slow MA.
🔴 Red downward arrow — When the fast MA crosses below the slow MA.
A separate panel displays real-time signals for all selected:
-
Trading instruments (e.g., XAUUSD, EURUSD).
-
Timeframes (M1, H4, etc.).
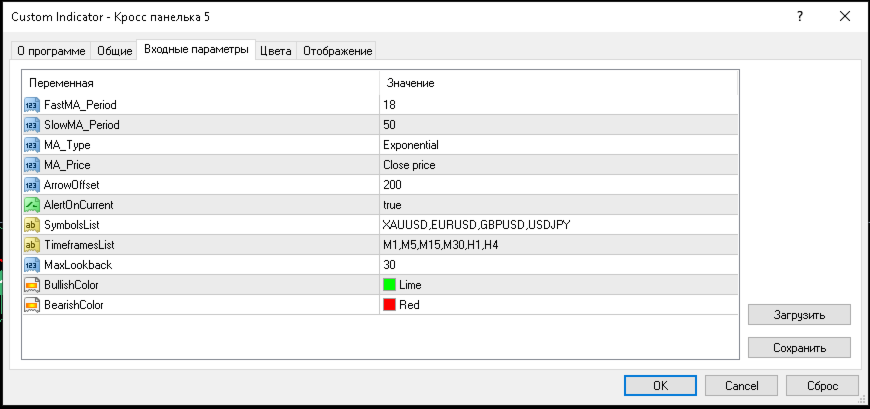
SlowMA_Period = 50; // Slow MA period
MA_Type = MODE_EMA; // MA type: SMA/EMA/SMMA/LWMA
MA_Price = PRICE_CLOSE; // Price source: Close/Open/High/Low
// Visual settings
BullishColor = clrLime; // Bullish signal color
BearishColor = clrRed; // Bearish signal color
ArrowOffset = 200; // Arrow offset from price (in pips)
// Monitoring settings
SymbolsList = "XAUUSD,EURUSD,GBPUSD,USDJPY"; // Instruments
TimeframesList = "M1,M5,M15,M30,H1,H4"; // Timeframes
MaxLookback = 30; // Analysis depth (bars back)
