Classic Renko Indicator
- Indicators
- Denis Kislicyn
- Version: 1.1
- Updated: 23 April 2025
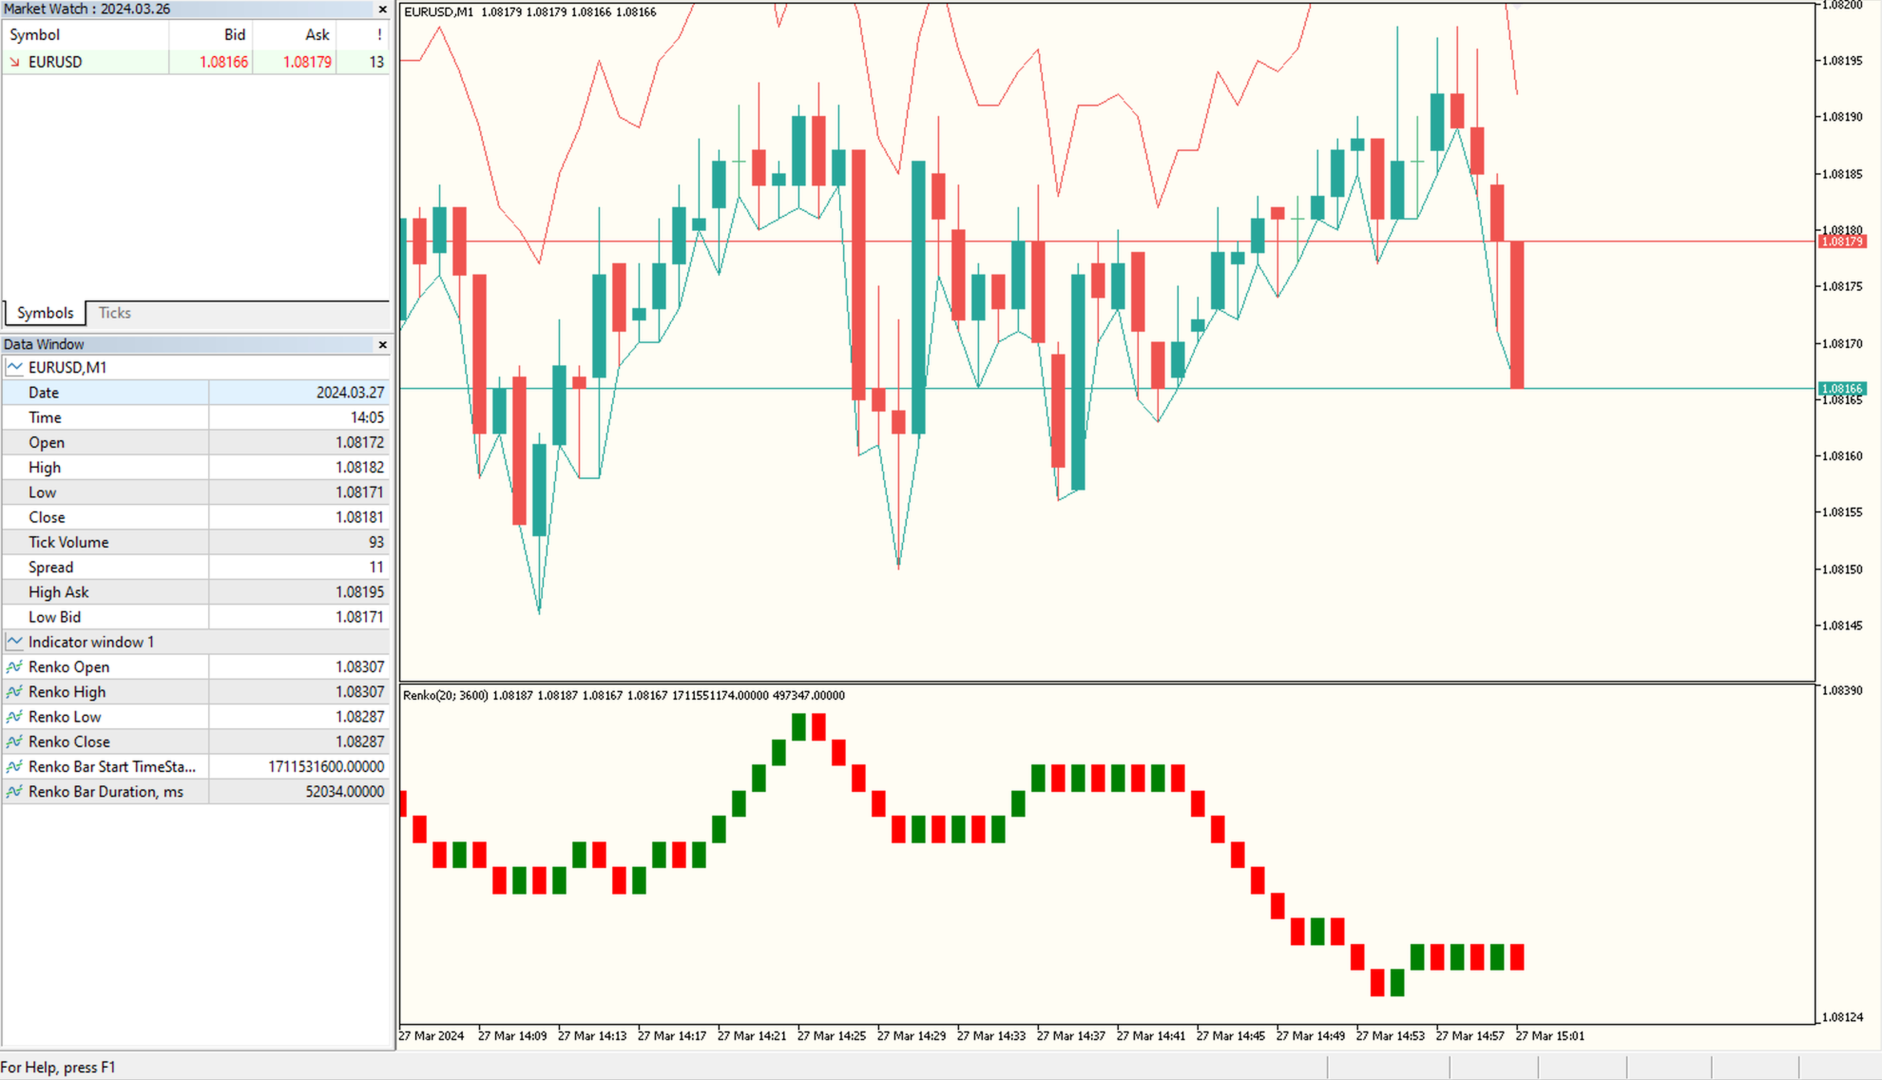
This MT5 indicator provides real-time updates of classic Renko charts. Renko charts focus on price movement, filtering out noise and highlighting trends.
What are Renko candles?
Renko charts display price movement using "bricks" of equal size, ignoring time. A new brick is drawn only when the price moves by a specified amount. They help visualize trends by removing time-based noise.
Parameters
- BrickSizePoints (20): Renko brick size in points
- HistoryDepthSec (3600): Historical data to initialize the chart (in seconds)
- PriceSource (Bid): Price source Ask(0) or Bid(1)
Real-time Calculation
The indicator calculates Renko bricks on every tick. It initializes with `HistoryDepthSec` due to performance limits, so full historical Renko isn't shown.
Time Scale
The Renko chart's X-axis doesn't match the main chart's time scale. Renko charts show price movement, not time. Interpret Renko sequences as price trends. `TimeDurBuffer` shows each bar's duration.
Indicator Buffers
1. Open: Renko brick open price
2. High: Renko brick high price
3. Low: Renko brick low price
4. Close: Renko brick close price
5. Color: Renko brick color (0 for up, 1 for down)
6. Time: Renko brick start time
7. TimeDuration: Renko brick duration (milliseconds)
Trading ideas
Consolidation breakout trading
Look for 2-3 bricks in a narrow range. Enter when 3-4 bricks of the same color appear in sequence. Place stop loss behind the last brick of the opposite color.
"Brick wall" strategy
After 5+ bricks of the same color, wait for 1-2 bricks in the opposite direction. Enter when movement resumes in the trend direction. Place stop loss behind the last retracement brick.
Support/resistance levels
Mark levels where brick direction changed 2-3 times. Use them as entry levels for market positions. Confirm with the formation of a new brick in the desired direction.