SpectralEdge Periodogram - Cycle Analysis Indicator
The SpectralEdge Periodogram is a powerful technical analysis indicator for MetaTrader 5, designed to uncover hidden price cycles in financial markets using Fast Fourier Transform (FFT). By transforming price data into the frequency domain, this indicator reveals the dominant cycles driving market movements, enabling traders to identify repeating patterns and make
informed trading decisions. Whether you're a day trader, swing trader, or long-term investor, SpectralEdge provides a unique perspective on market dynamics, helping you align your strategies with the underlying rhythms of price action.
What is the SpectralEdge Periodogram?
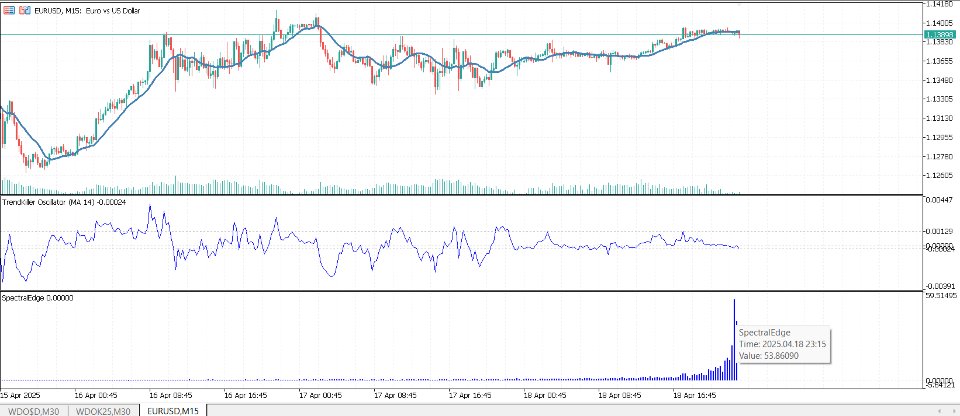
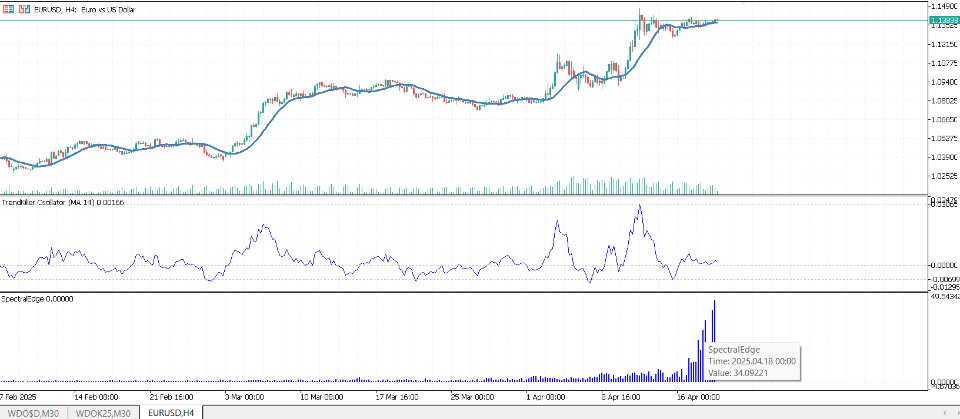
The SpectralEdge Periodogram is an advanced indicator that applies FFT, a mathematical technique, to analyze the historical closing prices of a financial instrument over a user-defined lookback period (default: 256 bars). The indicator calculates the power spectrum of the price data, producing a histogram where:
The X-axis represents frequency indices (from 1 to Lookback/2), which can be converted to cycle periods in bars (Period = Lookback / Index). For example, with a lookback of 256 bars, an index of 10 corresponds to a cycle period of approximately 25.6 bars.
The Y-axis displays the amplitude (strength) of each frequency, with higher peaks indicating more dominant cycles. Amplitudes can be normalized for better visualization, ensuring clarity across different market conditions.
The output is plotted as a histogram in a separate window, making it easy to identify key cycles at a glance.
The indicator also provides detailed cycle analysis through debug output (optional), showing the period, duration (in minutes and hours), and strength of selected cycles, along with trading recommendations for intraday, swing, or trend-following strategies.
FFT-Based Cycle Detection:
Utilizes the robust ALGLIB library to perform Fast Fourier Transform, accurately identifying periodic patterns in price data.
Skips the DC component (index 0) to focus on meaningful oscillatory cycles.
Lookback Period: Adjust the number of bars analyzed (2 to 4096) to balance sensitivity and computational efficiency.
Amplitude Normalization: Toggle normalization to scale amplitudes for consistent visualization across different instruments and timeframes.
Debug Mode: Enable detailed cycle analysis output, displayed in both the Experts log and on the chart via comments.
Visual Customization: Choose the histogram color and width to match your chart preferences.
Plots a clear histogram of cycle amplitudes, with peaks highlighting dominant cycles.
Provides a tutorial via #property description, explaining how to interpret the X-axis (frequency index), Y-axis (amplitude), and practical trading applications.
Debug output (when enabled) includes cycle periods in bars, minutes, and hours, along with guidance on using short periods (10-30 bars) for intraday trading and long periods (100+ bars) for trend analysis.
Performance Optimization:
Recalculates only when new bars are added, minimizing computational overhead.
Efficient buffer management ensures smooth operation, even with large lookback periods.
Optional debug logging reduces resource usage when disabled.
Validates input parameters and data availability to prevent errors.
Displays user-friendly error messages on the chart for issues like insufficient bars or memory allocation failures.
Ensures compatibility with all standard and custom timeframes.
Importance of SpectralEdge Periodogram
The SpectralEdge Periodogram is a game-changer for traders seeking to understand and exploit market cycles. Here’s why it’s an essential tool for your trading arsenal:
Unveils Hidden Market Cycles:
Markets often exhibit cyclical behavior driven by economic events, trader psychology, or institutional activity. SpectralEdge reveals these cycles, which are invisible to traditional indicators like moving averages or RSI.
By identifying the dominant cycle periods, traders can anticipate reversals, breakouts, or trend continuations, gaining a predictive edge.
Versatile Trading Applications:
Intraday Trading: Short cycles (10-30 bars) are ideal for scalping or day trading, helping traders time entries and exits with precision.
Swing Trading: Medium-term cycles (30-100 bars) align with multi-day or multi-week price swings, perfect for capturing larger market moves.
Trend Analysis: Long cycles (100+ bars) highlight major trends, enabling position traders and investors to stay aligned with the market’s primary direction.
The indicator’s debug output provides actionable insights, suggesting which cycles are best suited for specific strategies.
Enhanced Decision-Making:
The histogram’s visual representation makes it easy to spot strong cycles (high peaks), reducing guesswork in strategy development.
Cycle periods are converted into real-world timeframes (minutes and hours), allowing traders to align their trades with their preferred holding periods.
Normalization ensures that amplitude peaks are meaningful, even in volatile or low-volatility markets.
Complements Other Analysis Tools:
SpectralEdge works seamlessly alongside other technical indicators, such as support/resistance levels, trendlines, or oscillators, to confirm trade setups.
For example, a dominant cycle identified by SpectralEdge can be used to time entries in the direction of a trend confirmed by a moving average crossover.
Adapts to Any Market or Timeframe:
Whether trading Forex, stocks, commodities, or cryptocurrencies, SpectralEdge adapts to any instrument by analyzing its unique price dynamics.
Supports all MetaTrader 5 timeframes (M1 to MN1) and custom timeframes, ensuring flexibility for traders of all styles.
Boosts Trading Confidence:
By grounding your trading decisions in mathematically derived cycle analysis, SpectralEdge reduces reliance on subjective interpretations.
The indicator’s robust design, error handling, and clear documentation instill confidence in its reliability, even under demanding market conditions.
How to Use SpectralEdge Periodogram
Add the indicator to your MetaTrader 5 chart via the Navigator or by dragging it onto the desired chart.
Configure the input parameters (Lookback, Normalize, Debug Mode, Color, Width) to suit your trading style.
Interpreting the Histogram:
Observe the histogram in the separate window. Higher peaks indicate stronger cycles.
Convert frequency indices to periods: Period (bars) = Lookback / Index. For example, with Lookback=256, Index 10 = 25.6 bars.
Use the Y-axis amplitude to gauge cycle strength. Normalized amplitudes (if enabled) range from 0 to 1 for easier comparison.
Enable Debug Mode to view detailed cycle analysis in the Experts log and on the chart (via Comment).
Note the periods and strengths for indices 1, 2, 10, and the highest amplitude cycle, along with their trading applications (trend, swing, intraday).
Use the time conversions (minutes, hours) to align cycles with your trading horizon.
Intraday: Focus on short cycles (e.g., 10-30 bars) to time scalping or day trades. Enter when price aligns with cycle peaks/troughs and confirm with other indicators.
Swing Trading: Target medium cycles (e.g., 30-100 bars) for multi-day trades. Use cycle periods to set profit targets or stop-loss levels.
Trend Following: Use long cycles (e.g., 100+ bars) to identify the primary market trend. Enter trades in the direction of the trend during cycle upswings.
Combine with other tools (e.g., Fibonacci retracements, MACD) for higher-probability setups.
Adjust the Lookback period to capture shorter or longer cycles. Smaller values (e.g., 64) are more sensitive to recent price action, while larger values (e.g., 1024) reveal longer-term trends.
Test different timeframes to find the best fit for your trading style and instrument.
Cutting-Edge Technology: Harnesses FFT to provide insights unavailable in standard indicators, giving you a competitive advantage.
Ease of Use: Intuitive histogram and detailed debug output make cycle analysis accessible to traders of all experience levels.
Customizability: Tailor the indicator to your preferences with adjustable lookback, normalization, and visual settings.
Reliability: Built with robust error handling, performance optimization, and compliance with MetaTrader 5 Market standards.
Educational Value: Includes a built-in tutorial and guidance to help you understand and apply cycle analysis effectively.
Platform: MetaTrader 5
Timeframes: All (M1 to MN1, including custom timeframes)
Instruments: Forex, stocks, commodities, indices, cryptocurrencies
Dependencies: None (uses standard ALGLIB library included in MetaTrader 5)
Documentation: Comprehensive tutorial included in the indicator’s properties and debug output.
Updates: Regular updates to enhance functionality and ensure compatibility with future MetaTrader 5 versions.
The SpectralEdge Periodogram is more than just an indicator—it’s a window into the cyclical nature of financial markets. By revealing the hidden rhythms of price action, it empowers traders to make smarter, data-driven decisions across all trading styles and market conditions. Whether you’re scalping on M5, swing trading on H4, or investing on D1, SpectralEdge provides the clarity and precision you need to succeed. Add this innovative tool to your MetaTrader 5 platform today and start trading with the power of cycle analysis!


