VIX index
- Indicators
- Carlos Andrés Moya Erazo
- Version: 1.0
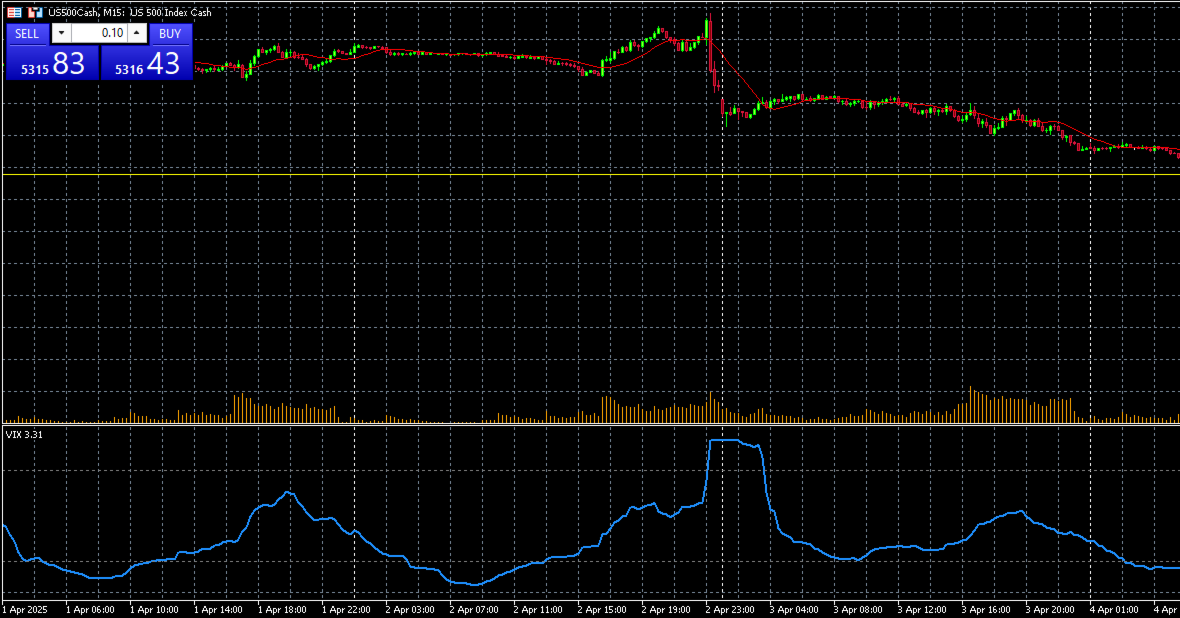
The VIX Index, or CBOE Volatility Index, is an indicator designed for MetaTrader 5 that transforms historical volatility into an easy-to-interpret oscillator, placing the volatility range between 0 (minimum) and 100 (maximum) based on a configurable normalization period.
Unlike a simple ATR, this oscillator shows you on the chart when volatility is abnormally low or high compared to its recent behavior. Additionally, the indicator provides context and information about the famous VIX Volatility Index, known as the “fear gauge” in financial markets.
What is the VIX Index?
The VIX (Chicago Board Options Exchange Volatility Index) measures the 30-day implied volatility of S&P 500 options, reflecting investors’ expectations of the magnitude of market movements.
It was launched in January 1993 as a real-time calculation based on at-the-money S&P 100 (OEX) option prices, and was later adapted to the S&P 500. Each day, the VIX is calculated from standard and weekly option quotes, using a filtering algorithm to discard unrepresentative data.
In 2016, its publication was extended to cover hours outside the regular Wall Street schedule, enhancing its global usefulness.
How is the VIX calculated?
The VIX calculation weighs the premiums of call and put options on the S&P 500 with different expirations, interpolating the implied volatility of two option series to obtain the 30-day volatility expectation.
It considers the ratio between out-of-the-money puts and calls, thus measuring the relative demand for protection versus speculation.
Level Interpretation
-
Low VIX (<20): Indicates market complacency, tight trading ranges, and low uncertainty.
-
Medium VIX (20–30): Neutral or moderate level, typical volatility.
-
High VIX (>30): Indicates fear or panic in the market, wide movements, and potential contrarian opportunities.
Introducing the Vix Index Indicator
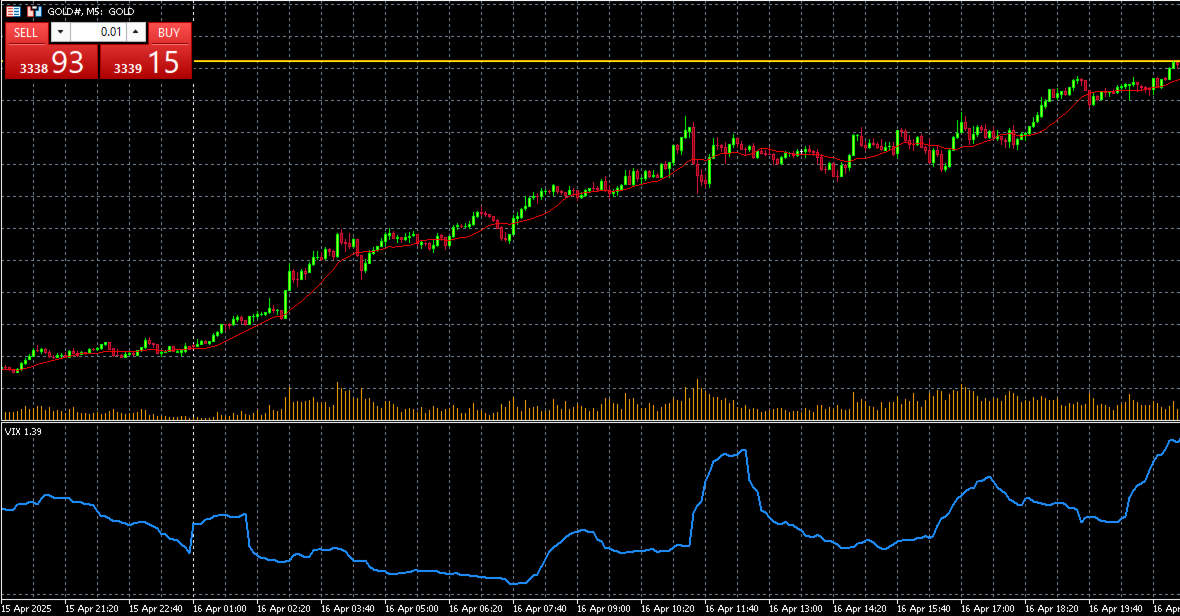
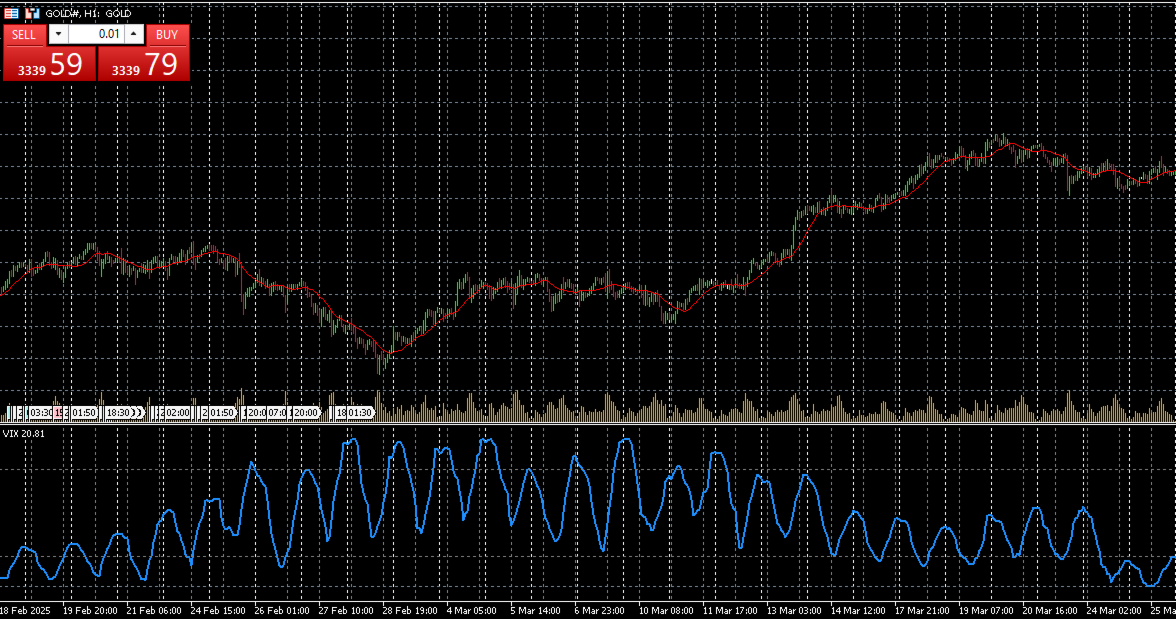
Vix Index is a visual tool that combines your new volatility oscillator (normalized ATR) with a friendly, contextual description of the VIX.
-
Displays the normalized ATR value in a vivid color, highlighting low-volatility periods (below 20) and high-volatility periods (above 80).
-
Includes an on-screen information panel with reference levels and a brief explanation of what the VIX represents and why it matters.
-
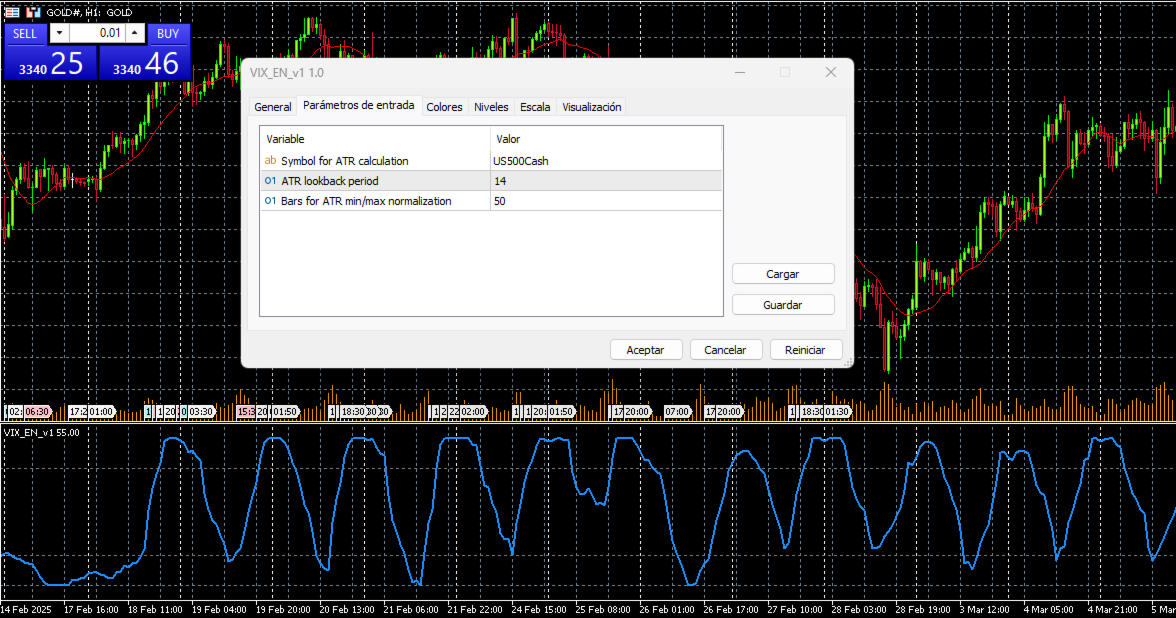
Allows you to adjust the ATR symbol and calculation periods without modifying the code.
Why Use Vix Index?
-
Visual Clarity: An oscillating line with clear colors and levels instantly shows how current volatility compares to recent history.
-
Sentiment Context: Knowing the real VIX adds perspective on global risk perception, complementing your technical analysis.
-
Informed Decisions: Use it to identify excessively calm markets (potential consolidation) or extremely volatile conditions (risk or opportunity).
How to use?
The VIX index normally works with the symbol of the S&P500 index (although it can be used with any index or symbol that adapts to each strategy) for it to work correctly you must change the “Symbol for calculation” parameter with the name of the S&P500 index in your broker, this usually varies according to the database used. It can be easily found by searching in the MetaTrader symbols window, to improve the search type 500 in the search engine.Support & Contact
If you have questions, suggestions, or need technical assistance:
-
Email: support@camoya802.com
-
MQL5 Profile: https://www.mql5.com/en/users/camoya802
-
Forum: Post in Camoyae’s support thread on MQL5.com
Download Vix Index and take your volatility analysis to the next level!