Power Trend Indicator MT4
- Indicators
- Eda Kaya
- Version: 1.3
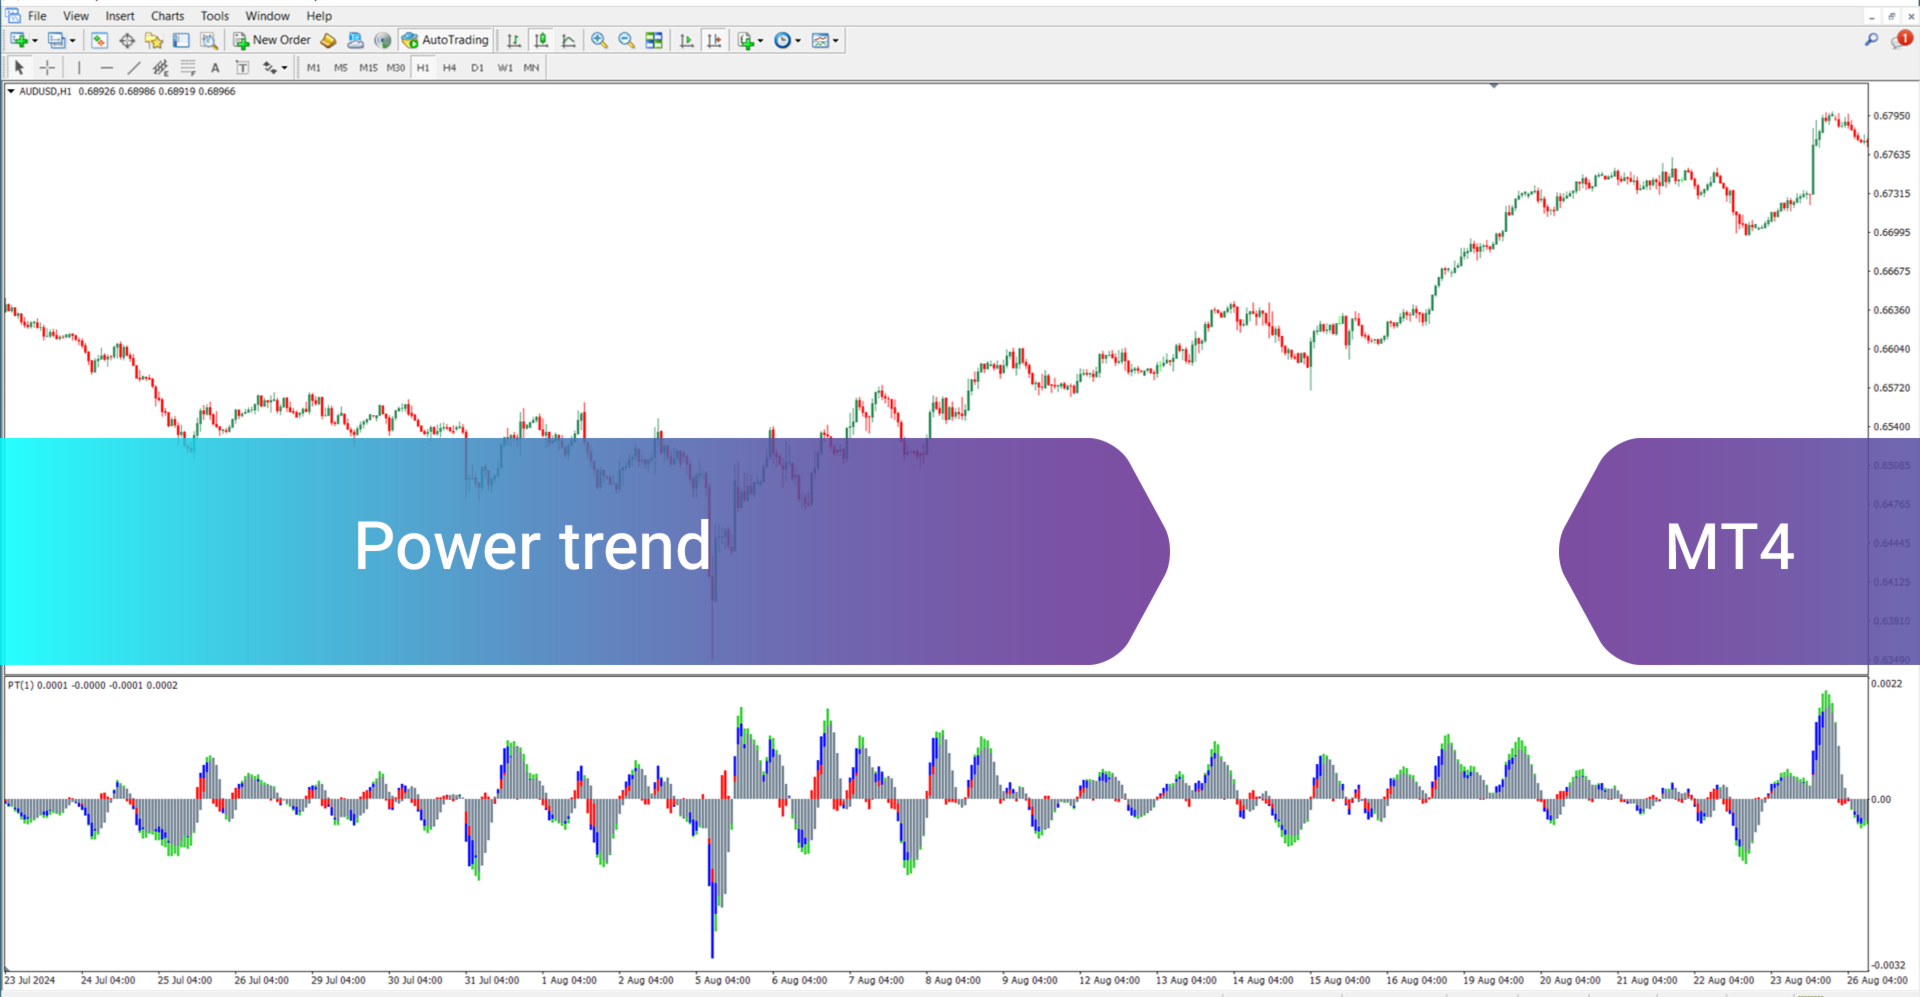
Power Trend Indicator for MetaTrader 4
The Power Trend Indicator for MetaTrader 4 is designed to assess both the momentum and direction of price movements. This MT4 indicator presents the trend strength using a four-color-coded system, allowing traders to spot weak momentum phases and anticipate potential trend initiations.
Its visual feedback is valuable for recognizing shifts in market sentiment and detecting trend transitions. Red signals indicate reversals, blue suggests mild trends, while green represents strong momentum.
«Indicator Installation & User Guide»
MT4 Indicator Installation | Power Trend Indicator MT5 | ALL Products By TradingFinderLab | Best MT4 Indicator: Refined Order Block Indicator for MT4 | Best MT4 Utility: Trade Assistant Expert TF MT4 | TP & SL Tool: Risk Reward Ratio Calculator RRR MT4 | Money Management: Easy Trade Manager MT4
Power Trend Indicator Table
| Category | Oscillator – Signal & Forecast |
| Platform | MetaTrader 4 |
| Skill Level | Intermediate |
| Indicator Type | Continuation – Reversal |
| Time Frame | Multi Time Frame |
| Trading Style | Short-Term to Mid-Term |
| Markets | Suitable for All Instruments |
Indicator Overview
When the histogram bars appear above the zero line (positive zone), it signals a bullish phase. Conversely, bars forming below the zero line (negative zone) indicate bearish momentum. The indicator marks trend shifts with red, highlights weaker trends in blue, and shows solid trends in green. Black bars point to range-bound or indecisive phases.
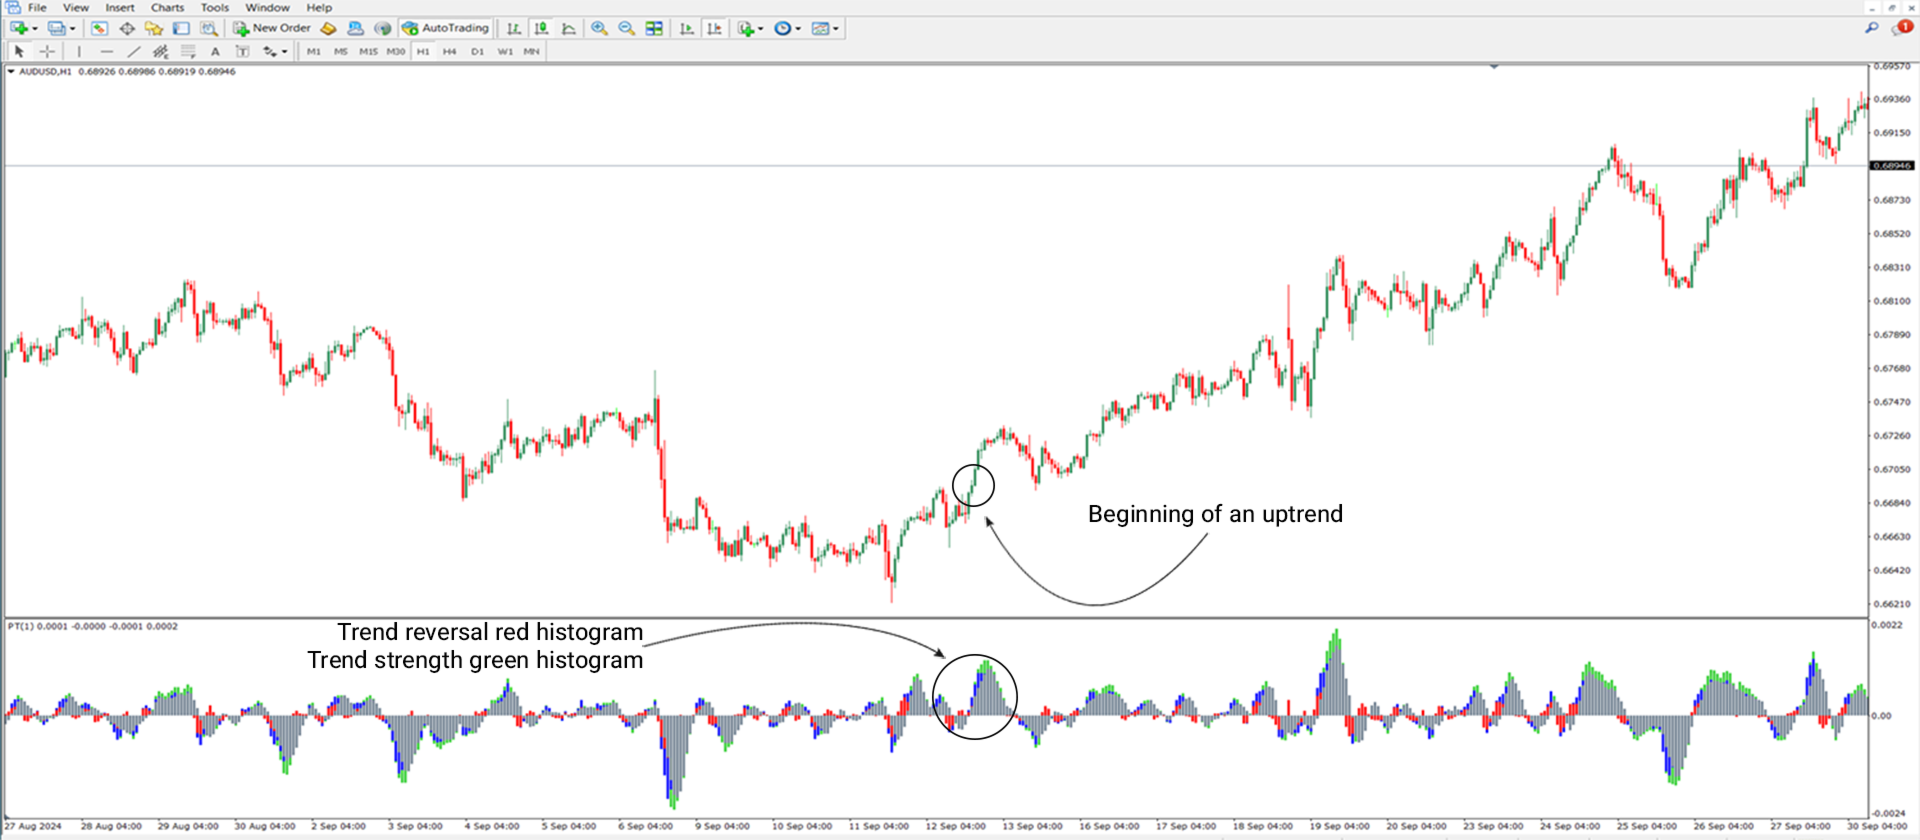
Bullish Trend Signal
The following chart displays the AUD/USD pair on the H1 timeframe. The Power Trend Indicator’s histogram rises above the zero line, with a red bar showing the initial transition from bearish to bullish bias. A blue bar highlights the early stage of the uptrend, and green bars confirm the presence of a strong bullish phase—signaling a potential long opportunity.
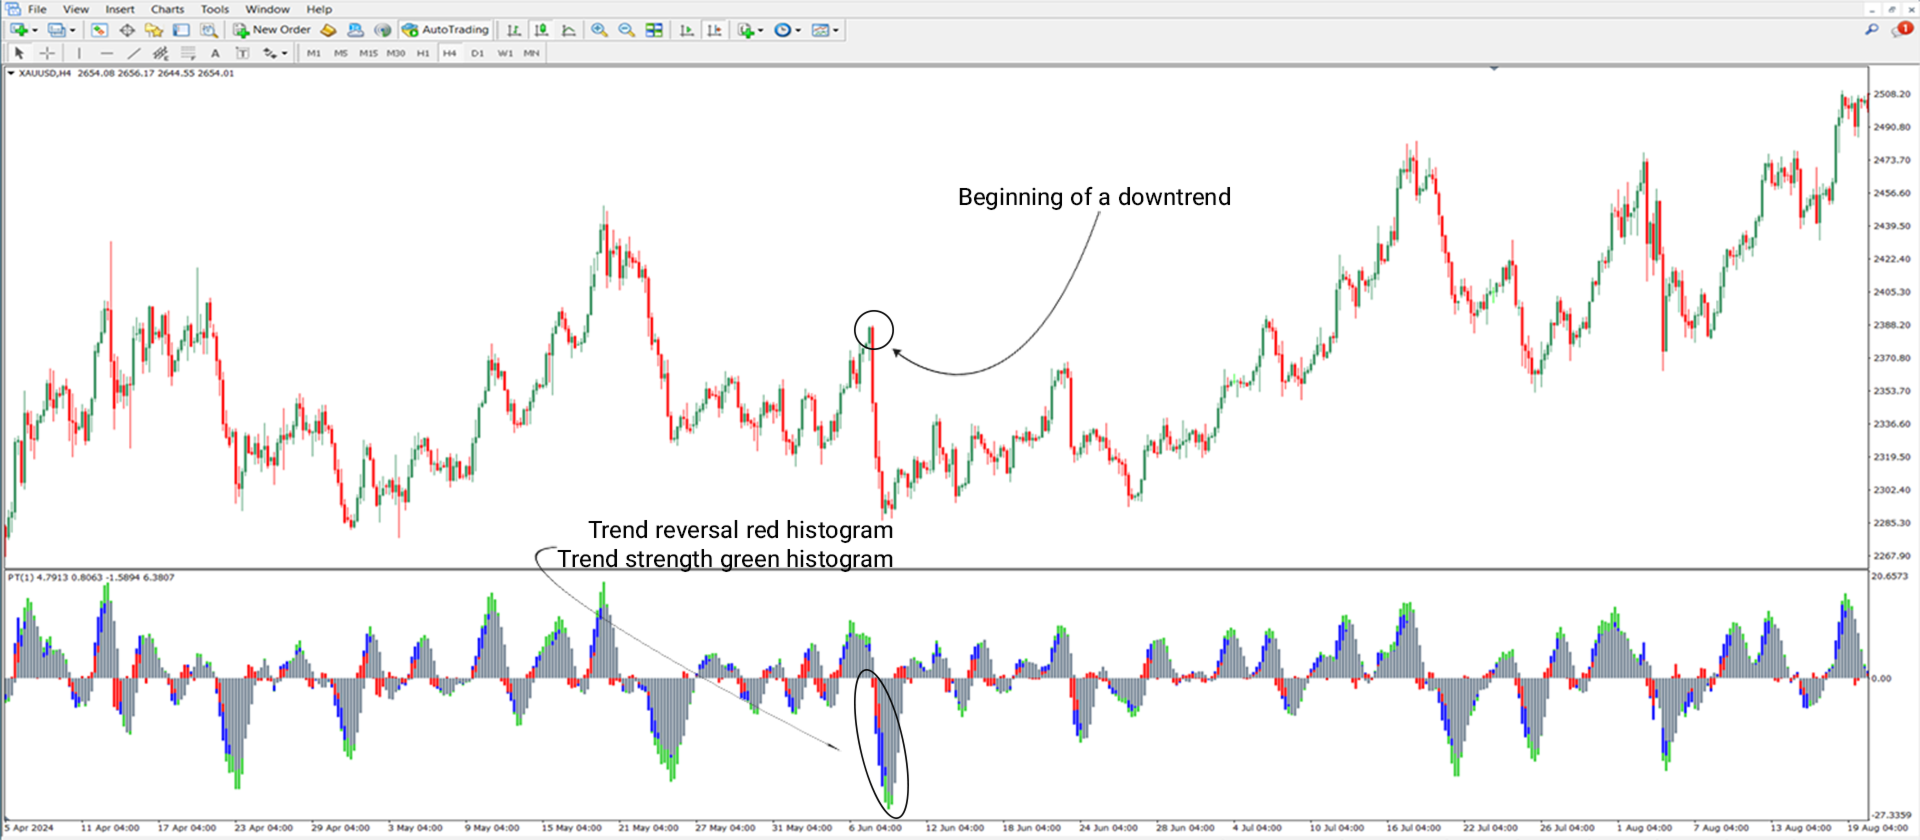
Bearish Trend Signal
In this example, the XAU/USD 4-hour chart is analyzed. The histogram crosses below the zero line, beginning with a red bar, indicating a trend reversal from bullish to bearish. A blue bar signals a soft downtrend initiation, followed by green bars that reflect intensifying bearish momentum—confirming a short setup.
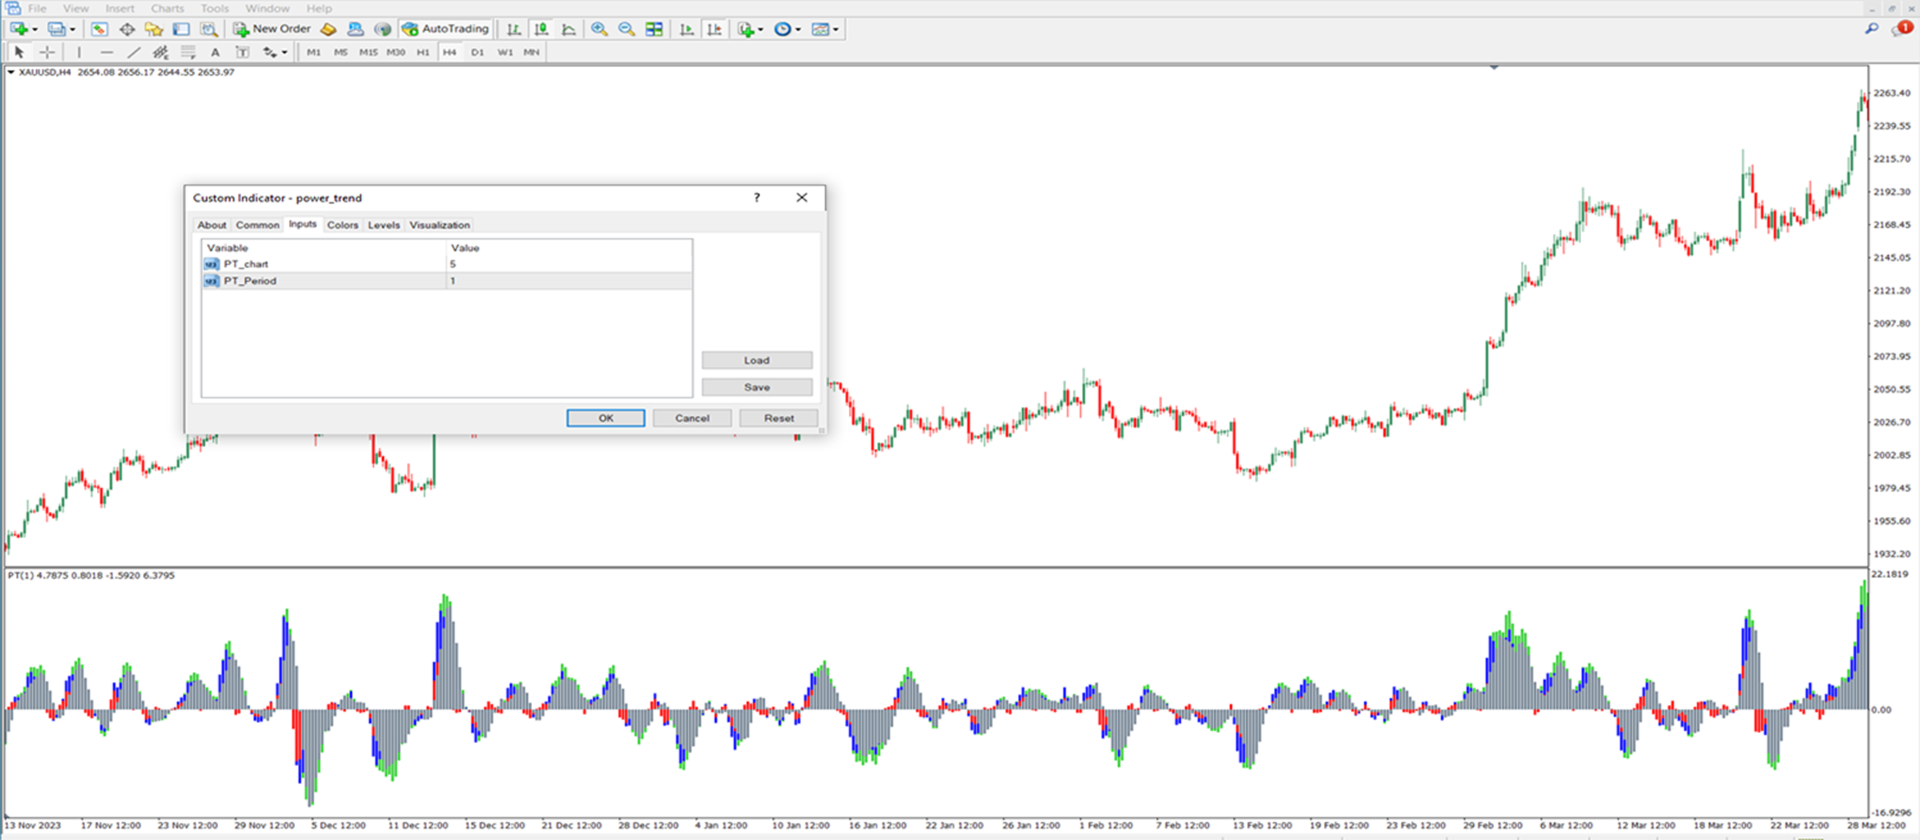
Power Trend Indicator Settings
• PT_chart: Histogram candle grouping configured to 5
• PT_period: Analysis period set to 1
Summary
The Power Trend Indicator is a powerful analytical resource for traders seeking to interpret trend dynamics in the market. Ideal for trend-based strategies, it offers critical insights into trend strength and direction. For enhanced results, it’s recommended to integrate this indicator with other tools or technical setups to validate market conditions and signals.