Liquidity Finder MT5
- Indicators
- Eda Kaya
- Version: 1.5
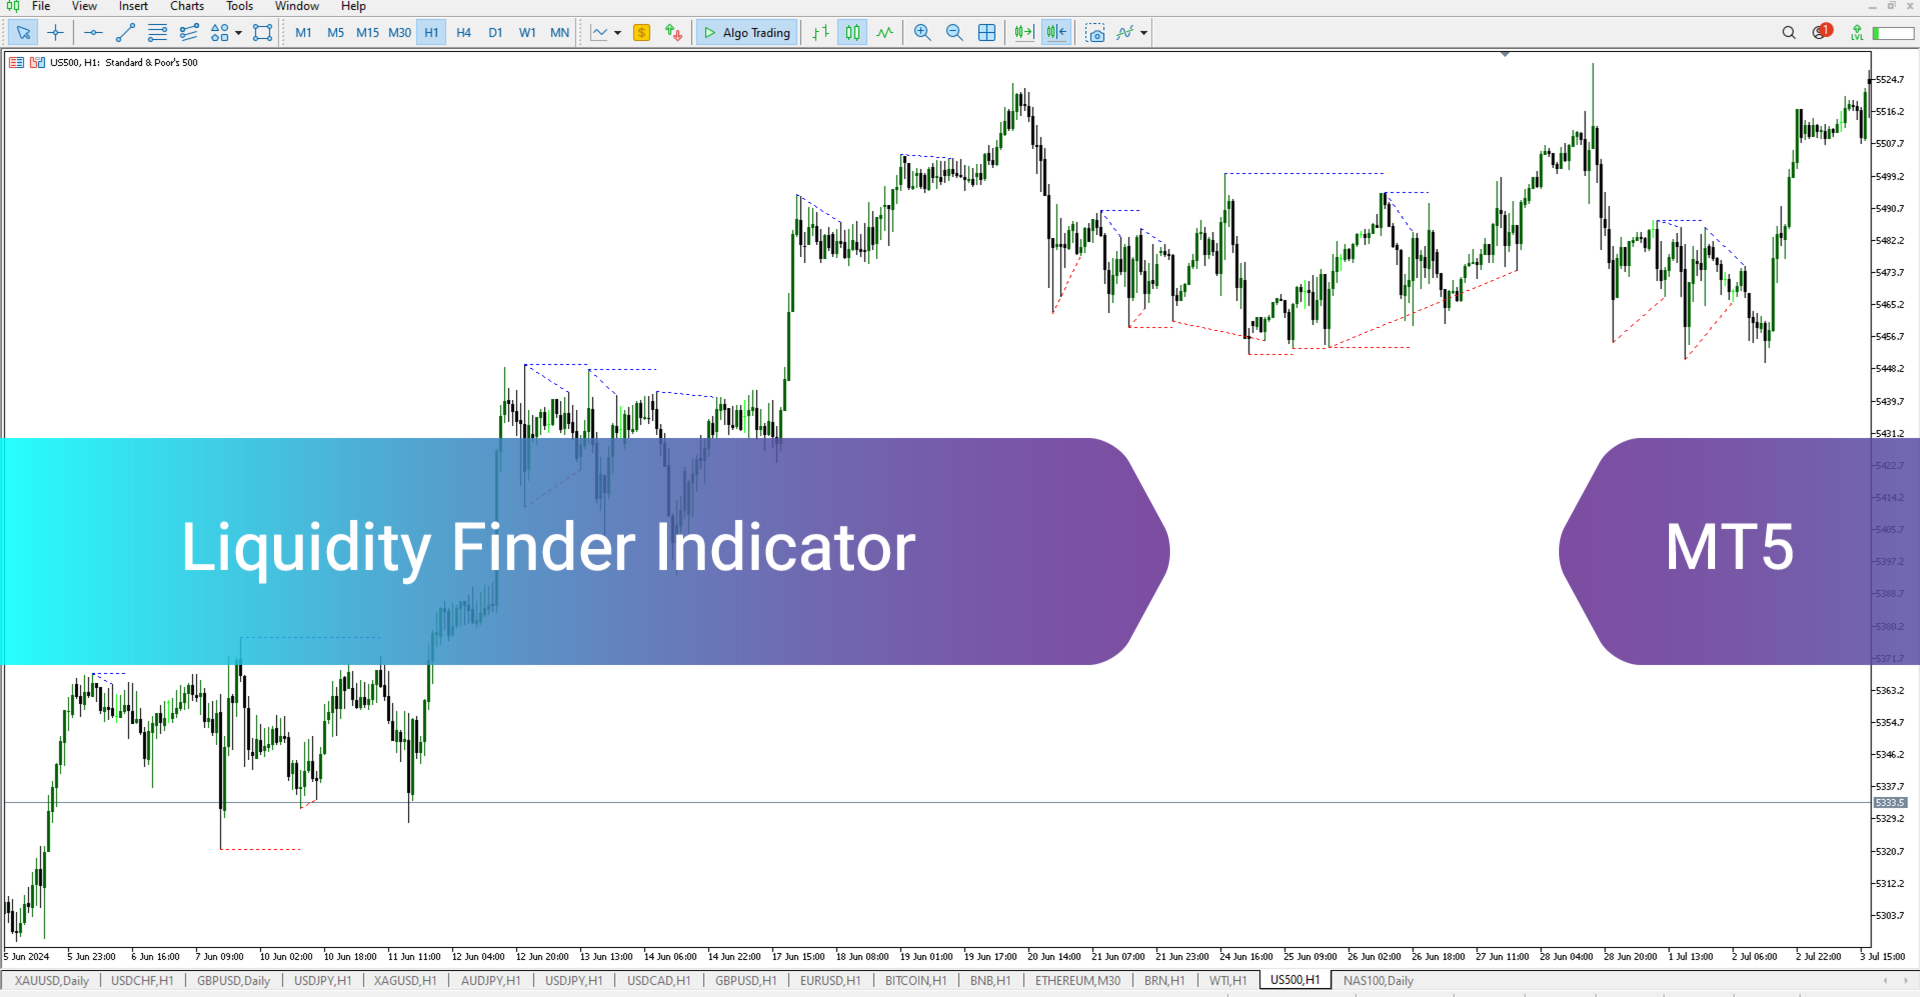
Liquidity Finder Indicator MT5
The Liquidity Finder Indicator MT5 is a specialized tool developed for the MetaTrader 5 platform, created to detect zones of market liquidity. This indicator functions by plotting both fixed and dynamic liquidity levels on the price chart. Blue-colored lines indicate zones of liquidity near recent highs, while red lines mark zones near significant lows. Static lines often align with common chart structures such as Double Bottoms and Double Tops, giving visual clarity to traders.
«Indicator Installation & User Guide»
MT5 Indicator Installation | Liquidity Finder MT4 | ALL Products By TradingFinderLab | Best MT5 Indicator: Refined Order Block Indicator for MT5 | Best MT5 Utility: Trade Assistant Expert TF MT5 | TP & SL Tool: Risk Reward Ratio Calculator RRR MT5 | Money Management: Easy Trade Manager MT5
Indicator Table (LF)
| Indicator Categories | ICT - Smart Money - Levels |
| Platforms | MetaTrader 5 |
| Trading Skills | Intermediate - Advanced - Pro |
| Indicator Types | Momentum - Breakout - Predictive |
| TimeFrame | M1 - M5 - M15 - M30 - H1 - H4 |
| Trading Style | Scalping - Day Trading - Intraday |
| Trading Instruments | Forex - Cryptocurrencies - Equities |
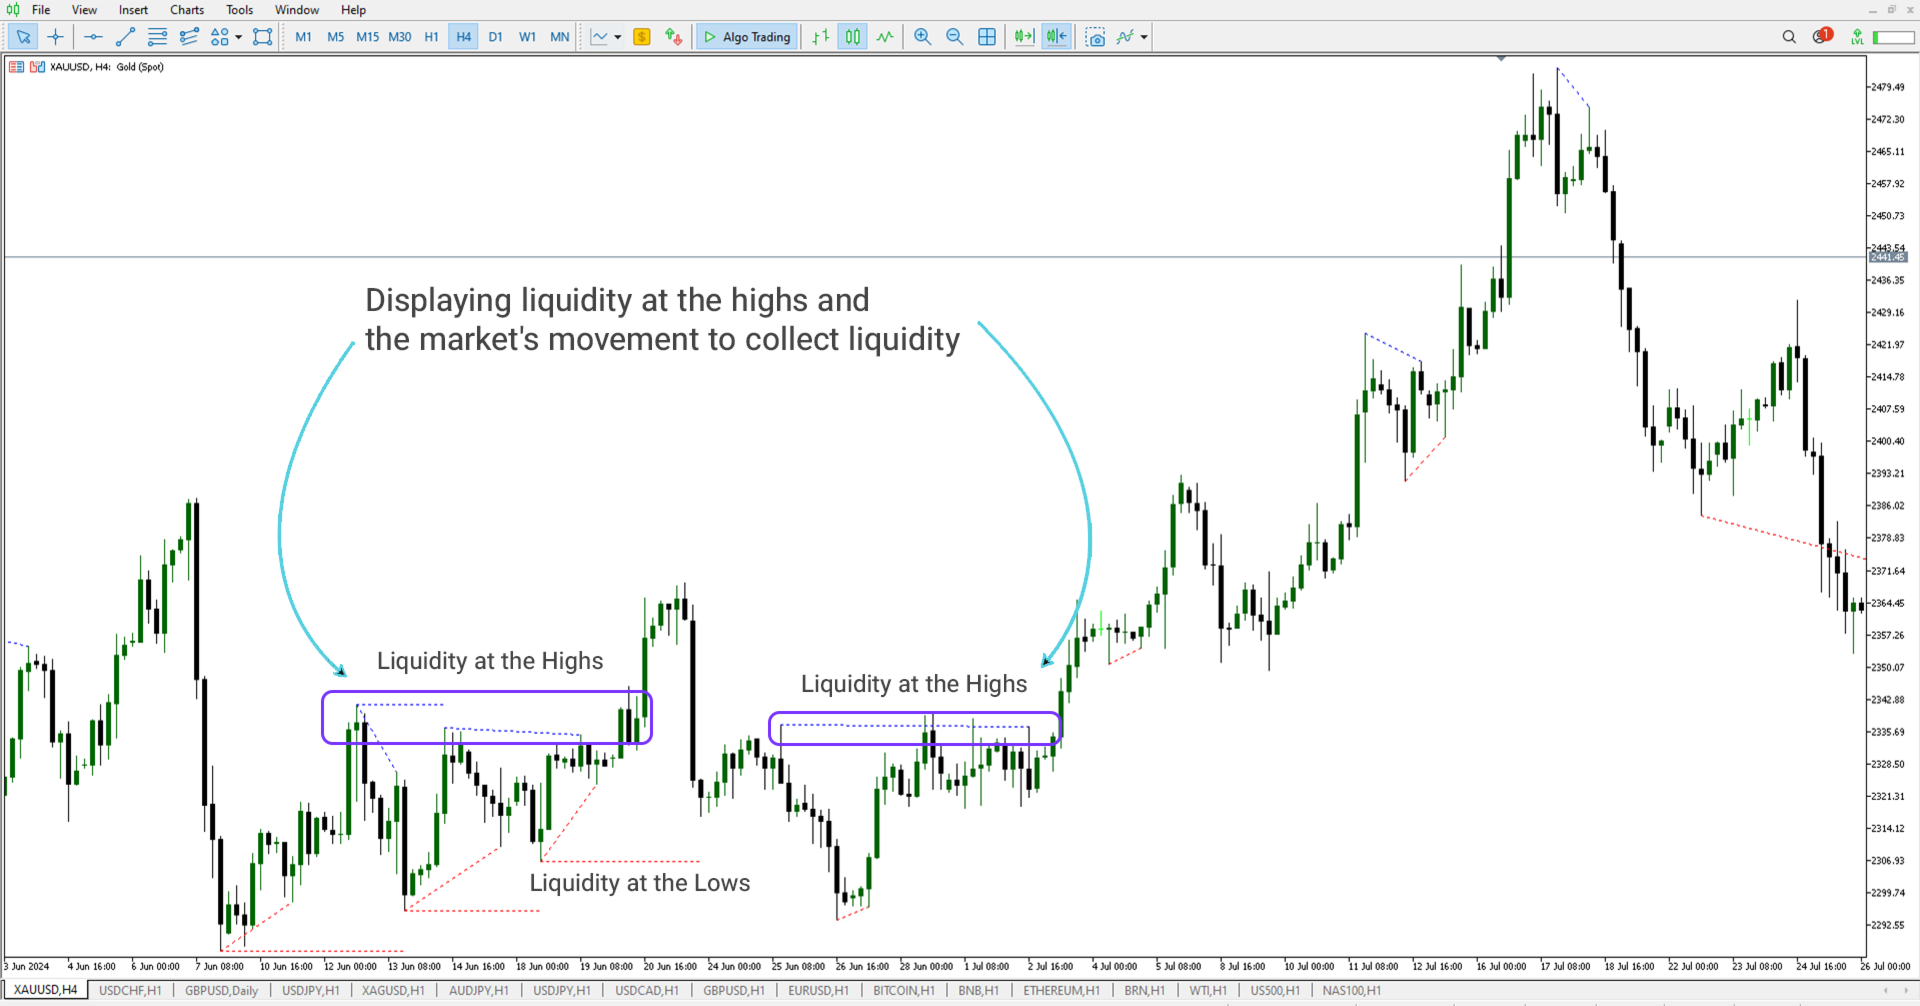
Liquidity Concentration Near High Levels
On the XAU/USD 4-hour chart, the Liquidity Finder Indicator MT5 marks liquidity accumulation near previous peaks. A prominent double-top formation appears around the 2306.93 level, and following a retracement and liquidity sweep at lower levels, price rallies beyond the 2335.69 zone, initiating a bullish continuation. This type of setup helps traders anticipate breakout zones.
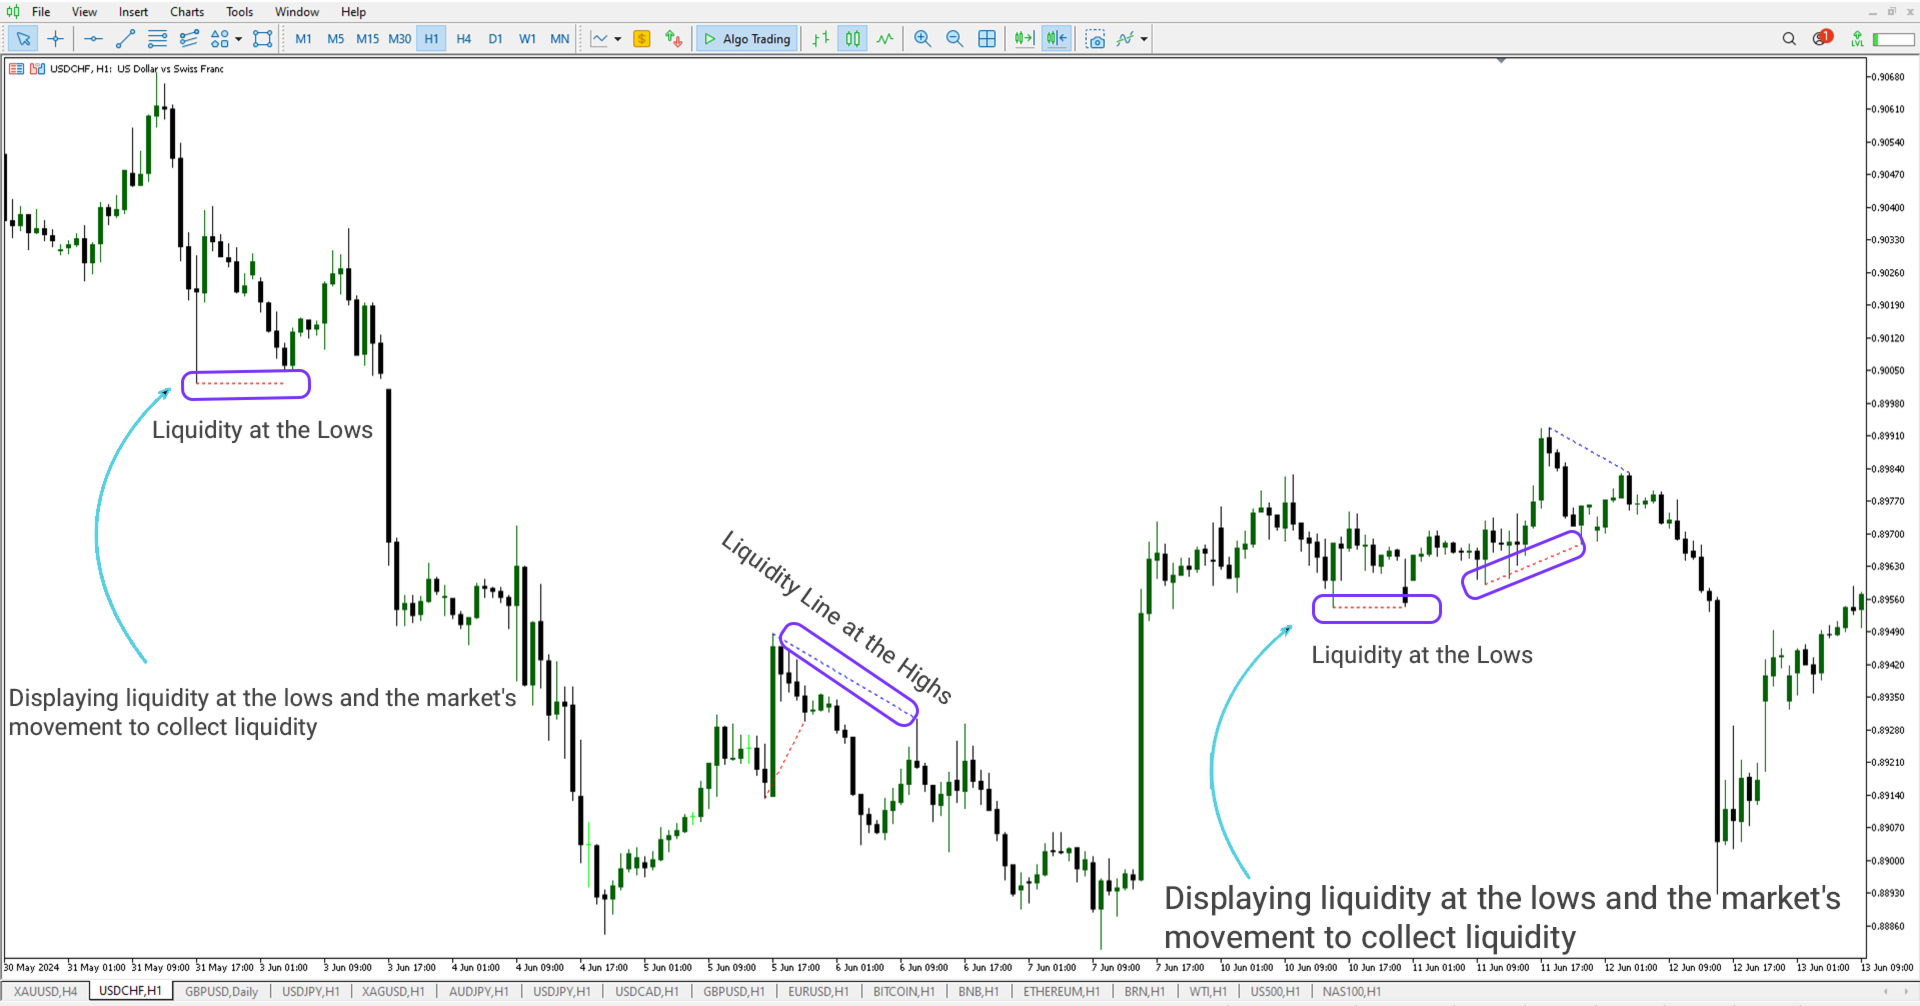
Liquidity Accumulation Near Low Levels
On the USD/CHF 1-hour timeframe, the Liquidity Finder Indicator MT5 identifies low liquidity pools using red dynamic lines. These zones typically represent sell-side liquidity. The market often revisits these areas to trigger pending orders before moving in the opposite direction. Traders can use this insight to fine-tune their trade entries and exits.
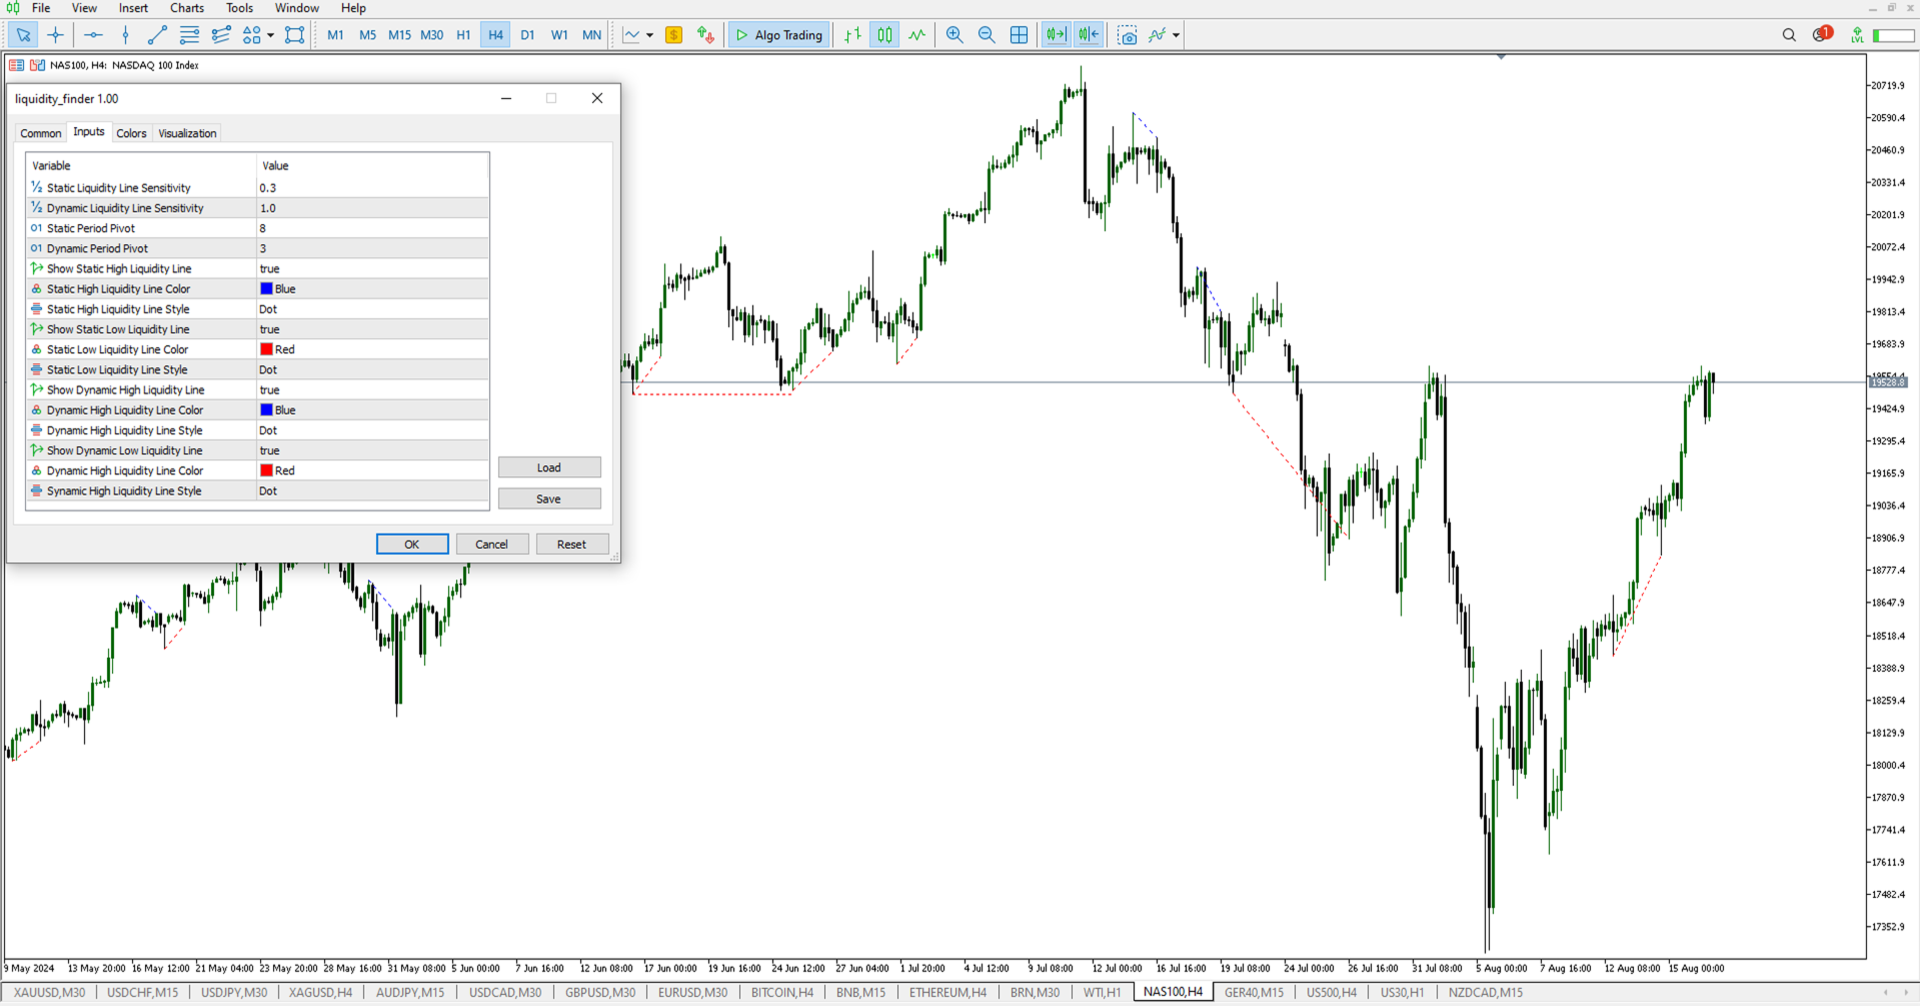
Indicator Settings
- Static Liquidity Line Sensitivity – Adjusts how static liquidity zones are detected
- Dynamic Liquidity Line Sensitivity – Controls sensitivity for dynamic lines
- Static Pivot Period – Sets the period for detecting static pivot levels
- Dynamic Pivot Period – Sets the timeframe window for dynamic pivots
- Display Static High Liquidity Line – Toggle for static high liquidity markers
- Color for Static High Line – Custom color selection for high static lines
- Style for Static High Line – Choose from different line styles for clarity
- Display Static Low Liquidity Line – Toggle for static low liquidity zones
- Color for Static Low Line – Customize static low zone color
- Style for Static Low Line – Choose visual representation style
- Display Dynamic High Liquidity Line – Enables high dynamic line visualization
- Color for Dynamic High Line – Adjusts color for dynamic highs
- Style for Dynamic High Line – Modify styling for dynamic high levels
- Display Dynamic Low Liquidity Line – Activates dynamic low-level indicators
- Color for Dynamic Low Line – Set the visual color for low dynamic liquidity
- Style for Dynamic Low Line – Adjust line type for readability
Summary
The Liquidity Finder Indicator MT5 is a reliable tool designed to detect key market liquidity levels. By visualizing zones where market orders cluster, it gives traders a distinct advantage in timing entries and exits. Whether trading Forex, crypto, or stocks, this indicator supports liquidity-based analysis and helps optimize decision-making through precise data representation.