• Overview
  • Reviews
  • Comments (2)

RSI abcd

RSI ABCD Pattern Finder: Technical Strategy

1. How the Indicator Works

Combines the classic RSI with automatic detection of ABCD harmonic patterns.

Key Components

  • Standard RSI (adjustable period)
  • Peak and Trough Markers (arrows)
  • ABCD Patterns (green/red lines)
  • Overbought (70) and Oversold (30) Filters

2. MT5 Setup

period = 14; // RSI period size = 4; // Maximum pattern size OverBought = 70; // Overbought level OverSold = 30; // Oversold level Filter = USE_FILTER_YES; // Confirmation filter

3. Trading Strategy

3.1. Buy Entry (Bullish ABCD)

Conditions:

  1. RSI forms:
    • Trough (A) → Peak (B) → Higher trough (C)
    • D above Oversold (30) but below C
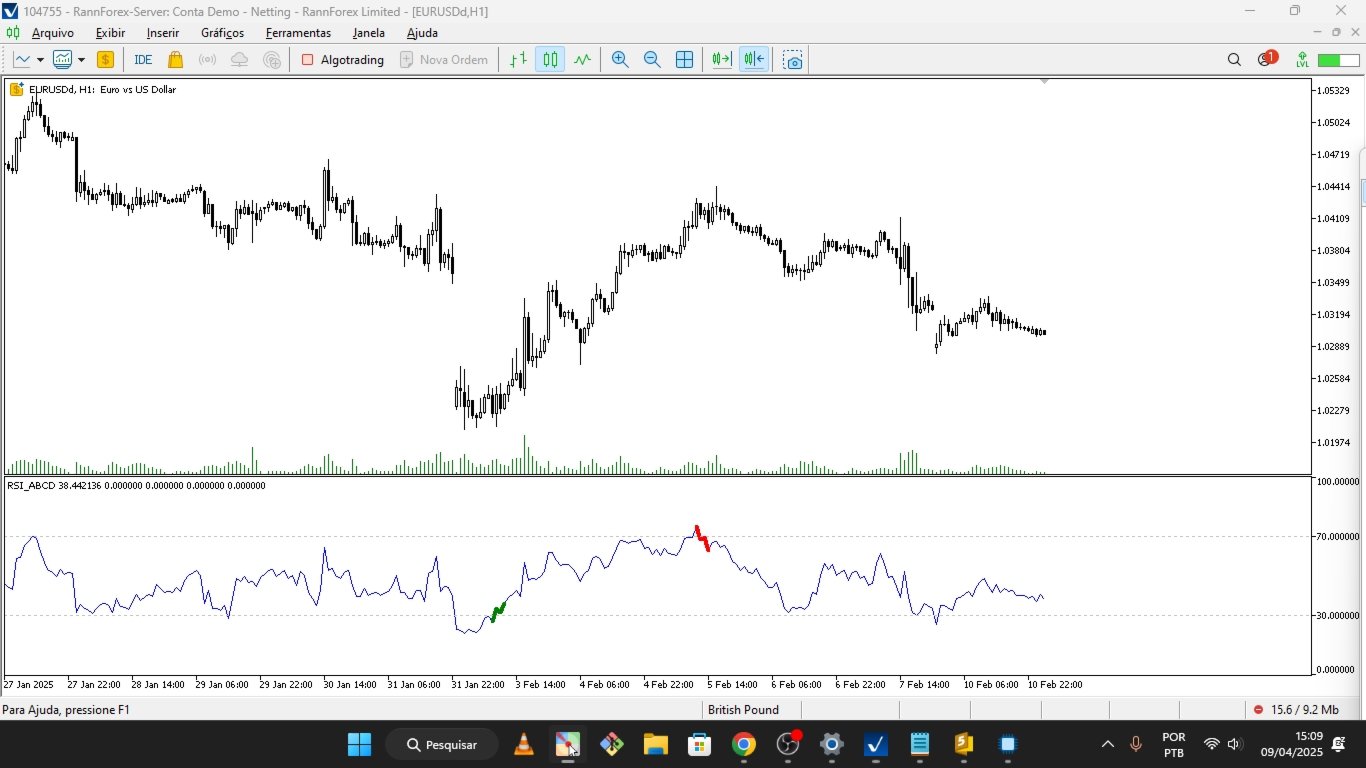
  2. Confirmation: Green line connecting A-B-C-D

Targets:

  • TP1: 61.8% of B-C
  • TP2: 100% of B-C

Stop Loss: Below D

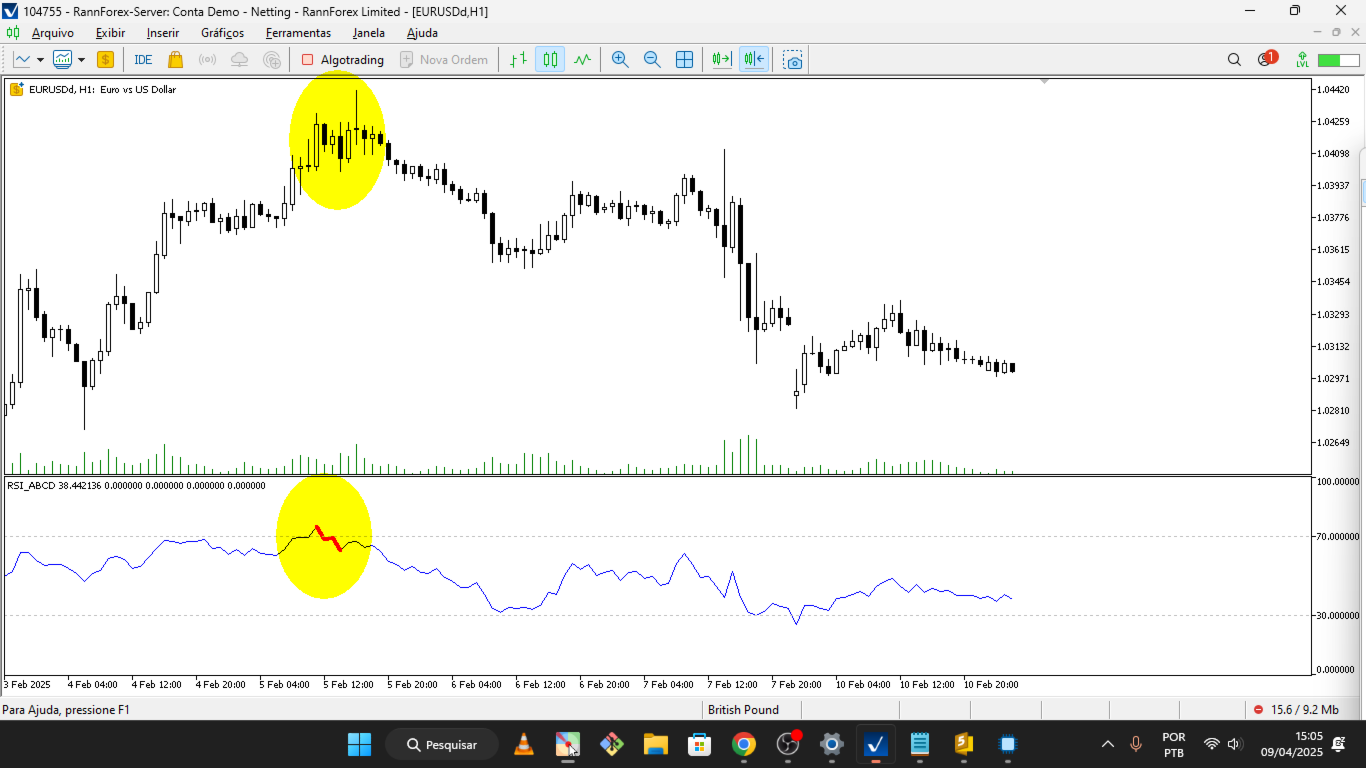
3.2. Sell Entry (Bearish ABCD)

Conditions:

  1. RSI forms:
    • Peak (A) → Trough (B) → Lower peak (C)
    • D below Overbought (70) but above C
  2. Confirmation: Red line connecting A-B-C-D

Targets:

  • TP1: 61.8% of B-C
  • TP2: 100% of B-C

Stop Loss: Above D

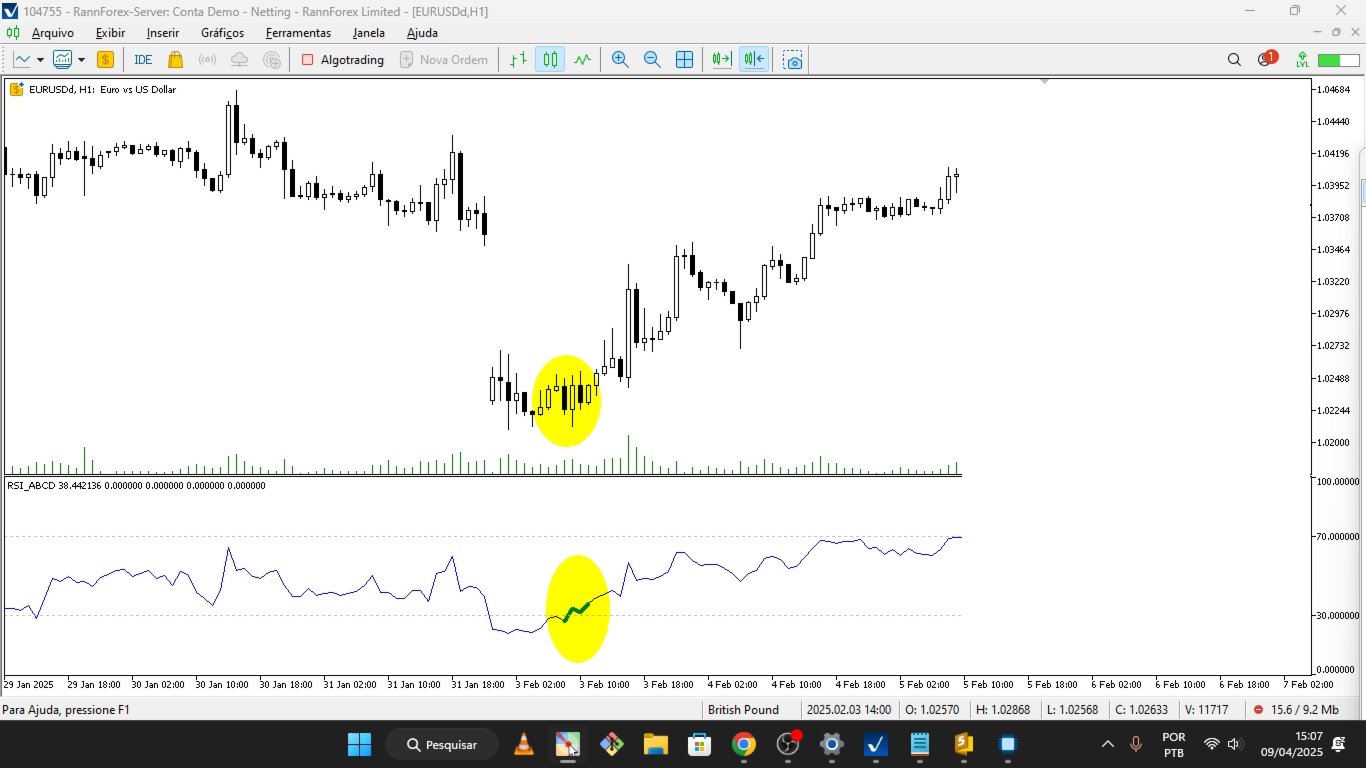
4. Practical Example (EUR/USD H1)

  1. Bullish ABCD Pattern detected after RSI exits Oversold.
  2. Confirmation with green line.
  3. Entry at D, SL below the last trough.
  4. TP1 reached at 61.8%.

5. Risk Management

  • Risk per trade: 1-2% of capital.
  • Avoid major news events.
  • Use trailing stop after TP1.

6. Conclusion

Effective indicator for traders combining RSI and harmonic patterns. Test on a demo account before live trading.

Next Steps:

  • Adjust parameters per asset.
  • Combine with moving average for confirmation.
Recommended products
Free automatic Fibonacci is an indicator that automatically plots a Fibonacci retracement based on the number of bars you select on the BarsToScan setting in the indicator. The Fibonacci is automatically updated in real time as new highest and lowest values appears amongst the selected bars. You can select which level values to be displayed in the indicator settings. You can also select the color of the levels thus enabling the trader to be able to attach the indicator several times with differe
FREE
Follow The Line MT5
Oliver Gideon Amofa Appiah
4.52 (29)
This indicator obeys the popular maxim that: "THE TREND IS YOUR FRIEND" It paints a GREEN line for BUY and also paints a RED line for SELL. (you can change the colors). It gives alarms and alerts of all kinds. IT DOES NOT REPAINT and can be used for all currency pairs and timeframes. Yes, as easy and simple as that. Even a newbie can use it to make great and reliable trades. NB: For best results, get my other premium indicators for more powerful and reliable signals. Get them here: https://www.m
FREE
Cybertrade Keltner Channels
Emanuel Andriato
4.75 (4)
Cybertrade Keltner Channels - MT5 Created by Chester Keltner, this is a volatility indicator used by technical analysis. It is possible to follow the trend of financial asset prices and generate support and resistance patterns. In addition, envelopes are a way of tracking volatility in order to identify opportunities to buy and sell these assets. It works on periods longer than the period visible on the chart. All values ​​are available in the form of buffers to simplify possible automations.
FREE
Important Lines
Terence Gronowski
4.86 (21)
This indicator displays Pivot-Lines, preday high and low, preday close and the minimum and maximum of the previous hour. You just have to put this single indicator to the chart to have all these important lines, no need to setup many single indicators. Why certain lines are important Preday high and low : These are watched by traders who trade in a daily chart. Very often, if price climbs over or falls under a preday low/high there is an acceleration in buying/selling. It is a breakout out of a
FREE
LT Donchian Channel
Thiago Duarte
4.83 (6)
Donchian Channel is an indicator created by Richard Donchian. It is formed by taking the highest high and the lowest low of the last specified period in candles. The area between high and low is the channel for the chosen period. Its configuration is simple. It is possible to have the average between the upper and lower lines, plus you have alerts when price hits one side. If you have any questions or find any bugs, please contact me. Enjoy!
FREE
Coral Indi
Dinh Duong Luong
Coral trend is   a trend-following indicator that is widely popular among FOREX traders . It is usually used as a confluence with other indicators. It uses combinations of moving averages with complex smoothing formulas! It has two configurable parameters: Coefficient   - smoothing ratio (*) Applied price Calculation: Coral = (-0.064) * B6 + 0.672 * B5 - 2.352 * B4 + 2.744 * B3
FREE
Bounce Zone MT5
Nguyen Thanh Cong
4.43 (7)
Introduction The Bounce Zone indicator is a cutting-edge non-repainting technical tool built to identify key areas on the price chart where market sentiment is likely to cause a significant price reversal. Using advanced algorithms and historical price data analysis, this indicator pinpoints potential bounce zones. Combined with other entry signal, this indicator can help forex traders place the best trades possible Signal A possible buy signal is generated when price is in the green zone an
FREE
Santa Donchian
Marco Aurelio Cestari
4.5 (2)
Santa Donchian Indicator  is an efficient way to detect support, resistence and break outs in any market. The Donchian channel measures the high and the low of a previously defined range.  Typically, a trader would look for a well-defined range and then wait for the price to break out to either one side for a trade entry trigger. Advantages Never repaints, never backpaints, never recalculates. Works in all symbols and all timeframes. Perfect trend filter for any strategy or expert advisor. Full
FREE
Necessary for traders: tools and indicators Waves automatically calculate indicators, channel trend trading Perfect trend-wave automatic calculation channel calculation , MT4 Perfect trend-wave automatic calculation channel calculation , MT5 Local Trading copying Easy And Fast Copy , MT4 Easy And Fast Copy , MT5 Local Trading copying For DEMO Easy And Fast Copy , MT4 DEMO Easy And Fast Copy , MT5 DEMO The homeopathic indicator is also called the CCI indicator. The CCI indicator was proposed
FREE
Pivot Point Fibo RSJ is an indicator that traces the support and resistance lines of the day using Fibonacci rates. This spectacular indicator creates up to 7 levels of support and resistance through Pivot Point using Fibonacci rates. It is fantastic how the prices respect each level of this support and resistance, where it is possible to perceive possible entry/exit points of an operation. Features Up to 7 levels of support and 7 levels of resistance Set the colors of the levels individually
FREE
The Trend Catcher: The Trend Catcher Strategy with Alert Indicator is a versatile technical analysis tool that aids traders in identifying market trends and potential entry and exit points. It features a dynamic Trend Catcher Strategy , adapting to market conditions for a clear visual representation of trend direction. Traders can customize parameters to align with their preferences and risk tolerance. The indicator assists in trend identification, signals potential reversals, serves as a trail
FREE
Enhance your trading analysis with the Haiken Ashi MT5 indicator. This powerful tool transforms standard price data into smoother, trend-following candlesticks, making it easier to identify market trends and potential reversal points.    Key Features: Clear Trend Identification: Visually distinguish between uptrends and downtrends with distinct candle colors. Reduced Noise: Filter out price fluctuations, providing a clearer view of underlying market movements. Early Trend Detection: Anticipate
FREE
Donchian Pro
Paulo Henrique Faquineli Garcia
5 (3)
The Donchian Channel Channels are among the most popular tools of technical analysis, as they visually convey to the analyst the limits within which most price movement tends to occur. Channel users know that valuable information can be obtained at any time, whether prices are in the central region of a band or close to one of the border lines. One of the best known techniques to explore these concepts is Bollinger Bands. However, John Bollinger was not the only one to research the application
FREE
The indicator highlights the points that a professional trader sees in ordinary indicators. VisualVol visually displays different volatility indicators on a single scale and a common align. Highlights the excess of volume indicators in color. At the same time, Tick and Real Volume, Actual range, ATR, candle size and return (open-close difference) can be displayed. Thanks to VisualVol, you will see the market periods and the right time for different trading operations. This version is intended f
FREE
The indicator   "Haven Key Levels PDH PDL"   helps traders visualize key levels on the chart. It automatically marks the following levels: DO (Daily Open)   — the daily open level. NYM (New York Midnight)   — the New York midnight level. PDH (Previous Day High)   — the previous day's high. PDL (Previous Day Low)   — the previous day's low. WO (Weekly Open)   — the weekly open level. MO (Monthly Open)   — the monthly open level. PWH (Previous Week High)   — the previous week's high. PWL (Previou
FREE
Haven FVG Indicator
Maksim Tarutin
5 (1)
The   Haven FVG   indicator is a market analysis tool that highlights inefficiency areas (Fair Value Gaps, FVG) on the chart, providing traders with key levels for price analysis and decision-making. Other products ->  HERE Main Features: Customizable color settings: Color for Bullish FVG   (Bullish FVG Color). Color for Bearish FVG   (Bearish FVG Color). Flexible FVG visualization: Maximum number of candles for FVG detection. Additional extension of FVG zones by a specified number of bars. Opt
FREE
Bollinger Bands B
Flavio Javier Jarabeck
4.5 (2)
John Bollinger created this indicator in 2010 as a way to read the original indicator (Bollinger Bands) in a more "technical" way, shown as an oscillator. The typical range of the Bollinger Bands %B is 0 - 0.5 - 1.0, where "0" represents the lower band, the "0.5" the middle band, and "1" the upper band. The line on the indicator represents the Closing prices. As simple as that. SETTINGS Bollinger Bands period of analysis Standard Deviation multiplier Shift Price type to be analyzed If you like
FREE
Pivot MT5
Dmitrij Isaenko
The indicator draws daily support and resistance lines on the chart, as well as the Pivot level (reversal level). Adapted to work in MT5 The standard timeframe for calculating support and resistance levels is D1. You can choose other timeframes according to your strategy (for example, for M1-M15, the optimal timeframe for calculations is H1) The function for calculating support and resistance levels has been updated; in this calculation option, fibonacci levels are taken into account, respec
FREE
Are you tired of drawing trendlines every time you're analyzing charts? Or perhaps you would like more consistency in your technical analysis. Then this is for you. This indicator will draw trend lines automatically when dropped on a chart. How it works Works similar to standard deviation channel found on mt4 and mt5. It has 2 parameters: 1. Starting Bar 2. Number of bars for calculation The   starting bar   is the bar which drawing of the trend lines will begin, while the   number of bars for c
FREE
Moving line
Jun Chao Jiang
The one minute chart has a bug, but the one-day chart can still be used after deleting the bug and reloading the indicators, This indicator can be used to determine how far the indicator goes up to place an order to buy, how far it goes down to place an order to sell, and not placing an order until it reaches this distance, which is considered oscillation, open an account gift index
FREE
Reversal Composite Candles
MetaQuotes Ltd.
3.57 (14)
The idea of the system is to indentify the reversal patterns using the calculation of the composite candle. The reversal patterns is similar to the "Hammer" and "Hanging Man" patterns in Japanese candlestick analysis. But it uses the composite candle instead the single candle and doesn't need the small body of the composite candle to confirm the reversal. Input parameters: Range - maximal number of bars, used in the calculation of the composite candle. Minimum - minimal size of the composite can
FREE
Multi-timeframe trend indicator based on the ADX / ADXWilder indicator with Fibonacci levels The indicator shows trend areas using ADX or ADXWilder indicator data from multiple timeframes. The impulse mode of the indicator allows you to catch the beginning of a trend, and several "Screens" with different timeframes allow you to filter out market noise. Fibonacci levels are added to the price chart, which have flexible settings. How the indicator works: if PDI is greater than NDI, then   it`s
FREE
High Low Open Close
Alexandre Borela
4.98 (43)
If you like this project, leave a 5 star review. This indicator draws the open, high, low and closing prices for the specified period and it can be adjusted for a specific timezone. These are important levels looked by many institutional and professional traders and can be useful for you to know the places where they might be more active. The available periods are: Previous Day. Previous Week. Previous Month. Previous Quarter. Previous year. Or: Current Day. Current Week. Current Month. Current
FREE
The indicator shows   round levels   on the chart. They are also called   psychological , banking, or levels of major players. At these levels, there is a real fight between bulls and bears, the accumulation of many orders, which leads to increased volatility. The indicator   automatically   adjusts to any instrument and timeframe. When the   level 80   is broken through and then tested, we   buy. When   level 20   is broken through and then tested, we   sell. The target is 00. Attention. Due to
FREE
Indicator and Expert Adviser  EA Available in the comments section of this product. Download with Indicator must have indicator installed for EA to work. Mt5 indicator alerts for bollinger band and envelope extremes occurring at the same time. Buy signal alerts occur when A bullish candle has formed below both the lower bollinger band and the lower envelope  Bar must open and close below both these indicators. Sell signal occur when A bear bar is formed above the upper bollinger band and upper
FREE
Dual RSI
Paul Conrad Carlson
3 (1)
Indicator alerts for Dual Relative strength index rsi. Large rsi preset at 14 is below 30 small rsi preset at 4 is below 10 for buy bullish signals . Large rsi preset are 14 is above 70 small rsi preset at 4 is above 90 for sell bearish signals . Includes mobile and terminal alerts. draws lines when alerts. This indicator can help identify extremes and then the tops or bottoms of those extremes .
FREE
This indicator is a zero-lag indicator and displays  strength of trend change . True Trend  Oscillator Pro works best in combination with True Trend Moving Average Pro that displays exact trend as is. Oscillator value is exact price change in given direction of the trend. True Trend Moving Average Pro: https://www.mql5.com/en/market/product/103586 If you set PERIOD input parameter to 1 this indicator becomes a sharpshooter for binary options. Developers can use True Trend Oscillator in Exper
FREE
Bar Color Trend
Germano Chagas
4.38 (8)
Combining the best of Price Action , Directional Movement , and Divergence/Convergence analysis, Candle Color Trend is a easy and reliable way to identify trend direction. The indicator automatically paints the candles according to the assumption that an uptrend is defined by prices that form a series of higher highs and higher lows. In contrast, a downtrend is defined by prices that form a series of lower highs and lower lows. Additionally, ADX Wilder indicator is used to measure trend weakness
FREE
Mitimom
Danil Poletavkin
The indicator is based on Robert Miner's methodology described in his book "High probability trading strategies" and displays signals along with momentum of 2 timeframes. A Stochastic oscillator is used as a momentum indicator. The settings speak for themselves period_1 is the current timeframe, 'current' period_2 is indicated - the senior timeframe is 4 or 5 times larger than the current one. For example, if the current one is 5 minutes, then the older one will be 20 minutes The rest of the s
FREE
Best SAR MT5
Ashkan Hazegh Nikrou
4.33 (3)
Description :  we are happy to introduce our new free indicator based on one of professional and popular indicators in forex market (Parabolic SAR) this indicator is new modification on original Parabolic SAR indicator, in pro SAR indicator you can see cross over between dots and price chart, this crossover is not signal but talk about end of movement potential, you can start buy by new blue dot, and place stop loss one atr before first blue dot, and finally you can exit as soon as dots cross p
FREE
Buyers of this product also purchase
Trend Screener Pro MT5
STE S.S.COMPANY
4.85 (80)
Unlock the Power of Trends Trading with the Trend Screener Indicator: Your Ultimate Trend Trading Solution powered by Fuzzy Logic and Multi-Currencies System! Elevate your trading game with the Trend Screener, the revolutionary trend indicator designed to transform your Metatrader into a powerful Trend Analyzer. This comprehensive tool leverages fuzzy logic and integrates over 13 premium features and three trading strategies, offering unmatched precision and versatility. LIMITED TIME OFFER : Tre
Algo Pumping
Ihor Otkydach
5 (8)
PUMPING STATION – Your Personal All-inclusive strategy Introducing PUMPING STATION — a revolutionary Forex indicator that will transform your trading into an exciting and effective activity! This indicator is not just an assistant but a full-fledged trading system with powerful algorithms that will help you start trading more stable! When you purchase this product, you also get FOR FREE: Exclusive Set Files: For automatic setup and maximum performance. Step-by-step video manual: Learn how to tr
Golden Trend Indicator MT5
Noha Mohamed Fathy Younes Badr
4.89 (18)
Golden Trend indicator  is The best indicator for predicting trend movement this indicator never lags and never repaints and never back paints    and give  arrow buy and sell    before the candle appear  and it will help you and  will make your trading decisions clearer its work on all currencies and  gold and crypto and all time frame This unique  indicator uses very secret algorithms to catch the  trends, so you can trade using this indicator and see the trend clear on charts  manual guide and
MONEYTRON – ТВОЙ ЛИЧНЫЙ СИГНАЛ НА УСПЕХ! XAUUSD | AUDUSD | USDJPY | BTCUSD Поддержка таймфреймов: M5, M15, M30, H1 Почему трейдеры выбирают Moneytron? 82% успешных сделок — это не просто цифры, это результат продуманной логики, точного алгоритма и настоящей силы анализа. Автоматические сигналы на вход — не нужно гадать: когда покупать, когда продавать. 3 уровня Take Profit — ты сам выбираешь свой уровень прибыли: безопасный, уверенный или максимум. Четкий Stop Loss — контролируешь риск
TPSproTREND PrO MT5
Roman Podpora
4.72 (18)
Entry points at the bar close,  without redrawing .  Trend scanner  across all assets,  MTF - mode  and much more in one tool. We recommend using it together with   RFI LEVELS. ИНСТРУКЦИЯ RUS   /   INSTRUCTIONS  ENG         /         VERSION MT4   Main functions: Accurate entry signals WITHOUT REPAINTING! Once a signal appears, it remains valid! This is a significant distinction from repainting indicators that might provide a signal and then alter it, potentially leading to deposit losses. Now,
Grabber System MT5
Ihor Otkydach
5 (5)
Let me introduce you to an excellent technical indicator – Grabber, which works as a ready-to-use "All-Inclusive" trading strategy. Within a single code, it integrates powerful tools for technical market analysis, trading signals (arrows), alert functions, and push notifications. Every buyer of this indicator also receives the following for free: Grabber Utility for automatic management of open orders Step-by-step video guide: how to install, configure, and trade with the indicator Custom set fi
FX Power MT5 NG
Daniel Stein
5 (14)
FX Power: Analyze Currency Strength for Smarter Trading Decisions Overview FX Power is your go-to tool for understanding the real strength of currencies and Gold in any market condition. By identifying strong currencies to buy and weak ones to sell, FX Power simplifies trading decisions and uncovers high-probability opportunities. Whether you’re looking to follow trends or anticipate reversals using extreme delta values, this tool adapts seamlessly to your trading style. Don’t just trade—trade
Support And Resistance Screener Breakthrough unique Solution With All Important levels analyzer and Markets Structures Feature Built Inside One Tool ! Our indicator has been developed by traders for traders and with one Indicator you will find all Imporant market levels with one click. LIMITED TIME OFFER : Support and Resistance Screener Indicator is available for only 50 $ and lifetime. ( Original price 125$ ) (offer extended) The available tools ( Features ) in our Indicator are :  1. HH-LL S
Gold Stuff mt5
Vasiliy Strukov
4.93 (178)
Gold Stuff mt5 is a trend indicator designed specifically for gold and can also be used on any financial instrument. The indicator does not redraw and does not lag. Recommended time frame H1. Contact me immediately after the purchase to get   personal bonus!  You can get a free copy of our Strong Support and Trend Scanner indicator, please pm. me! Settings  and manual   here  Please note that I do not sell my EA's or special sets on telegram, it is only available on Mql5 and my set files are on
Quantum TrendPulse
Bogdan Ion Puscasu
5 (13)
Introducing Quantum TrendPulse , the ultimate trading tool that combines the power of SuperTrend , RSI , and Stochastic into one comprehensive indicator to maximize your trading potential. Designed for traders who seek precision and efficiency, this indicator helps you identify market trends, momentum shifts, and optimal entry and exit points with confidence. Key Features: SuperTrend Integration: Easily follow the prevailing market trend and ride the wave of profitability. RSI Precision: Detect
FX Volume MT5
Daniel Stein
4.82 (17)
FX Volume: Experience Genuine Market Sentiment from a Broker’s Perspective Quick Overview Looking to elevate your trading approach? FX Volume provides real-time insights into how retail traders and brokers are positioned—long before delayed reports like the COT. Whether you’re aiming for consistent gains or simply want a deeper edge in the markets, FX Volume helps you spot major imbalances, confirm breakouts, and refine your risk management. Get started now and see how genuine volume data can
Matrix Arrow Indicator MT5
Juvenille Emperor Limited
5 (13)
Matrix Arrow Indicator MT5  is a unique 10 in 1 trend following   100% non-repainting  multi-timeframe indicator that can be used on all symbols/instruments:   forex,   commodities,   cryptocurrencies,   indices,   stocks .  Matrix Arrow Indicator MT5  will determine the current trend at its early stages, gathering information and data from up to 10 standard indicators, which are: Average Directional Movement Index (ADX) Commodity Channel Index (CCI) Classic Heiken Ashi candles Moving Average
RelicusRoad Pro MT5
Relicus LLC
4.78 (18)
How many times have you bought a trading indicator with great back-tests, live account performance proof with fantastic numbers and stats all over the place but after using it, you end up blowing your account? You shouldn't trust a signal by itself, you need to know why it appeared in the first place, and that's what RelicusRoad Pro does best! User Manual + Strategies + Training Videos + Private Group with VIP Access + Mobile Version Available A New Way To Look At The Market RelicusRoad is th
TPSpro RFI Levels MT5
Roman Podpora
4.55 (20)
Reversal zones / Peak volumes / Active zones of a major player =  TS TPSPROSYSTEM INSTRUCTIONS RUS  /  INSTRUCTIONS   ENG          /       Version MT4 Every buyer of this indicator additionally receives FREE: 6 months of access to trading signals from the RFI SIGNALS service - ready-made entry points according to the TPSproSYSTEM algorithm. Training materials with regular updates - immerse yourself in strategy and grow your professional level. 24/5 support on weekdays and access to a closed tra
MTF Supply Demand Zones MT5
Georgios Kalomoiropoulos
5 (1)
Next Generation Of Automated Supply And Demand Zones. New and Innovative Algorithm that Works At Any Chart. All Zones Are Being Created Dynamically According To Price Action Of The Market. AMAZING OFFER --> Activations from 5 to 20 for "MTF Supply Demand Zones" and "Automated Trendlines" TWO TYPES OF ALERTS -->  1) WHEN PRICE HITS A ZONE    2)WHEN A NEW ZONE IS FORMED  If you get the MTF Supply Demand Zones you can join the " Trade Like Me " Video Series. It contains 14 Live Sessions where 
FourAverageMT5
Mikhail Sergeev
5 (2)
FourAverage is a new word in trend detection. With the development of information technology and a large number of participants, financial markets are becoming less amenable to analysis by outdated indicators. Conventional technical analysis tools, such as a Moving Average or Stochastic, in their pure form are not able to determine the direction of a trend or its reversal. Can one indicator indicate the correct direction of the future price, without changing its parameters, based on the history
FX Levels MT5
Daniel Stein
5 (4)
FX Levels: Exceptionally Accurate Support & Resistance for All Markets Quick Overview Looking for a reliable way to pinpoint support and resistance levels across any market—currencies, indices, stocks, or commodities? FX Levels merges our traditional “Lighthouse” method with a forward-thinking dynamic approach, offering near-universal accuracy. By drawing from real-world broker experience and automated daily plus real-time updates, FX Levels helps you identify reversal points, set profit targe
ATrend
Zaha Feiz
4.77 (13)
ATREND: How It Works and How to Use It How It Works The " ATREND " indicator for the MT5 platform is designed to provide traders with robust buy and sell signals by utilizing a combination of technical analysis methodologies. This indicator primarily leverages the Average True Range (ATR) for volatility measurement, alongside trend detection algorithms to identify potential market movements. Leave a massage after purchase and receive a special bonus gift. Key Features: ⦁ Dynamic Trend Detect
IX Power MT5
Daniel Stein
4.86 (7)
IX Power: Unlock Market Insights for Indices, Commodities, Cryptos, and Forex Overview IX Power is a versatile tool designed to analyze the strength of indices, commodities, cryptocurrencies, and forex symbols. While FX Power offers the highest precision for forex pairs by leveraging all available currency pair data, IX Power focuses exclusively on the underlying symbol’s market data. This makes IX Power an excellent choice for non-forex markets and a reliable option for forex charts when deta
This dashboard shows the latest available   harmonic patterns   for the selected symbols, so you will save time and be more efficient /   MT4 version . Free Indicator:   Basic Harmonic Pattern Comparison of "Basic Harmonic Pattern" vs. "Basic Harmonic Patterns Dashboard" Indicators Feature Basic Harmonic Pattern Basic Harmonic Patterns Dashboard Functionality Detects and displays harmonic patterns on a single chart Searches multiple symbols and timeframes for harmonic patterns, displays res
FX Dynamic: Track Volatility and Trends with Customized ATR Analysis Overview FX Dynamic is a powerful tool that leverages Average True Range (ATR) calculations to give traders unparalleled insights into daily and intraday volatility. By setting up clear volatility thresholds—such as 80%, 100%, and 130%—you can quickly identify potential profit opportunities or warnings when markets exceed typical ranges. FX Dynamic adapts to your broker’s time zone, helps you maintain a consistent measure of
Top indicator for MT5   providing accurate signals to enter a trade without repainting! It can be applied to any financial assets:   forex, cryptocurrencies, metals, stocks, indices .  Watch  the video  (6:22) with an example of processing only one signal that paid off the indicator! MT4 version is here It will provide pretty accurate trading signals and tell you when it's best to open a trade and close it. Most traders improve their trading results during the first trading week with the help of
This dashboard discovers and displays the  Supply  and  Demand  zones on the chart, both in scalping and long term mode, depending on your trading strategy for the selected symbols. In addition, the scanner mode of the dashboard helps you to check all desired symbols at a glance and not to miss any suitable positions /   MT4 version Free indicator:   Basic Supply Demand Features Allows you to view trading opportunities on   multiple currency pairs , giving you a clear and concise view of all p
Divergence Bomber
Ihor Otkydach
5 (1)
Each buyer of this indicator also receives the following for free: The custom utility "Bomber Utility", which automatically manages every trade, sets Stop Loss and Take Profit levels, and closes trades according to the rules of this strategy Set files for configuring the indicator for various assets Set files for configuring Bomber Utility in the following modes: "Minimum Risk", "Balanced Risk", and "Wait-and-See Strategy" A step-by-step video manual to help you quickly install, configure, and s
First of all Its worth emphasizing here that this Trading Tool is Non Repainting , Non Redrawing and Non Lagging Indicator , Which makes it ideal for professional trading . Online course, user manual and demo. The Smart Price Action Concepts Indicator is a very powerful tool for both new and experienced traders . It packs more than 20 useful indicators into one , combining advanced trading ideas like Inner Circle Trader Analysis and Smart Money Concepts Trading Strategies . This indicator focus
Trend Hunter MT5
Andrey Tatarinov
5 (2)
Trend Hunter is a trend indicator for working in the Forex, cryptocurrency, and CFD markets. A special feature of the indicator is that it confidently follows the trend, without changing the signal when the price slightly pierces the trend line. The indicator is not repaint; a signal to enter the market appears after the bar closes. When moving along a trend, the indicator shows additional entry points in the direction of the trend. Based on these signals, you can trade with a small StopLoss. Tr
DESCRIPTION ICSM (Impulse-Correction SCOB Mapper) is the indicator that analyzes the price movement and identifies valid impulses, corrections and SCOBs (Single Canndle Ordere Block). It is a powerful tool that can be used with any type of technical analysis because it's flexible, informative, easy to use and it does substantially improve trader's awareness of the most liquid zones of interest. SETTINGS General | Visuals Colour theme — defines the colour theme of the ICSM. SCOB | Visuals Show
Blahtech Supply Demand MT5
Blahtech Limited
4.54 (13)
Was: $299  Now: $149  Supply Demand uses previous price action to identify potential imbalances between buyers and sellers. The key is to identify the better odds zones, not just the untouched ones. Blahtech Supply Demand indicator delivers functionality previously unavailable on any trading platform. This 4-in-1 indicator not only highlights the higher probability zones using a multi-criteria strength engine, but also combines it with multi-timeframe trend analysis, previously confirmed swings
MetaBands M5
Vahidreza Heidar Gholami
4.5 (2)
MetaBands uses powerful and unique algorithms to draw channels and detect trends so that it can provide traders with potential points for entering and exiting trades. It’s a channel indicator plus a powerful trend indicator. It includes different types of channels which can be merged to create new channels simply by using the input parameters. MetaBands uses all types of alerts to notify users about market events. Features Supports most of the channel algorithms Powerful trend detection algorith
ICT, SMC, SMART MONEY CONCEPTS, SMART MONEY, Smart Money Concept, Support and Resistance, Trend Analysis, Price Action, Market Structure, Order Blocks, BOS/CHoCH,   Breaker Blocks ,  Momentum Shift,   Supply&Demand Zone/Order Blocks , Strong Imbalance, HH/LL/HL/LH,    Fair Value Gap, FVG, Invert FVG, IFVG,  Premium  &   Discount   Zones, Fibonacci Retracement, OTE, Buy Side Liquidity, Sell Side Liquidity, BSL/SSL Taken, Equal Highs & Lows, MTF Dashboard, Multiple Time Frame, Big Bar, HTF OB, HTF
More from author
Sweet VWAP Anchored MT5
Francisco Gomes Da Silva
5 (6)
Save time and make more accurate decisions with Anchored VWAPs If you want to test the power of this tool, you can download the free Anchored VWAPs indicator for MT5 . In addition to this indicator working independently, it is also an extension for the free Sweet VWAP version. This is because when you click in the free version, the VWAP you see at the mouse pointer will be anchored. And for better understanding, what will be anchored there is this indicator, with all its functionalities. This in
Supports And Resistances Lines
Francisco Gomes Da Silva
4.76 (37)
Support and Resistance zones Indicator MT5 this indicator knows how to identify tops and bottoms automaticly. This support and resistance indicator creates support lines and resistance lines based on tops and bottoms. how to make support and resistance lines. this is an indicator to make automatic support and resistance lines. how to find support level with indicator. this indicator finds tops and bottoms automaticly. The Indicator automatically creates support lines every time “Fractals” create
FREE
Rule Plotter Expert
Francisco Gomes Da Silva
5 (3)
This Expert Advisor has been designed to test and execute your strategies created within the Rule Plotter indicator. How to use: Download the indicator Rule Plotter - a tool for creating trading systems without the need for programming . Next, develop your strategies within the Rule Plotter indicator. Finally, execute your created strategies using this Expert Advisor. Parameters: Strategy: Your trading system created within the Rule Plotter indicator, allowing you to test and execute your custom
VWAP With Alerts
Francisco Gomes Da Silva
5 (4)
This VWAP is a simple VWAP, but we have added alerts to let you know when the price touches the simple VWAP or when the price crosses the VWAP. This indicator is a traditional VWAP indicator for MetaTrader 5 (MT5). The default parameters are those of the normal VWAP, but you have the ability to use new calculations and the best part: When the price touches or crosses the VWAP, you will be notified through alerts, mobile notifications, email, or sound events. Free anchored VWAP indicator for MT5
FREE
Sweet VWAP Aux
Francisco Gomes Da Silva
4.4 (5)
Save time and make more informed decisions with Sweet VWAP Aux If you haven't already downloaded our free VWAP indicator for Metatrader 4 , do it now and experience its incredible capabilities for visualizing anchored vwap. Then come back here and get to know Sweet VWAP Aux - the perfect extension for your Sweet VWAP indicator. With just one click, Sweet VWAP allows you to anchor the VWAP indicator at the point of your choice, saving time and eliminating the need to set it up manually. In additi
Trend Plator
Francisco Gomes Da Silva
TrendPlator: A Powerful Trend Projection Indicator for Optimized Trading Strategies Discover the power of our new indicator! With the ability to calculate trend lines from larger timeframes and project them directly onto your current timeframe, it provides strategic support that captures the attention of traders. These points become powerful support or resistance levels for your trades, boosting your trading strategy. Imagine having access to an indicator that seamlessly complements your collect
Auto Anchored VWAPs
Francisco Gomes Da Silva
Unveil Trading Insights with Auto Anchored VWAPs: Auto Anchored VWAPs serve as your guiding companion in the world of trading. These indicators pinpoint crucial market turning points and illustrate them on your chart using VWAP lines. This is a game-changer for traders who employ anchored VWAP strategies. How Does It Work? Identifying High Points: If the highest price of the current candle is lower than the highest price of the previous one, And the previous high is higher than the one before it
Paula Bollinger Bands
Francisco Gomes Da Silva
4.29 (7)
Transform your investment strategy with the Expert Advisor for MetaTrader investor robot. Based on the powerful Bollinger Bands strategy, created by Joe Ross and dubbed Paula by renowned Brazilian trader Rodrigo Cohen, you will have access to advanced technology that will maximize your profits and minimize your risks. Don't waste any more time with old and inefficient strategies. With our investor robot, you will have access to a highly accurate algorithm that combines technical analysis of ma
FREE
Bar Number
Francisco Gomes Da Silva
5 (5)
Candle counter This indicator counts and identifies candles based on a longer time frame Bigger Timeframe You can choose the daily timeframe as " Bigger Timeframe ", and run it within any smaller chart. that it will count the bars based on the daily chart . If you pass as a parameter the timeframe " H1 " then the indicator will know how to count the bars inside the H1 chart you just need to run it on smaller charts. The main parameter is the " Bigger Timeframe " which is a larger timeframe than
FREE
VWAP With Alerts MT4
Francisco Gomes Da Silva
5 (4)
This VWAP is a simple VWAP, but we've incorporated notifications that inform you when the price hits or crosses the VWAP line. This indicator is a traditional VWAP indicator for MetaTrader 4 (MT4). The default parameters are those of the normal VWAP, but you have the ability to modify the VWAP calculation, and the best part: When the price touches or crosses the VWAP, you will be notified through alerts, mobile notifications, email, or sound events. Anchored VWAP indicator for MT4 . Parameters:
FREE
Rule Plotter
Francisco Gomes Da Silva
5 (8)
Build Your Strategy Yourself This tool allows you to develop your strategies using all the indicators available natively in MetaTrader and any indicators downloaded from the internet that use buffers to display data on the screen. This tool is another reason for you to consider MetaTrader to automate your trading strategies. With it, you can create your own strategy signals in a simple and intuitive way, using any MetaTrader indicator. How Do I Know If My Internet-Downloaded Indicator Uses Buffe
FREE
Auto Anchored VWAPs MT4
Francisco Gomes Da Silva
Unveil Trading Insights with Auto Anchored VWAPs: Auto Anchored VWAPs serve as your guiding companion in the world of trading. These indicators pinpoint crucial market turning points and illustrate them on your chart using VWAP lines. This is a game-changer for traders who employ anchored VWAP strategies. How Does It Work? Identifying High Points: If the highest price of the current candle is lower than the highest price of the previous one, And the previous high is higher than the one before it
Supports And Resistances Lines MTF MT4
Francisco Gomes Da Silva
4.89 (9)
Supports and Resistances, was created to help you identify tops and bottoms automatically on several different timeframes and thus plot these tops and bottoms on the current chart. Let's go to the explanation of the creation of resistances There is a rule field, which you can define what is a top and bottom the top rule is set by default like this: H[ 0 ]<=H[ 1 ] and H[ 1 ]=>H[ 2 ] Where: Element Description H  means   High [0]  means   current   candle [1]  means   previous   candle <=  mean
FREE
My Candle
Francisco Gomes Da Silva
5 (1)
Define your own candlestick pattern and this indicator will show on the screen when this pattern appears You can test it for free in the Strategy Tester and see how many times your candlestick pattern appears on the asset of your choice You can also paint all candles of your pattern or just one This indicator is useful for candlestick analysis, for you to use in price action and with naked trade strategies. It is an indicator that shows the movement you choose How to Use the Indicators: AC AC[1
FREE
OHLC Shifted
Francisco Gomes Da Silva
4.67 (3)
Previous Day's Close and Bar Shift Indicator for MetaTrader! The Previous Day's Close and Bar Shift Indicator is a tool designed to enhance technical analysis and decision-making in trading. With this indicator, you will have access to detailed information about the opening, high, low, and closing levels of any bar, allowing for precise and comprehensive analysis of market movements. Imagine having the ability to nest one timeframe within another, enabling detailed analysis of each bar across di
FREE
OHLC Shifted MT4
Francisco Gomes Da Silva
5 (2)
Previous Day's Close and Bar Shift Indicator for MetaTrader! The Previous Day's Close and Bar Shift Indicator is a tool designed to enhance technical analysis and decision-making in trading. With this indicator, you will have access to detailed information about the opening, high, low, and closing levels of any bar, allowing for precise and comprehensive analysis of market movements. Imagine having the ability to nest one timeframe within another, enabling detailed analysis of each bar across di
FREE
Paula Bollinger Bands Strategy
Francisco Gomes Da Silva
4 (2)
Bollinger bands out/in strategy A strategy created by Joe Ross, and very useful for finding trades when the market is overloaded. Indicator You don't need to find where there are entries on the chart, this indicator shows them for you. The entrance The trade is confirmed when the price closes outside the bollinger bands on a candle and the candle after the price closes inside the bands. comment I want to improve this indicator, so you can help me sending me your reviews and comments, thanks :).
FREE
Bar Counter MT4
Francisco Gomes Da Silva
5 (5)
candlestick counter indicator this indicator counts candles that are on the chart of any timeframe a free bar counter for you to download on mt4 the candlestick counter counts how many candles there are inside a larger chart with this candle counter you can do the automatic candlestick count free candlestick count indicator for you to download and count bars automatically bar counter to count the bars count candle counter indicator mt4 count candle bar counter for MT5 If you are interested in th
FREE
My Candle Patterns
Francisco Gomes Da Silva
5 (1)
This indicator is a demo version of the complete My candle, which can be downloaded here: Candle Patterns Creator With the full version, you can create your own candle rules and modify a traditional candle pattern to be more accurate according to your strategy. The indicator includes several example candle rules, but here I will demonstrate only a few: Pattern Rule Candle Green C > O Candle Red C < O Doji C = O Hammer (C > O and (C-O) *2 < O-L and (C-O) *0.5 > H-C) or (C < O and (O-C) *2 < C-L a
FREE
Fibonacci on ZigZag
Francisco Gomes Da Silva
4.91 (11)
Mouse You can draw fibonaccis moving the mouse over the zigzag indicator Pin them You can click on fibonacci with this option and it will no longer be deleted unless you click on it again :) Precision The tuned fibonacci gets the precise point in lower timeframes Enjoy it You can ask me for add more features, so please comment and leave your ranting for me to be happy, thank you :)
FREE
Rule Plotter Scanner
Francisco Gomes Da Silva
Have you ever thought about having a scanner that scans all strategies and shows the buy and sell points for all timeframes of that asset, all at the same time? That's exactly what this scanner does. This scanner is designed to display the buy and sell signals you created in the Rule Plotter: strategy creator without programming and run them within this scanner on various assets and different timeframes. The default strategy for Rule Plotter is only bullish and bearish candles. This means that i
FREE
First Bar
Francisco Gomes Da Silva
Trade System You choose a bar on the day to trade, when this bar closes the robot will send two orders a at the high other at the low of the candle, which gets again the other will be canceled Stop the stop will be one tick under the low on case of the buy, or one tick above the high on case of the sell Take The take can be setted how much you wants of the stop range, it can be costumized in the strategy otimization Otimization This robot have the input to get risck return, so you can run int in
FREE
Rule Plotter MT4
Francisco Gomes Da Silva
4.25 (4)
How to Create an Automated Trading Robot Have you ever wondered how powerful it would be to automate your trading strategies with just a few clicks of the mouse? Imagine having the freedom to create and test different trading strategies without the need to dive into complicated code. With Rule Plotter, this vision becomes a reality. Here we will explore how you can create your own custom trading robot using Rule Plotter, a trade-system creation tool that simplifies the entire process. What is Ru
FREE
Triple MA Trader
Francisco Gomes Da Silva
Automated Trading in MetaTrader: Investment Robots and Simple Strategy for Beginners Automated trading has been gaining more space in the financial market, mainly because it offers a practical way to trade without the need for advanced knowledge. With the advancement of technology and the popularization of investment robots , investors of all levels can benefit from automated trading through platforms like MetaTrader . In this article, we will explore how an expert advisor works, the importance
TrendPlator
Francisco Gomes Da Silva
TrendPlator: Empower Your Trading Strategies with an Advanced Trend Projection Indicator Explore the potential of our innovative indicator! With the ability to analyze and project trend lines from larger timeframes directly onto your current timeframe, it provides strategic support that catches the attention of traders across the board. These points become strategic levels of support or resistance for your trades, strengthening your trading strategy. Visualize the opportunity to add an indicator
Hide Scale
Francisco Gomes Da Silva
Hide Scale - Tool for Traders Who Want More Screen Space Instructions Press "T" to hide the time scale and "P" to hide the price scale. You can customize these keys by clicking the corresponding button and typing a new key on your keyboard. To hide both scales at the same time, you can assign the same key to both options. To show the scales again, simply press the corresponding key again. Why We Created This Tool We created this Hide Scale tool to help traders who use our Sweet VWAP indicator to
FREE
Hide Scale MT4
Francisco Gomes Da Silva
5 (4)
Hide Scale - The ideal tool for traders who want to maximize chart space How to use Hide Scale Press "T" to hide the time scale and "P" to hide the price scale. You can customize the keyboard shortcuts by clicking on the corresponding buttons and choosing a new key for each function. If you want to hide both scales at the same time, you can assign the same key to both options. To display the scales again, simply press the corresponding key again. The reason behind creating this tool We developed
FREE
Pattern Wizard
Francisco Gomes Da Silva
5 (1)
Patterns Wizard is a tool for creating candlestick patterns. With it, you can create various patterns and add as many instances of this indicator as you want on your chart, each with a different pattern. To better understand how creation formulas work, you can refer to the examples of the My Candle indicator, which has over 70 examples of candlestick patterns The main difference with this indicator is that it has 30 rule parameters , meaning you can set a different rule for each of the last 30 c
FREE
Pattern Wizard MT4
Francisco Gomes Da Silva
Patterns Wizard is a tool for creating candlestick patterns. With it, you can create various patterns and add as many instances of this indicator as you want on your chart, each with a different pattern. To better understand how creation formulas work, you can refer to the examples of the My Candle indicator, which has over 70 examples of candlestick patterns The main difference with this indicator is that it has 30 rule parameters , meaning you can set a different rule for each of the last 30 c
FREE
Discover the Power of Risk Management with Price Action to Position Your Stop Loss! Have you ever experienced the situation where you know exactly when to enter a trade, but you're unsure about the right time to exit? Don't worry, you're not alone! Many traders face this challenge on a daily basis. The good news is that our price action-based risk management tool is here to solve this problem. While you focus on identifying the optimal entry points, our tool takes control and handles the trade e
Filter:
No reviews
Reply to review