Multi Timeframe Analyzer
- Indicators
- Hapu Arachchilage Tharindu Lakmal
- Version: 1.0
- Activations: 10
Hello, traders!
Welcome to the introduction of Multi Timeframe Analyzer v1.0! (MT5)
This is the Meta Trader 5 version of the "Market Meeter".
Click here to Get MT4 version <<---
What is this indicator?
Simply put, this indicator analyzes the market across eight different timeframes, from lower to higher, and predicts the next price direction along with an estimated continuation time. It does this by using volume, volatility, and price patterns in its calculations.
Let's dive into the information panels and see what each one represents.
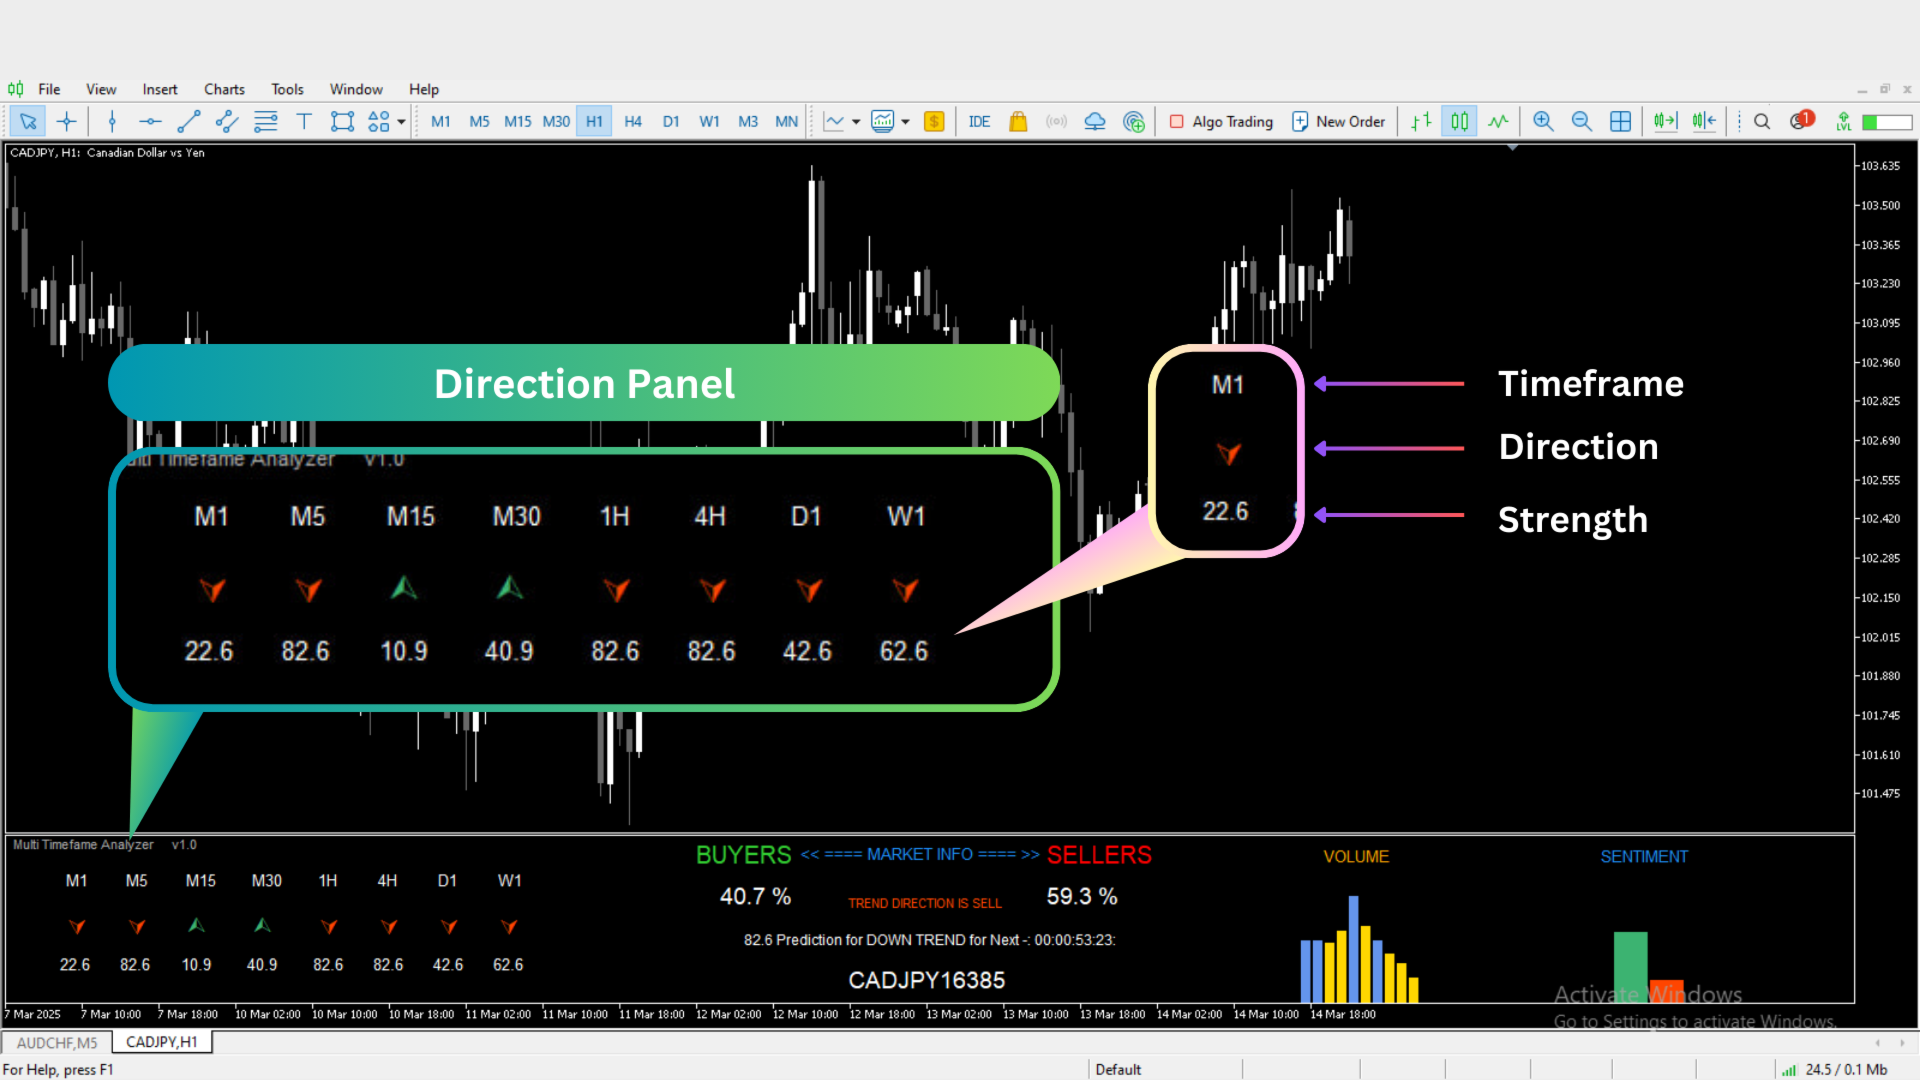
01. The Direction Panel
Starting from the left, we have the Direction Panel. This panel shows the expected market direction along with the strength of the move. At the top, there are eight different timeframes. The arrows indicate the current trend direction for each timeframe
- Up arrow for a bullish trend
- Down arrow for a bearish trend
You can customize the arrow colors in the input menu to match your preferred chart theme.
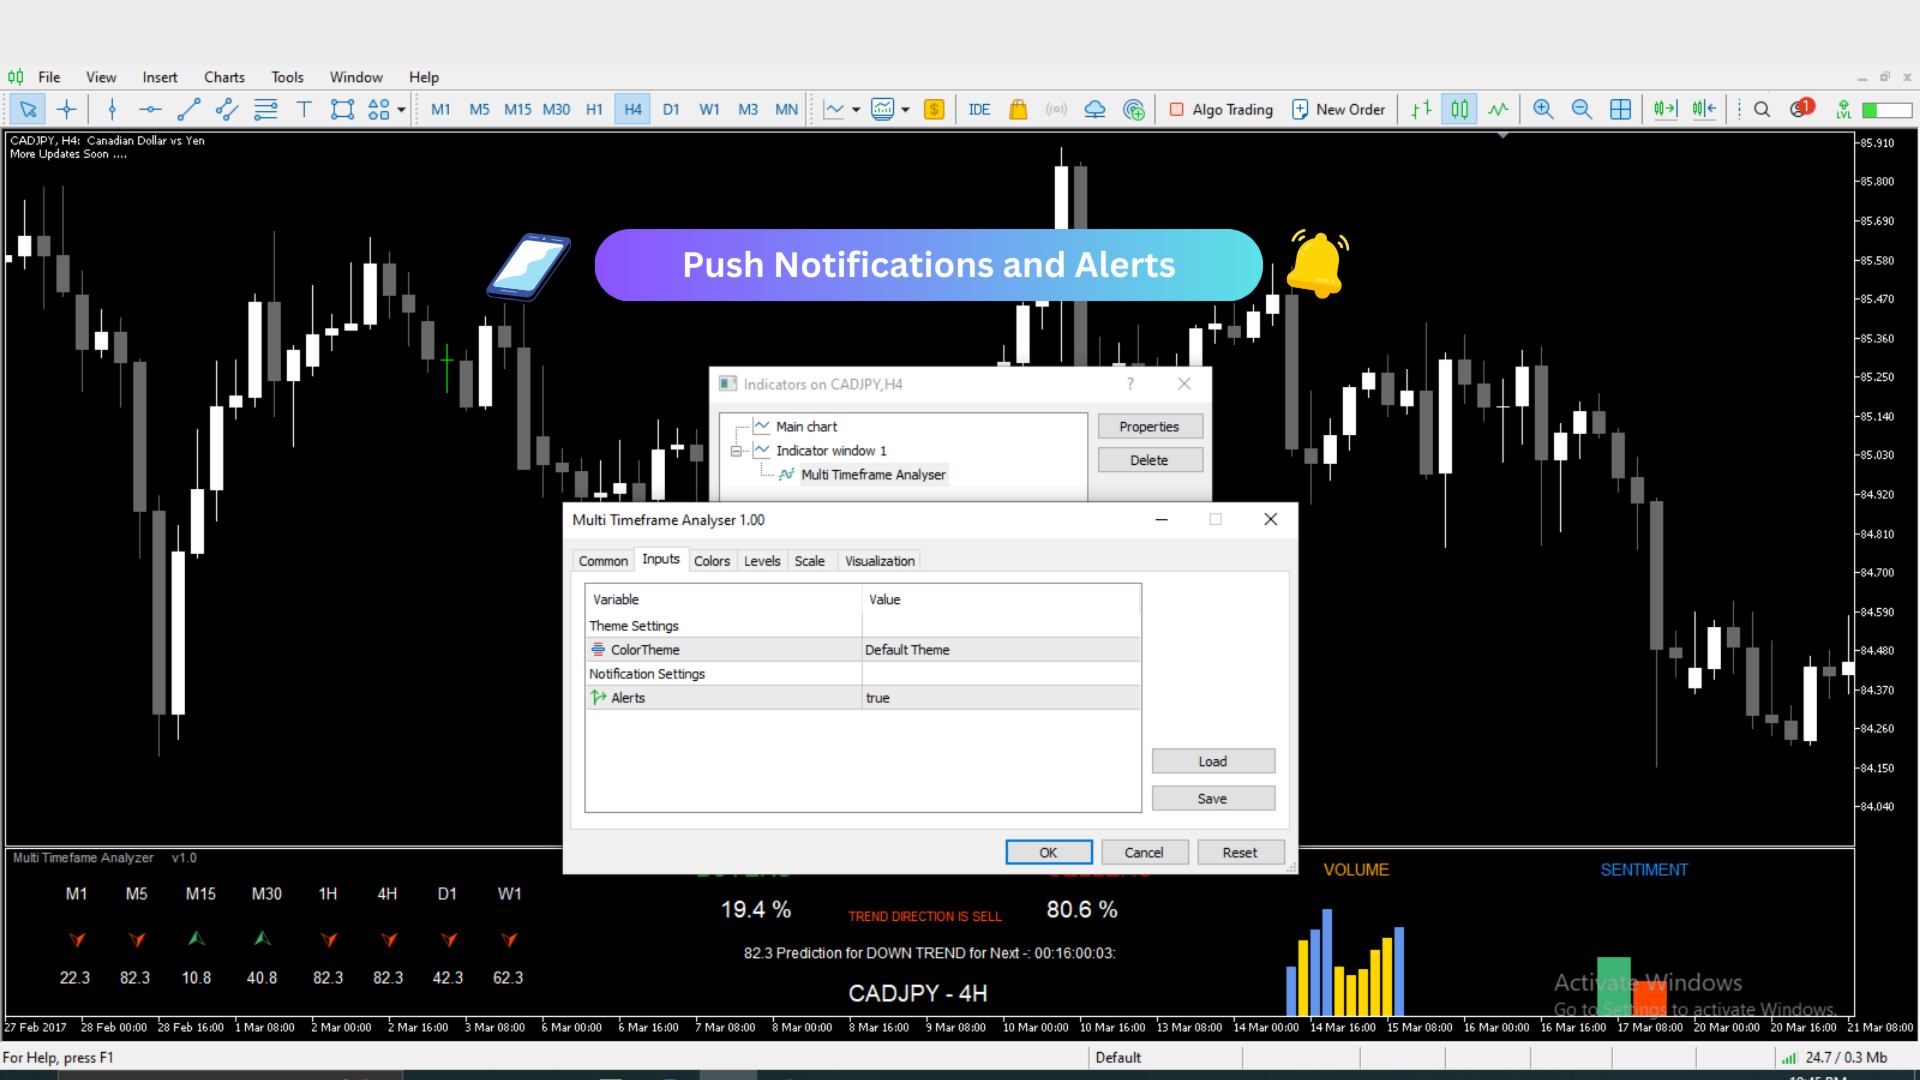
Once the indicator is applied to your chart, it will send you instant alerts whenever there’s a direction change. You'll receive these alerts directly on your trading platform and as push notifications on your phone, so you don’t have to stay glued to the screen!
Below the arrows, you’ll see numbers representing the strength of the current trend.
- A higher number means the trend is likely to continue.
- A lower number means the trend is losing its momentum.
This strength calculation is based on how a higher timeframe behaves relative to the selected timeframe.
For example, if you’re looking at the 1-minute chart, the 5-minute chart’s behavior will be considered when calculating strength.
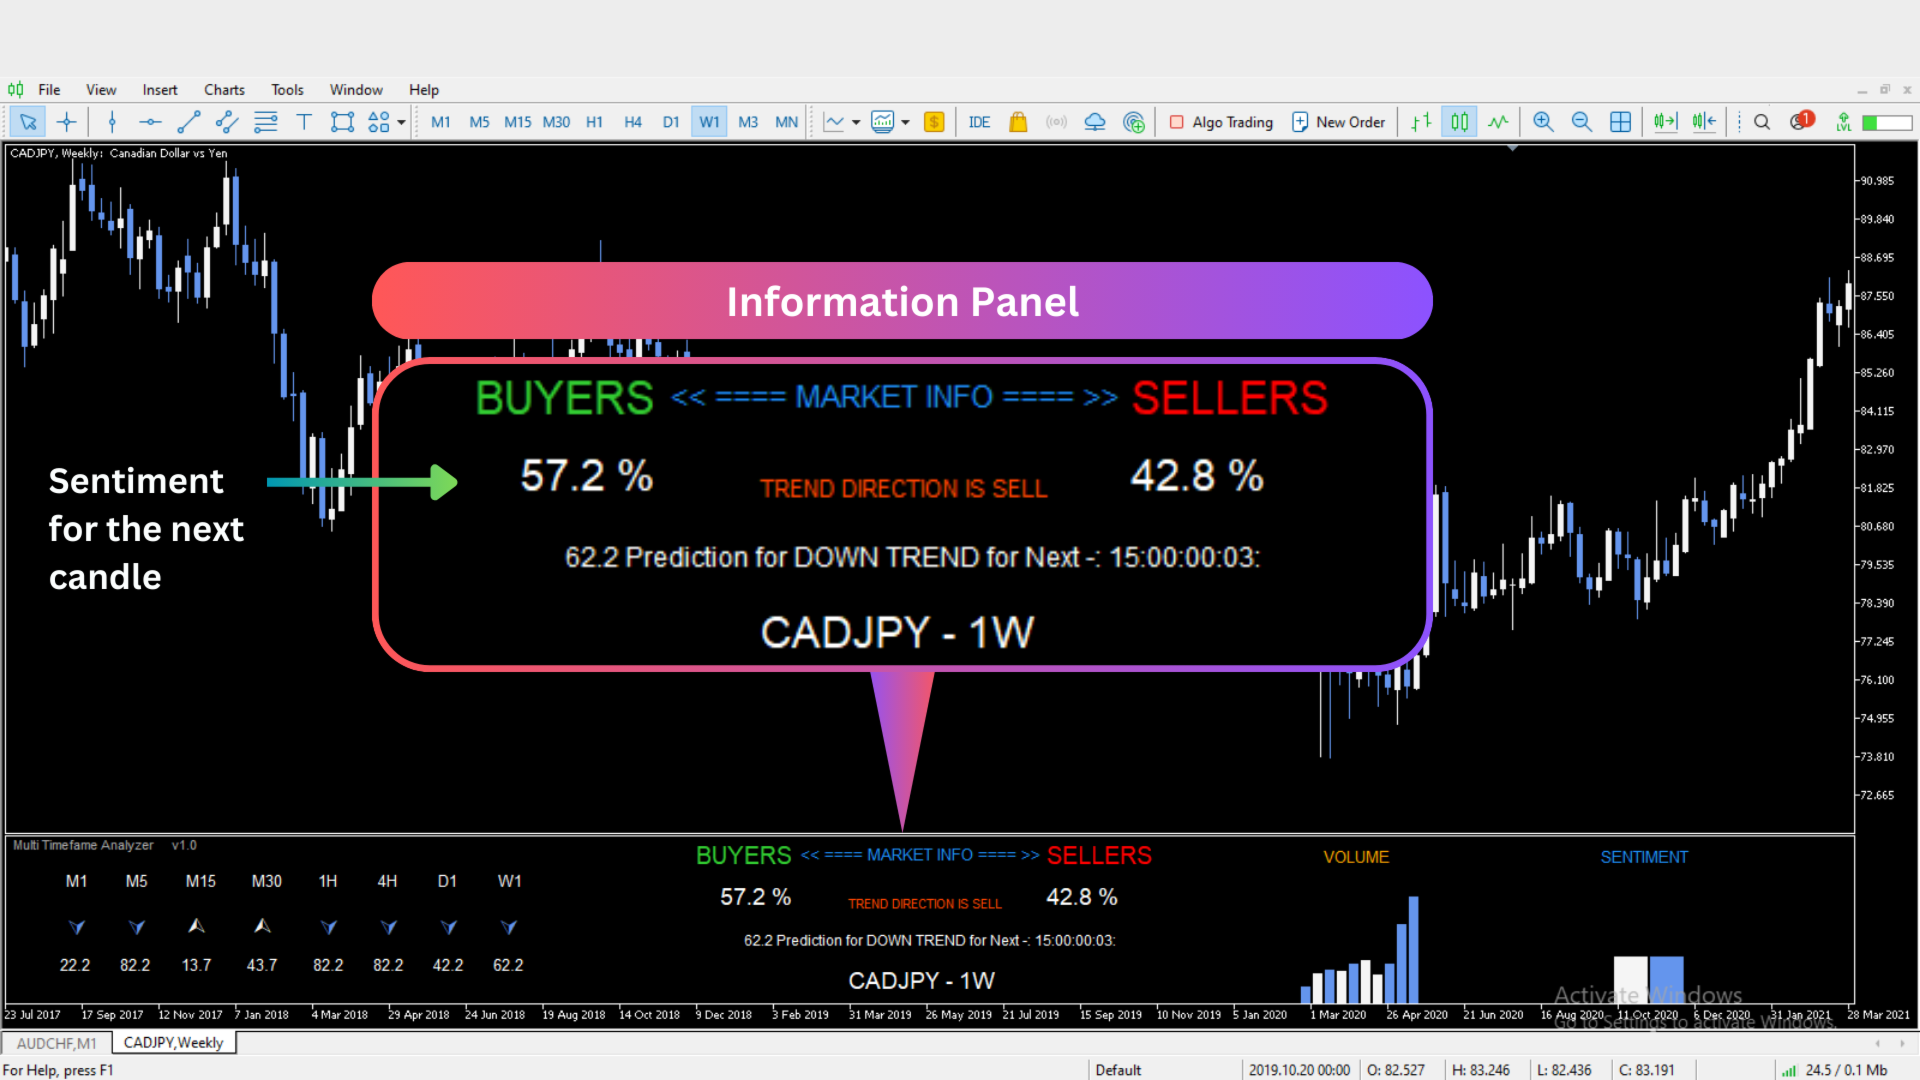
02.The Information Panel
Here, you’ll see two sections labeled Buyers and Sellers, each with a percentage.
What do these numbers mean?
They represent the probability that the next candle will follow the predicted trend.
- If the indicator predicts a bullish trend and the buyer percentage is above 50%, there’s a higher chance that the next candle will also be bullish.
- The same applies to a bearish trend and seller percentage.
This feature is especially useful for scalping entries. Below that, you'll see the direction signal, which shows the current trend of the chart. Underneath, there's another indicator displaying how long the trend is expected to last.
It's all very simple—once you start using the indicator, you’ll get familiar with everything in just a few minutes!
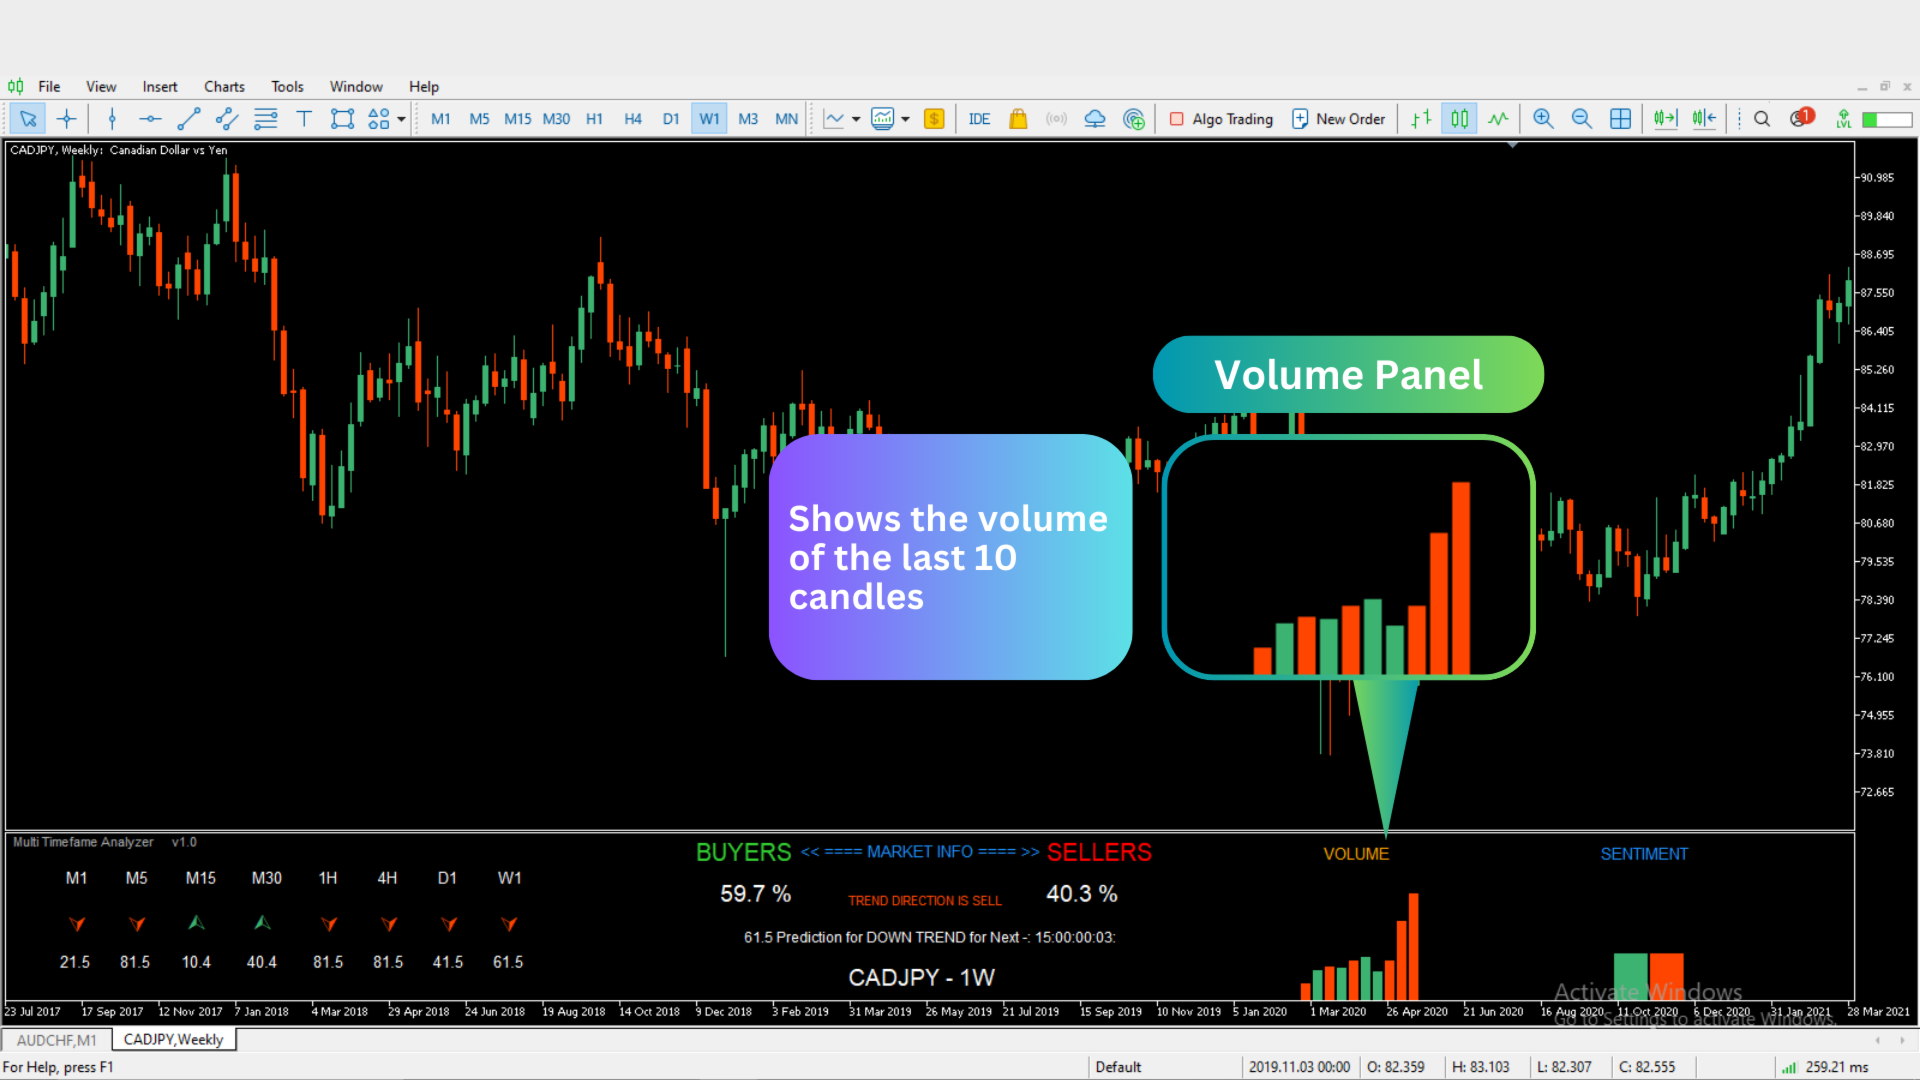
03. The Volume Panel
This panel shows the volume levels of the last 10 candles on the current chart.
Why only 10 candles?
Because monitoring a shorter timeframe allows you to closely track volume changes in real time.
- If volume is increasing, it signals that a strong price movement is coming.
- If volume is decreasing, it indicates a potential slowdown.
You can also customize the colors of the volume bars in the input menu.
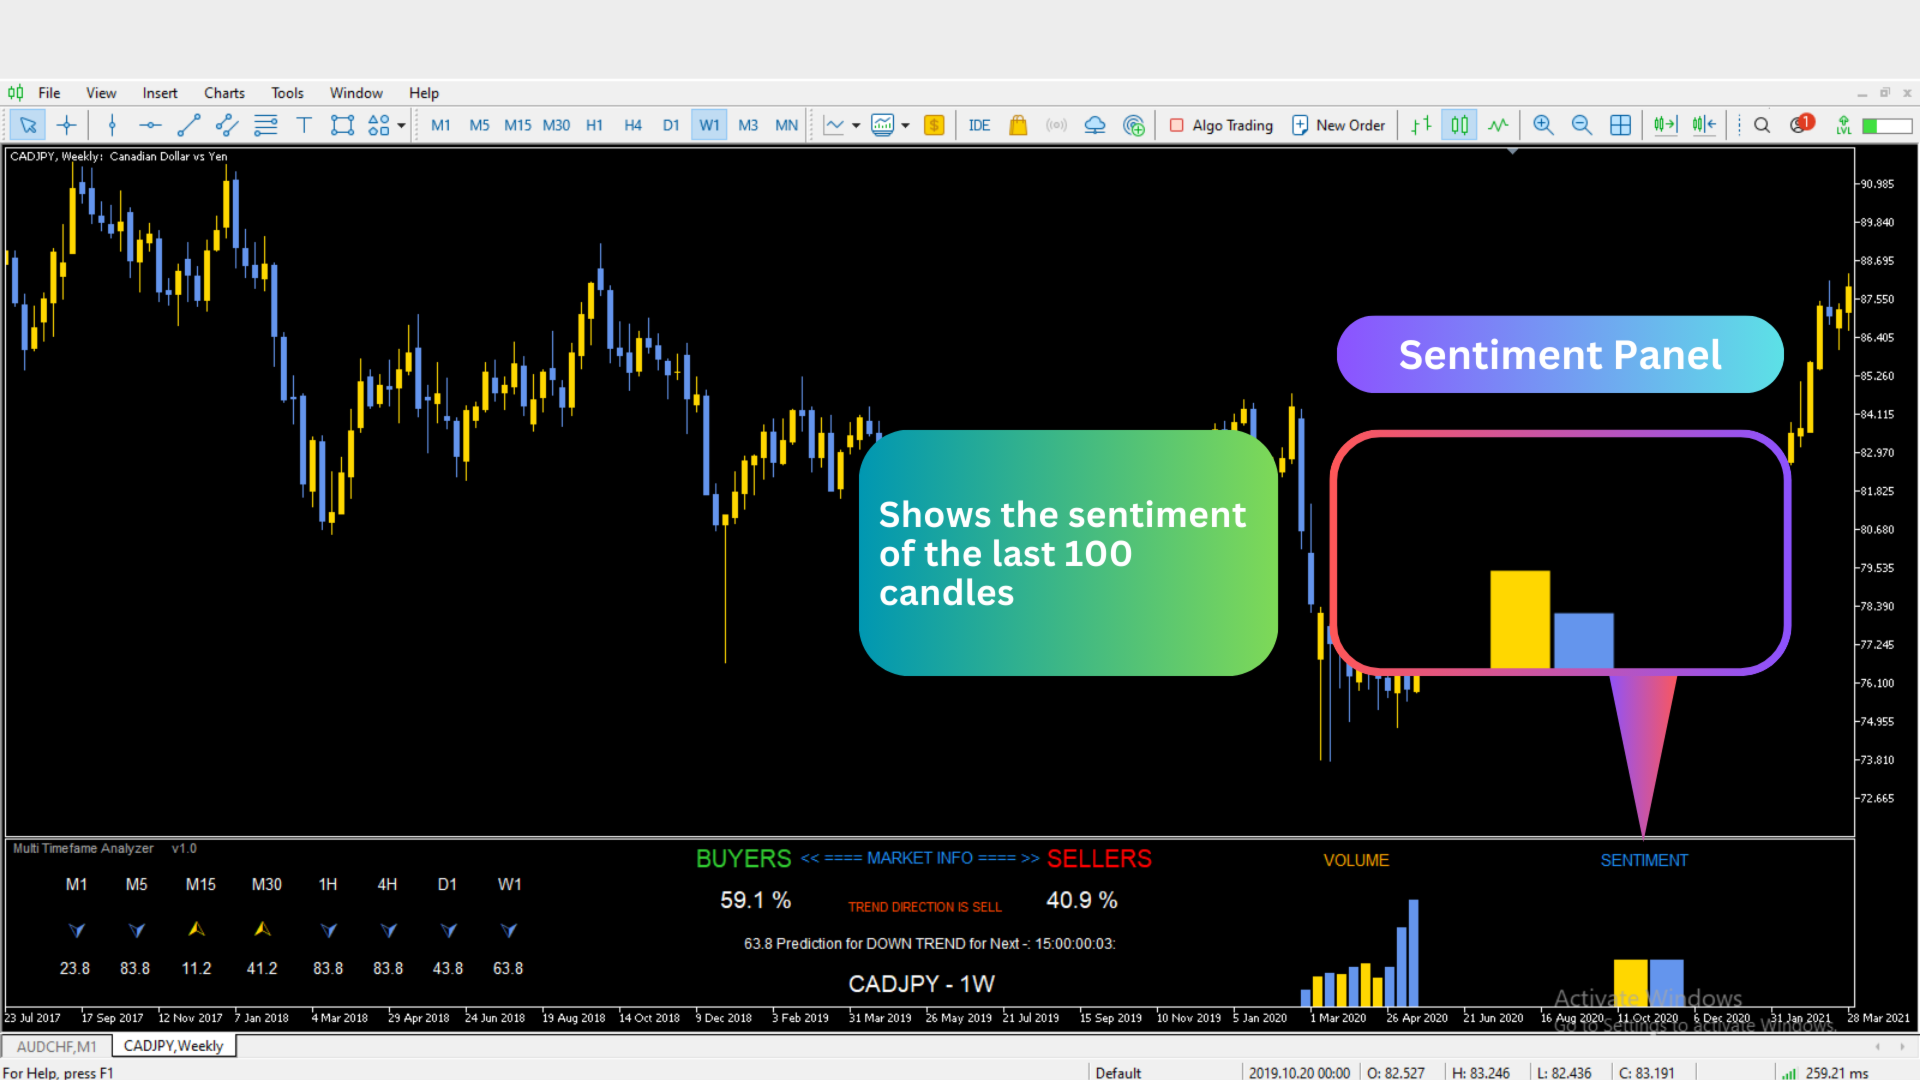
04. The Sentiment Panel
This panel shows the current market sentiment.
If you use sentiment analysis in your trading, this can be a powerful tool.
When sentiment aligns with the overall trend, it’s a strong indication that the price is likely to move in the anticipated direction.
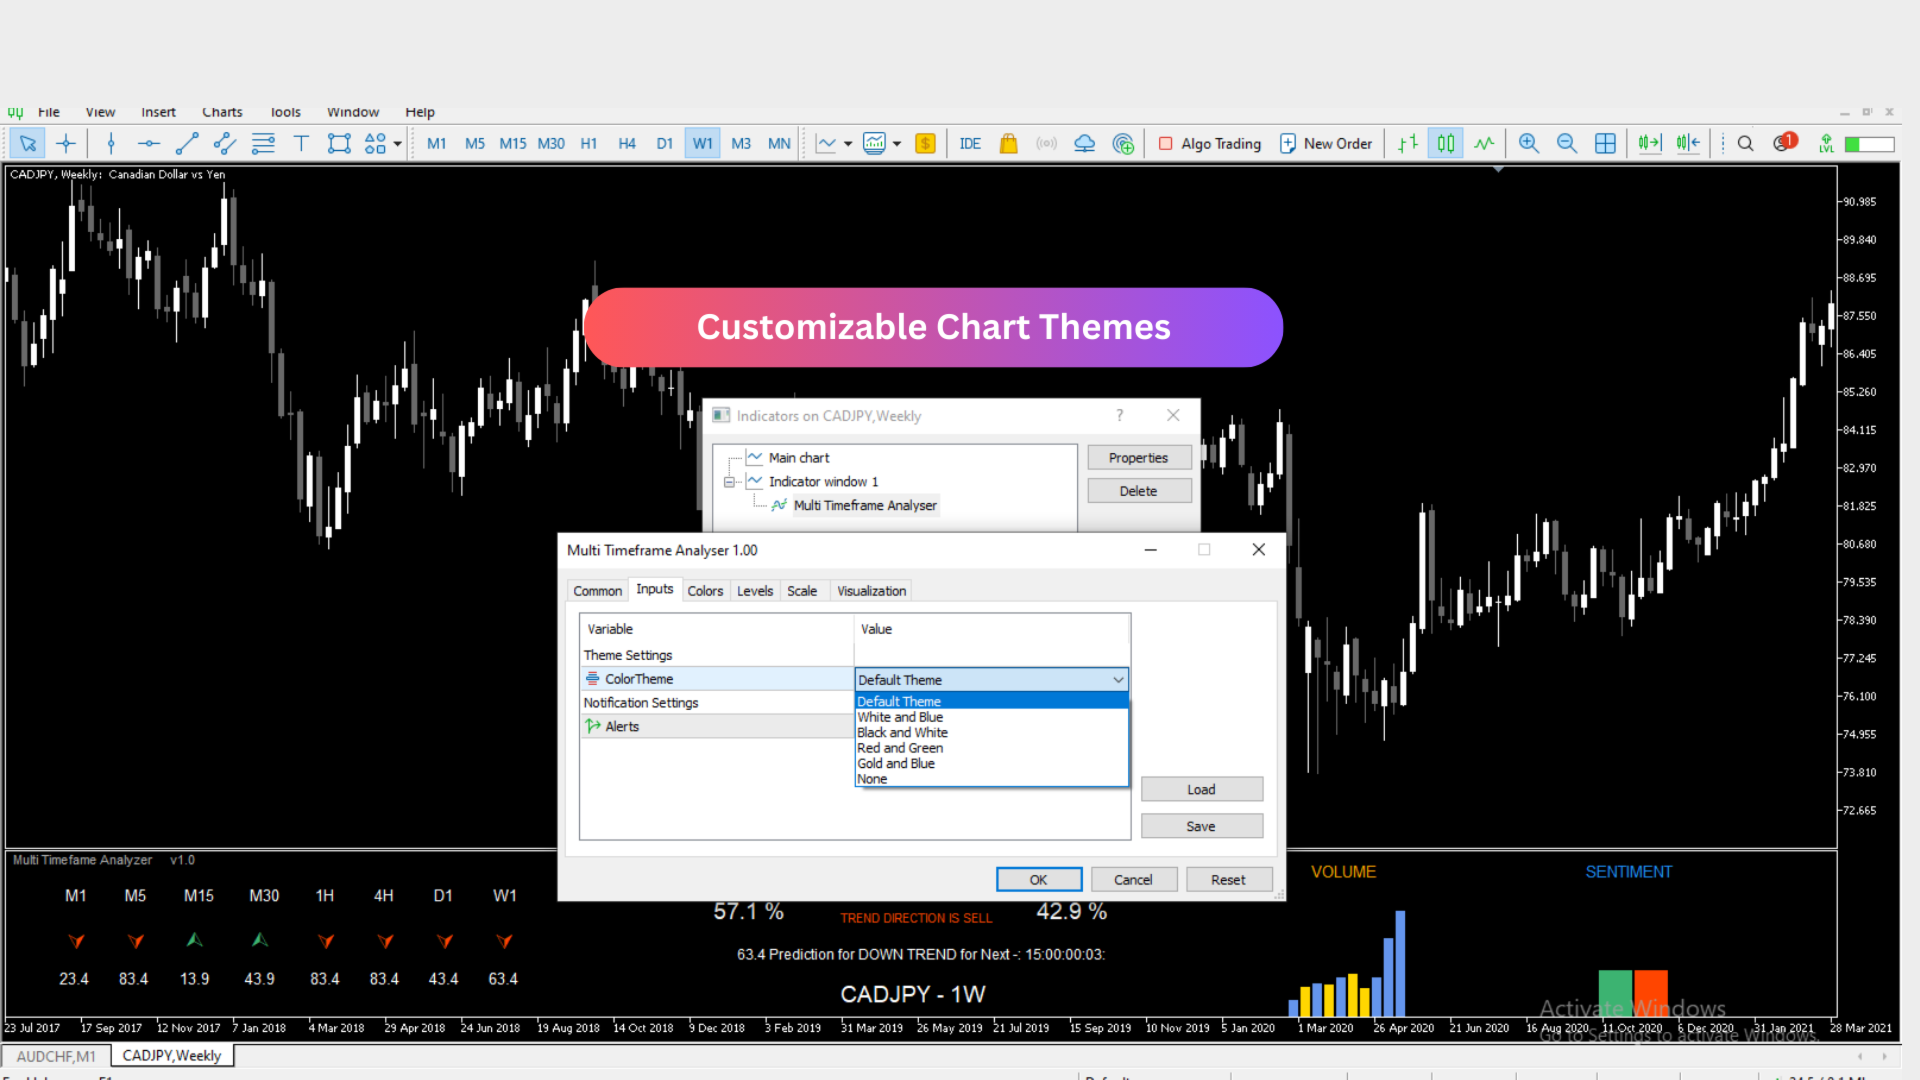
05. Indicator Inputs & Customization
Now, let's take a quick look at the indicator settings.
- You can choose from different color themes to match your chart style.
- You can enable or disable alerts by setting the notification option to true or false.
06. How to use this indicator?
You can use the indicator standalone to trade like scalping trading by following the arrow signals. Using this indicator as a combination with other indicators will give you the best readings. Don't use the indicator for news trading because it's not designed for news trading.
Do you use Meta Trader 4? Click bellow to get the Meta Trader 4 version of the "Multi Timeframe Analyzer".
Download Multi Timeframe Analyzer for MT4
I hope you understood all about the indicator. Thanks for reading this,
Happy trading...!