OILio
- Experts
- Sirapat Thuamphiwthong
- Version: 2.0
- Updated: 18 March 2025
- Activations: 5
📑 Strategic Oil Trading Proposal (USOUSD) for Investors
🎯Objective
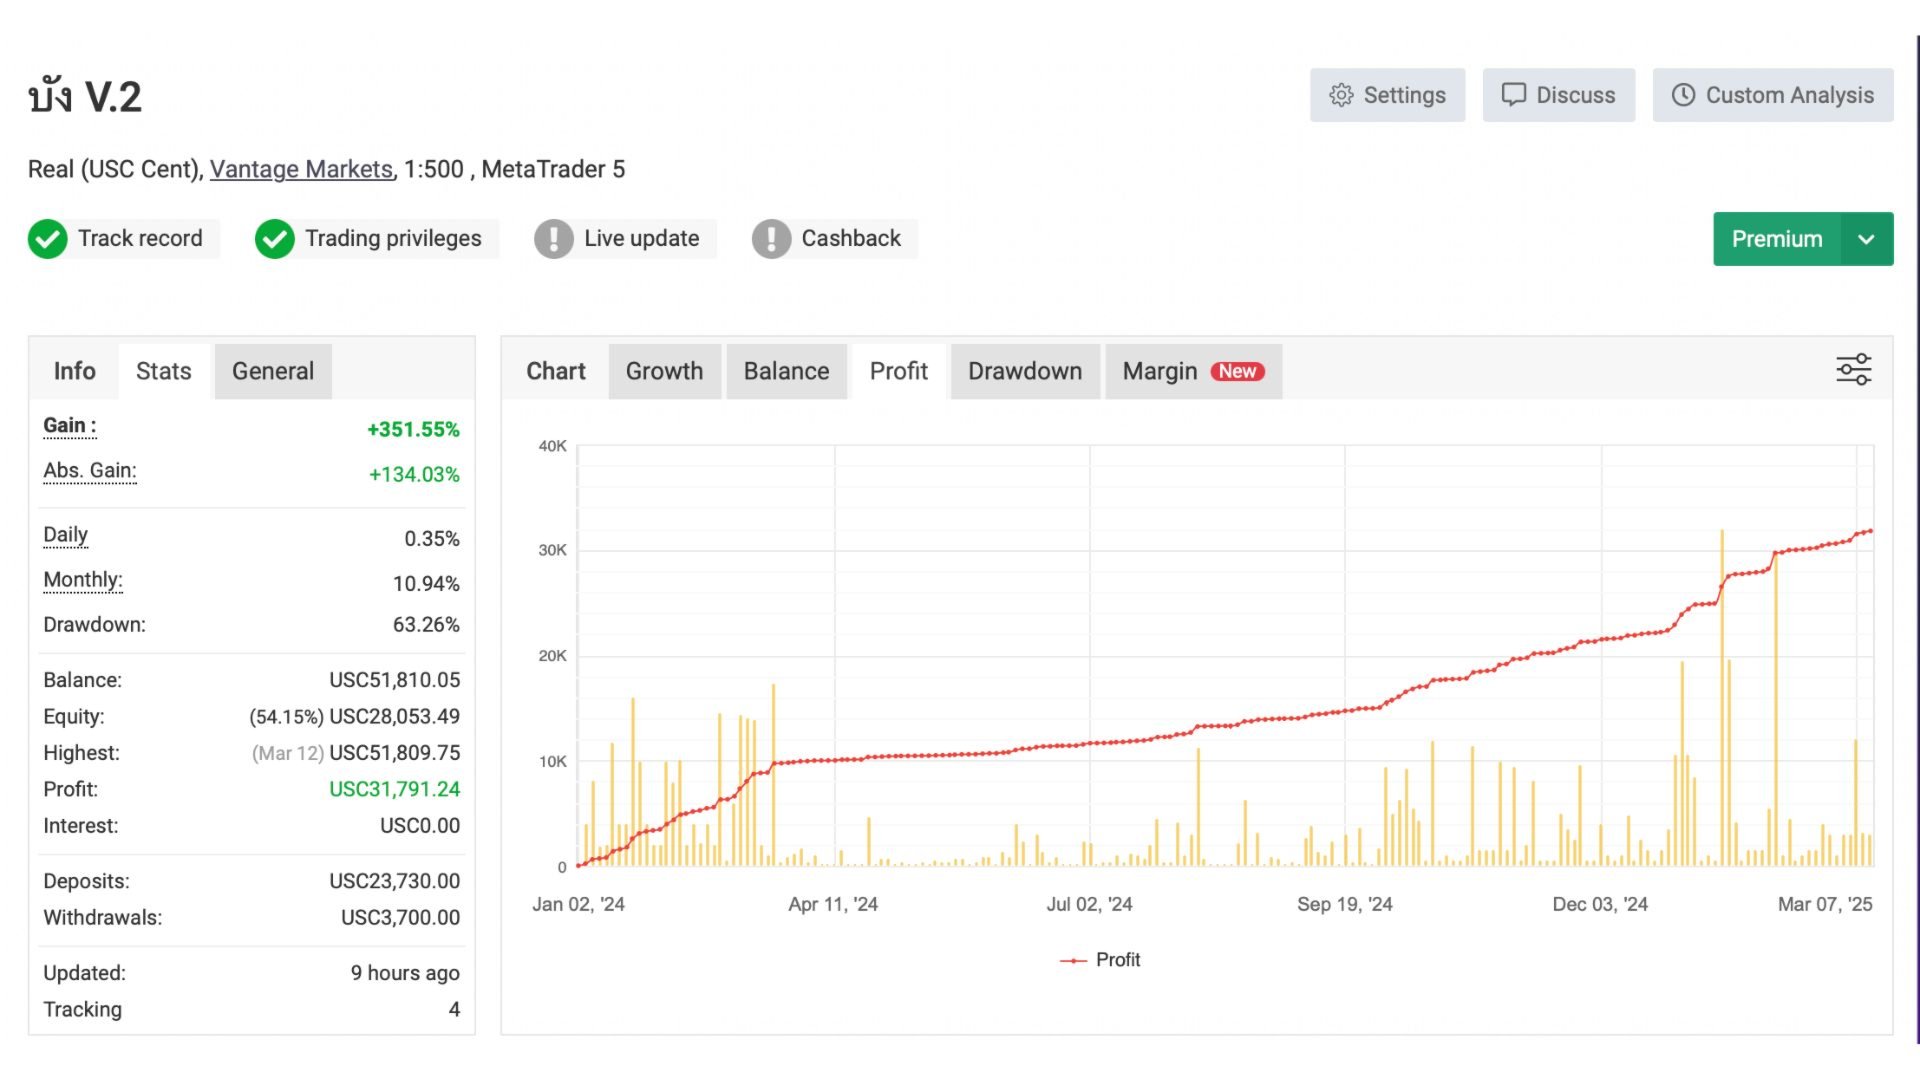
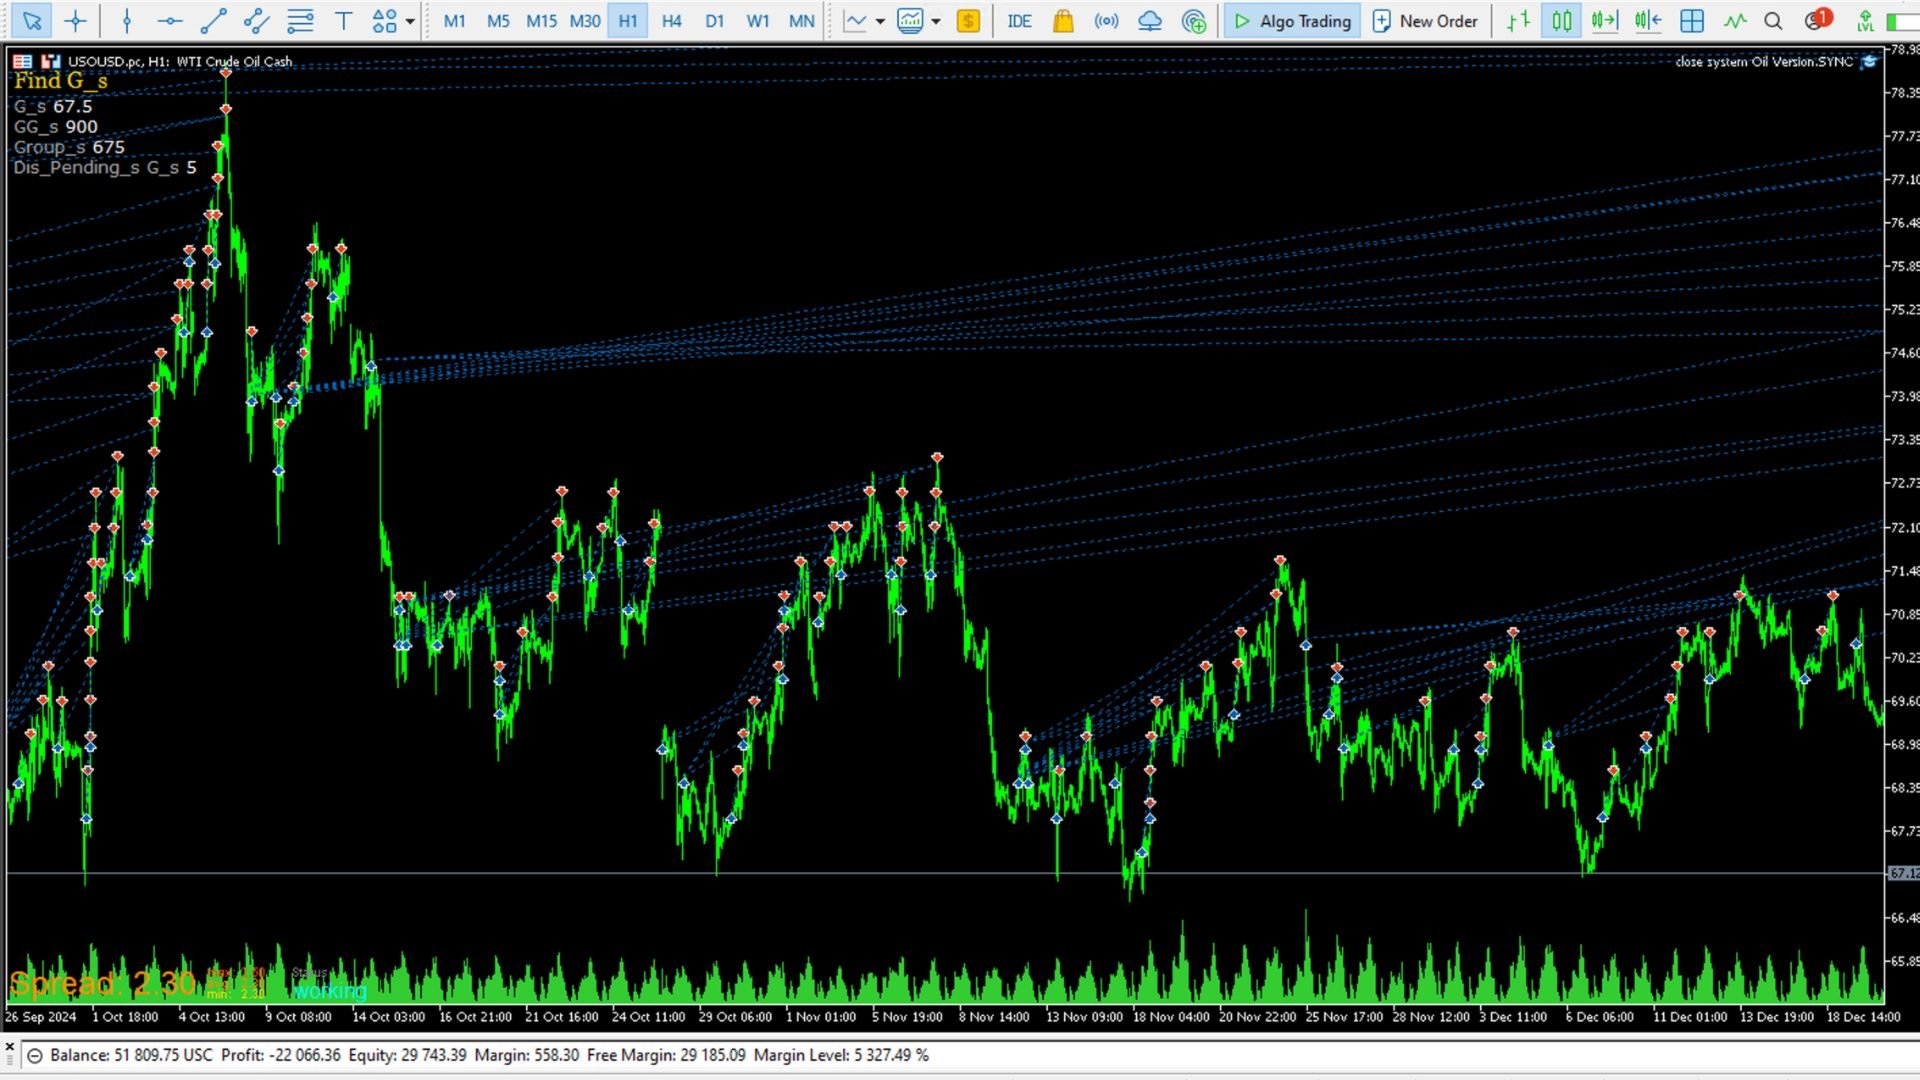
This proposal is designed to offer investors a robust and sustainable portfolio growth strategy throughDynamic Grid TradinginUSOUSD(Crude Oil) within theCFD market. The strategy emphasizesconsistent returnsby leveragingVolatility-Based Profit Capture, ensuring adaptability in varying market conditions. The methodology has been rigorously tested and validated with real account performance, showcasing its ability to generate stable returns while maintaining effective risk management. (View Live Performance)
⚠️Risk Disclaimer:Investing involves risks. Investors should carefully study all relevant information before making any financial commitments. Past performance does not guarantee future results. Market volatility, asset fluctuations, or broker policy changes may impact performance.
🌟Trading Strategy Overview
🏦Key Information
-
Market:CFD (Contract for Difference)
-
Instrument:USOUSD (Crude Oil)
-
Contract Size:1,000 barrels per contract
-
Trading Timeframe:Unrestricted, as the grid adapts dynamically to price levels
-
Trading Frequency:An average of 45 orders per month, ensuring steady return potential
-
Analytical Approach:Quantitative analysis for optimized trade positioning
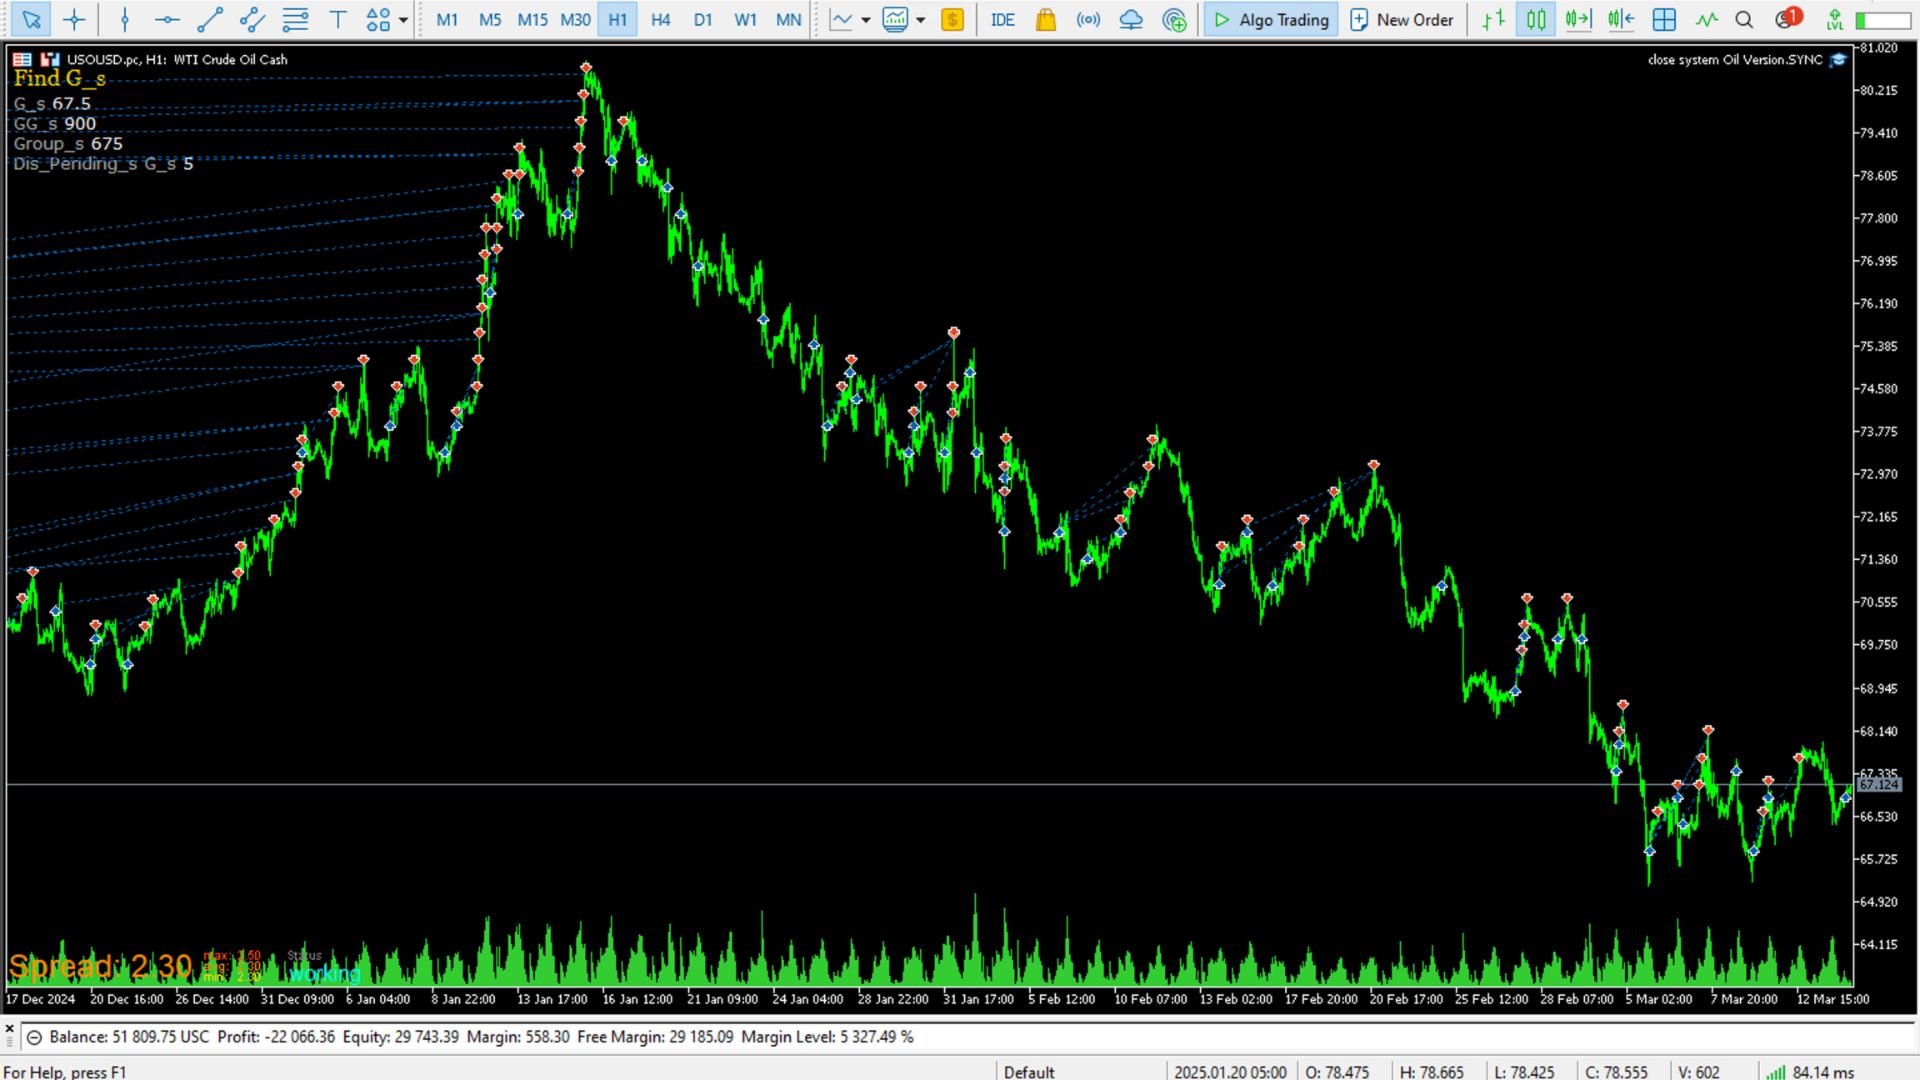
⚙️Trade Execution Strategy
-
Entry Strategy:
-
Placement ofBuy Stoporders at levels expected to confirm market reversals
-
Dynamic Grid Adjustmentsbased on market volatility to enhance risk mitigation
-
Incorporation of deep market trend analysis and asset correlation studies
-
-
Exit Strategy:
-
Take Profitlevels are determined based on volatility-driven grid structures
-
Active Zone:Maintained between$60 and $95 per barrel
-
Utilization ofTrend Strength Indicatorsfor optimal exit points
-
💰Capital Management Strategy
-
Initial Capital:$10,000
-
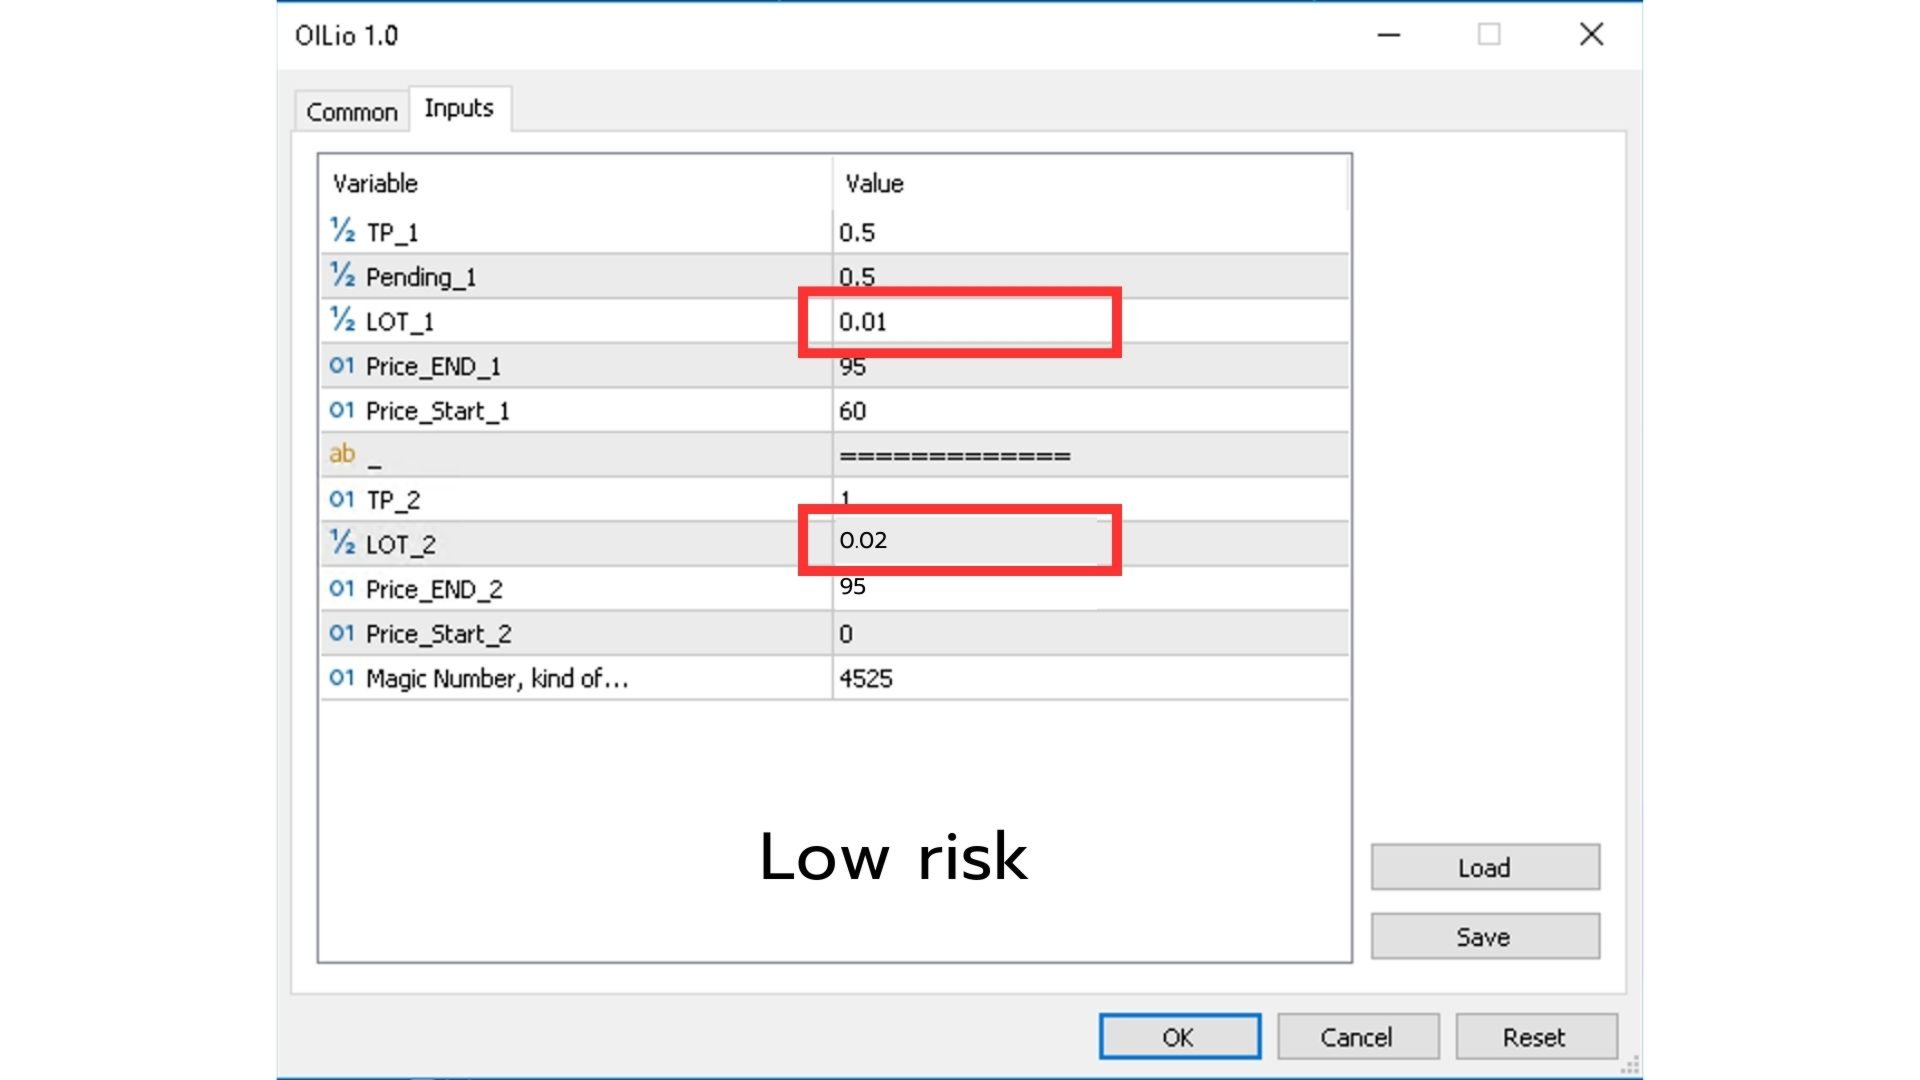
Lot Sizing:
-
0.01 lot per$0.5 price movement
-
0.02 lot per$1 price movement
-
-
Execution Model:Fixed Lot Grid System withReal-Time Risk Calculations
📊Risk Management Framework
📉Risk Assessment & Calculation
Low risk
-
Active Trading Zone:$60 - $95 per barrel (35 USD range)
-
Risk Per Grid Level:
-
0.01 lot:$10 per grid movement
-
0.02 lot:$50 per grid movement
-
-
Maximum Exposure:$1,250 (12.25% of total capital)
-
Maximum Acceptable Drawdown:30%
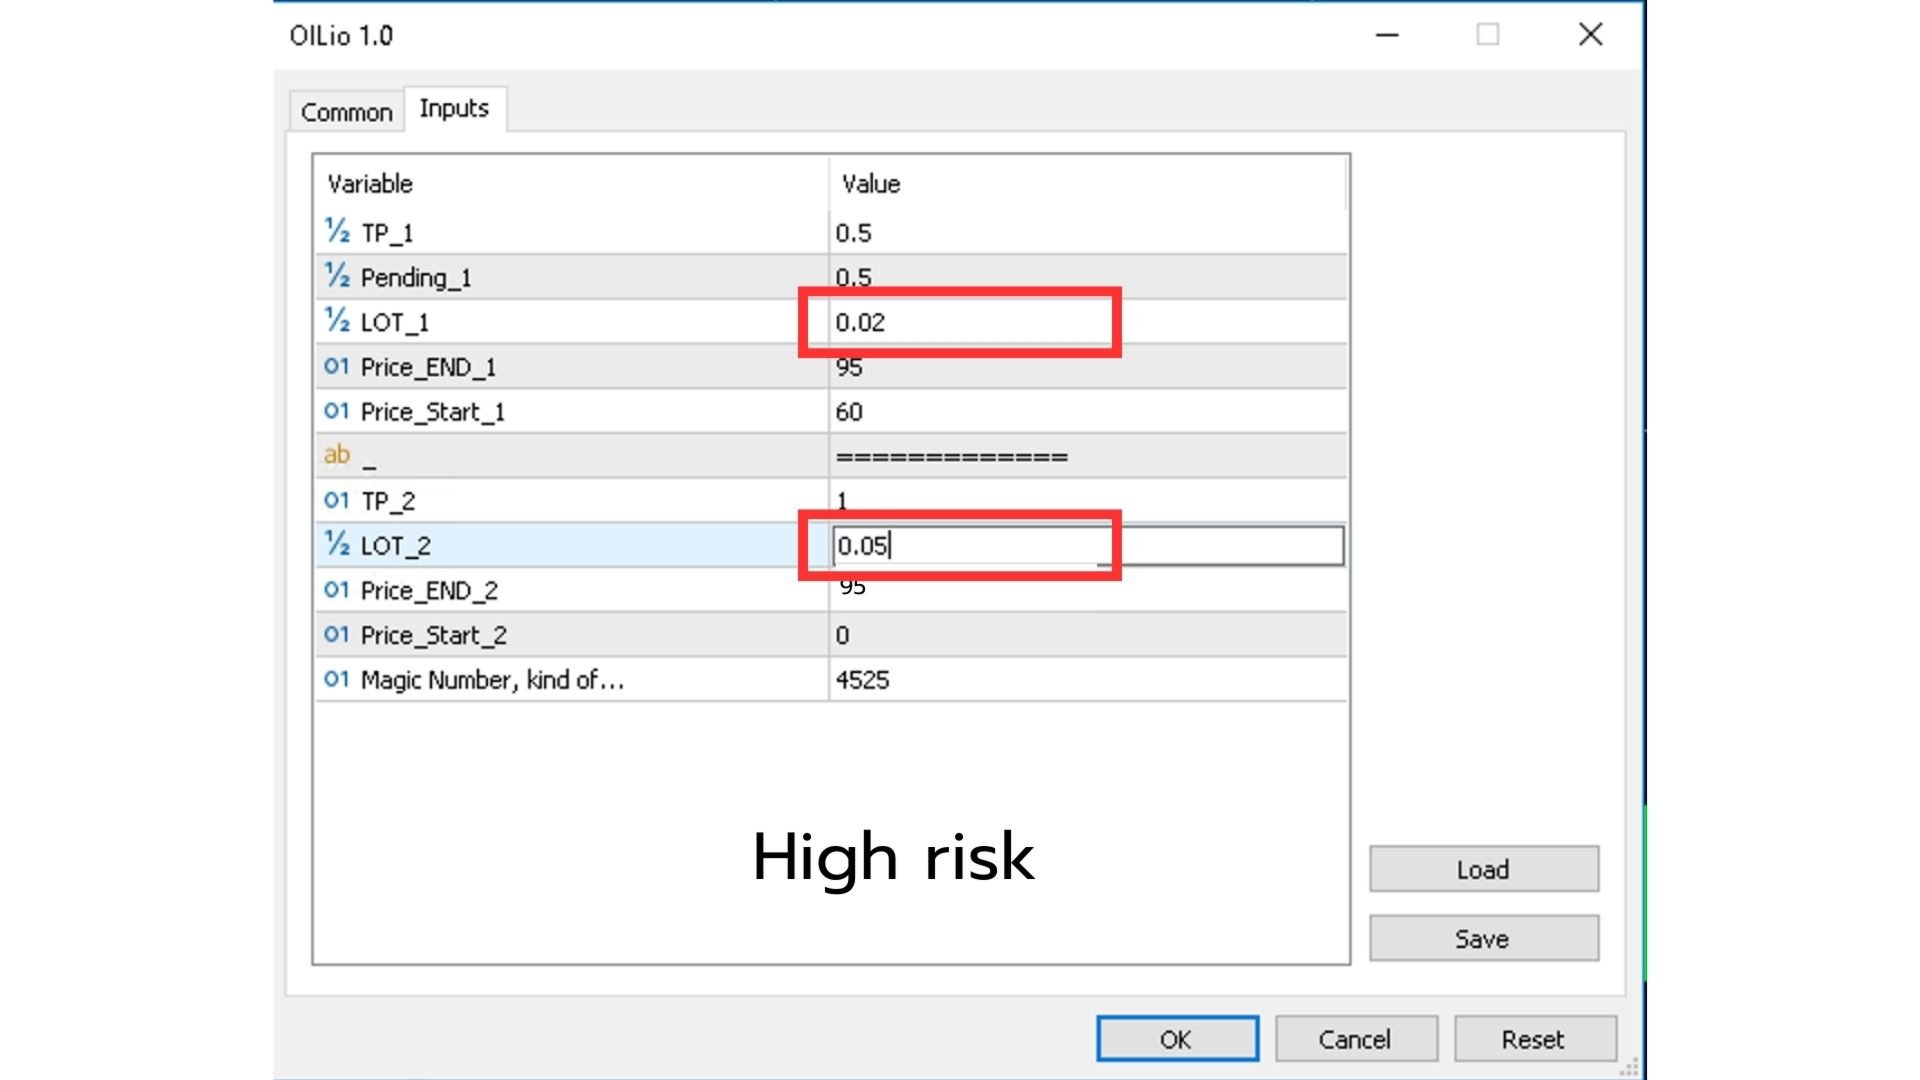
High risk
-
Active Trading Zone:$60 - $95 per barrel (35 USD range)
-
Risk Per Grid Level:
-
0.02 lot:$10 per grid movement
-
0.05 lot:$50 per grid movement
-
-
Maximum Exposure:$2,450 (24.5% of total capital)
-
Maximum Acceptable Drawdown:60%
-
Risk Customization:Adjustable based on market conditions and investor preferences
✅Note:Risk parameters are derived from live trading data to ensure realistic assessment and transparency.
🤖Automated Trading System (Expert Advisor - EA)
-
Technology:Developed inMQL5
-
Core Features:
-
Always-active order placements (Persistent Grid Orders)
-
AdaptiveVolatility-Based Grid Adjustments
-
High-Volatility Protection Mechanismto mitigate extreme market movements
-
-
Performance Optimization:
-
IncorporatesOpen Interest (OI) Analysisfor enhanced market alignment
-
Real-time adjustments based on live account data for precise execution
-
⚠️Warning:Market volatility and broker policy changes may require strategy adaptation to mitigate unforeseen risks.
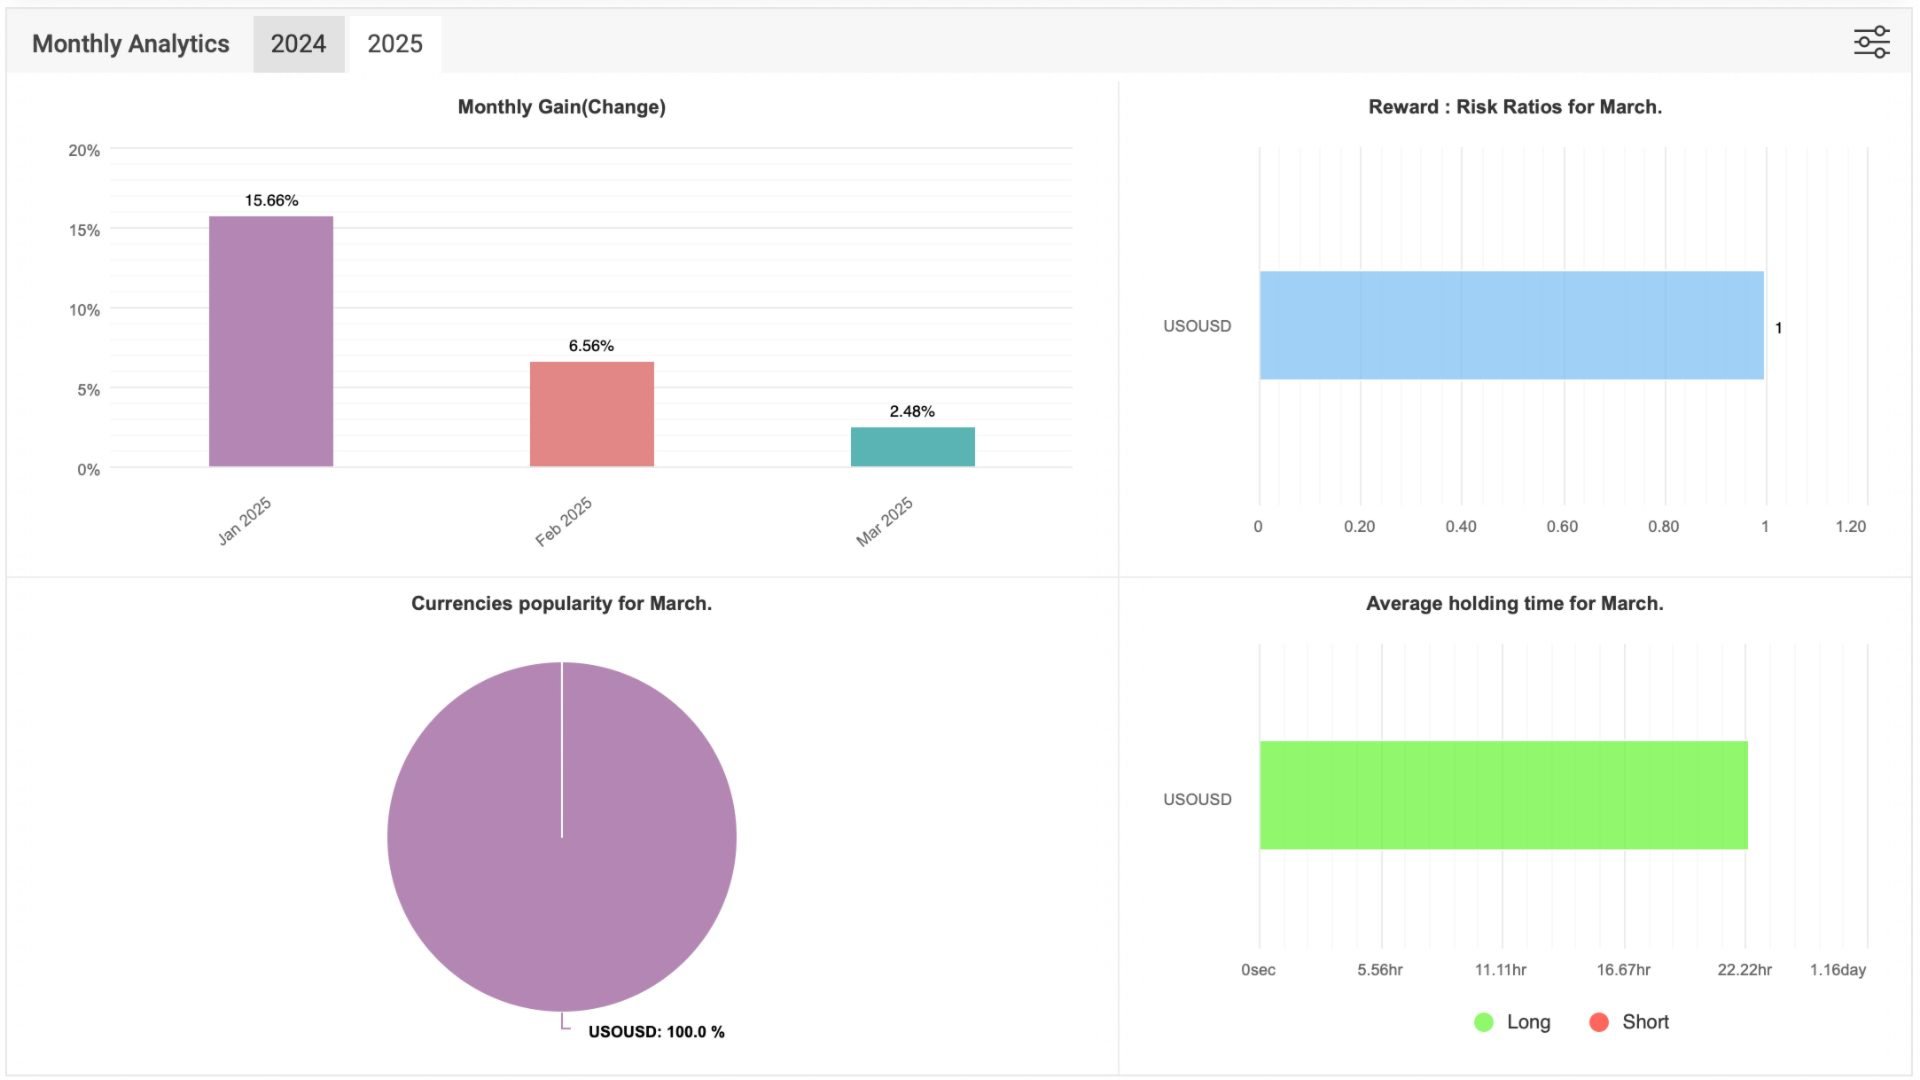
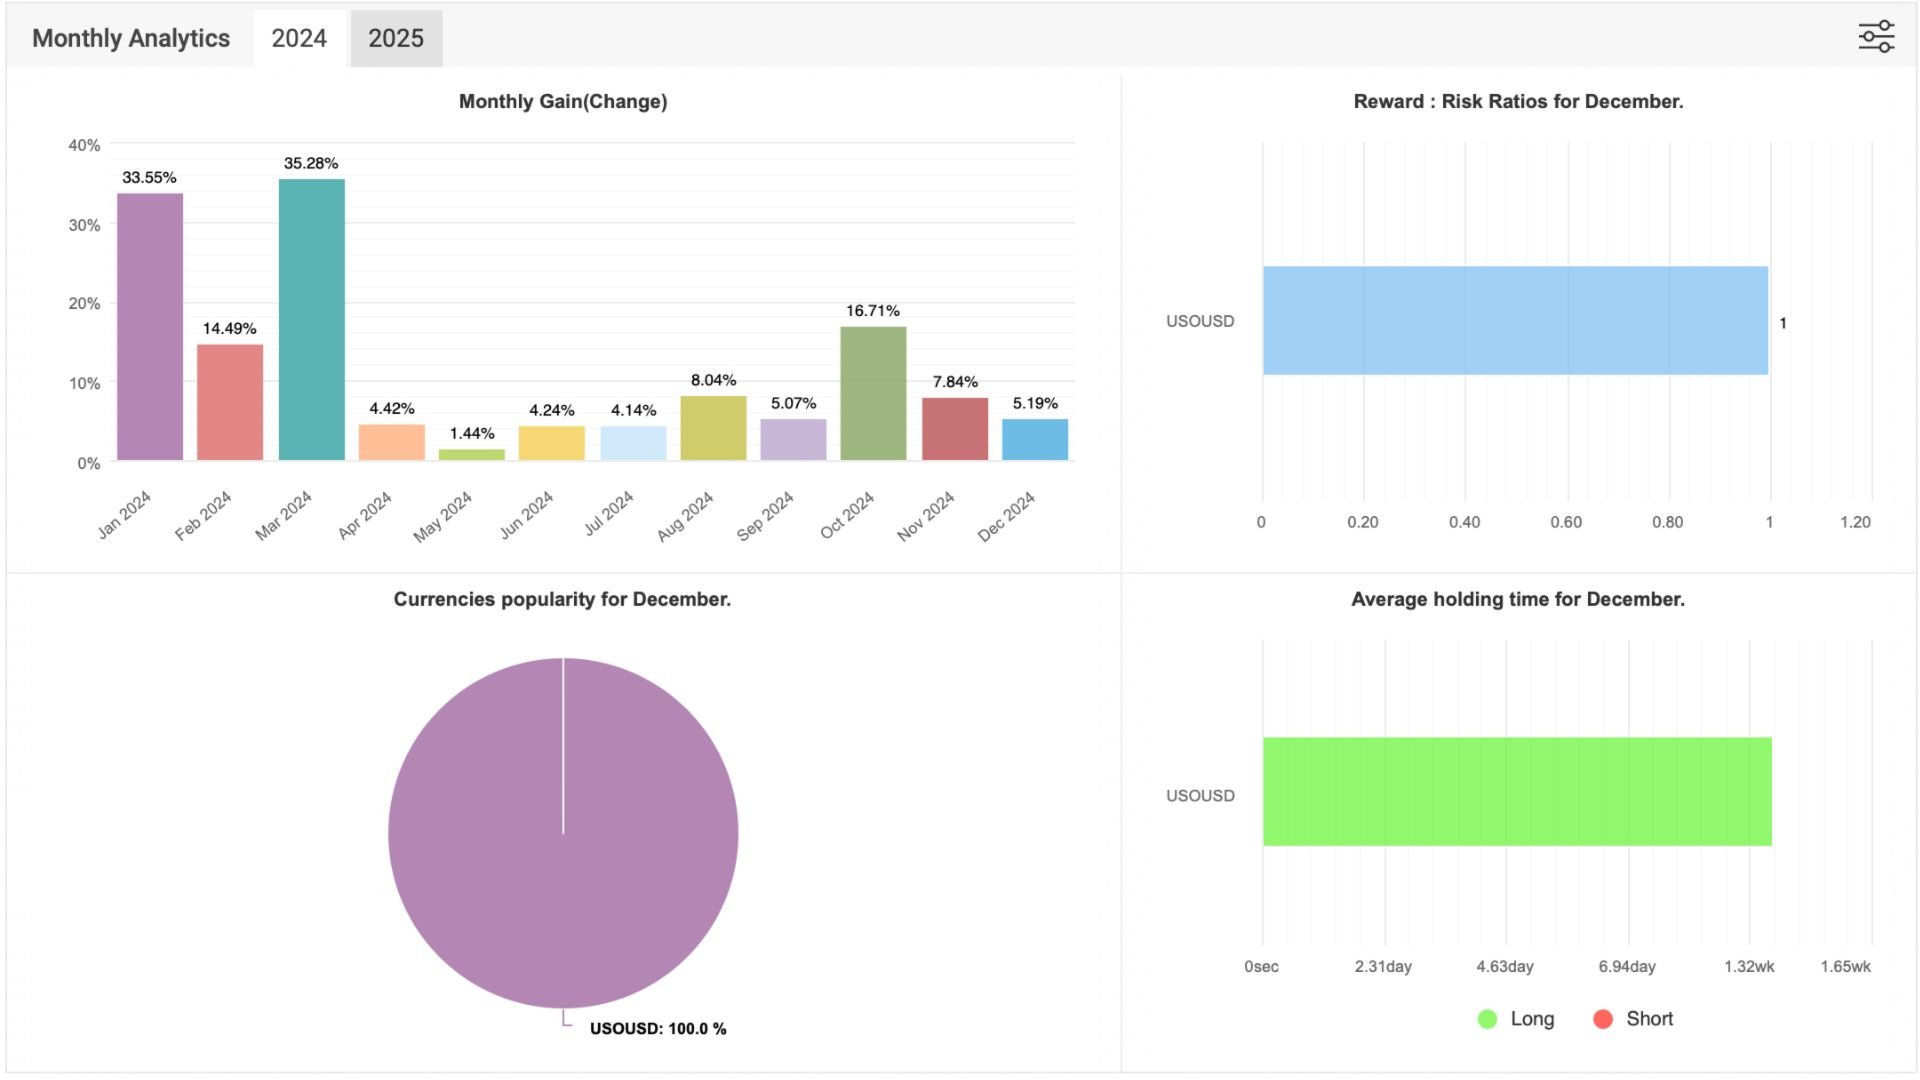
📈Performance Metrics & Historical Results
-
Win Rate:100% (verified live account results)
-
Average Annual Return:22%
-
Lowest Recorded Drawdown:2.8%
-
Average Monthly Trades:45 orders
-
Average Profit Per Order:1.8%
-
Market Volatility Metrics:Fully aligned with predefined risk models
-
Verified Performance:
🌐Competitive Advantages
-
Dynamic Grid Adjustments:Enhances profit potential while minimizing market impact
-
Proven 100% Win Rate:Verified throughreal accountperformance tracking
-
Continuous Order Execution:Captures opportunities through always-active market exposure
-
Flexible Risk Management:Supports up to60% Drawdownwhile maintaining controlled exposure
-
AI-Driven Market Adaptation:Uses Open Interest and quantitative analysis for enhanced precision
🎯Financial Targets & ROI
-
Expected Annual Return:20-25% with strategic volatility-adjusted modifications
-
Maximum Acceptable Drawdown:60% with risk mitigation mechanisms
-
Target ROI Timeline:12 months based on historical performance projections
💬Conclusion & Risk Advisory
🏦Risk Warning:Investing in financial markets carries inherent risks. Investors may experience partial or total capital loss. Past performance is not indicative of future returns. Market conditions, asset fluctuations, and broker policy shifts can significantly influence results.
This strategy is ideal for investors who seekconsistent returnswith a provenDynamic Grid Tradingsystem that has been tested and optimized under real market conditions. Backed by cutting-edge automation and data-driven risk controls, this strategy ensures confidence in every market cycle.
💡Contact us today for further insights and investment opportunities in a strategy that delivers real results!✅