• Overview
  • Reviews
  • Comments

Smart Trend Detector MT5

Market Trend Levels Detector

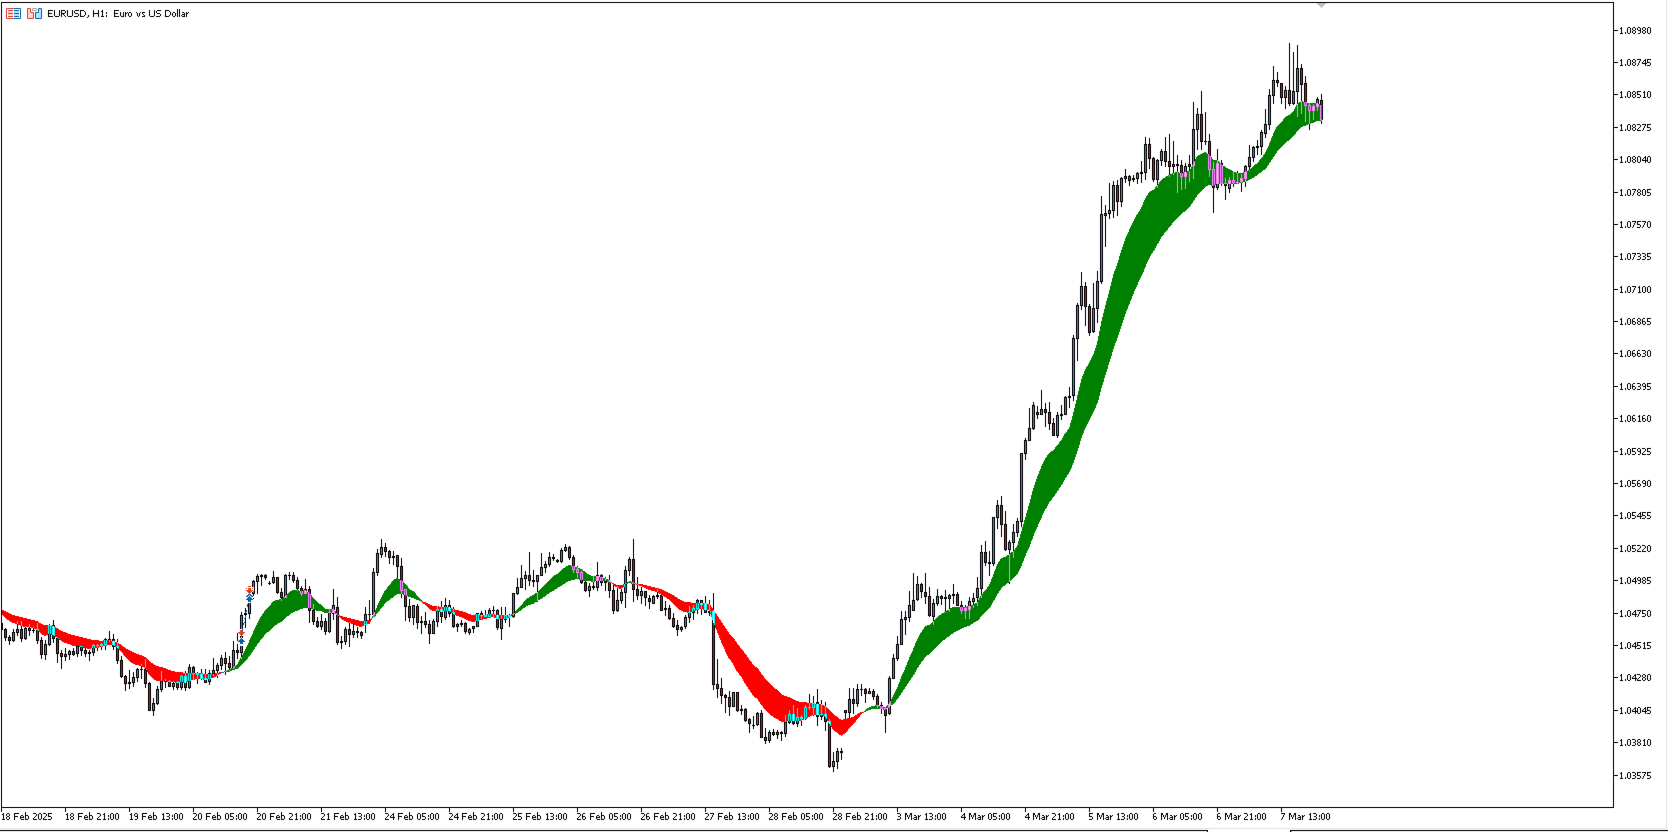
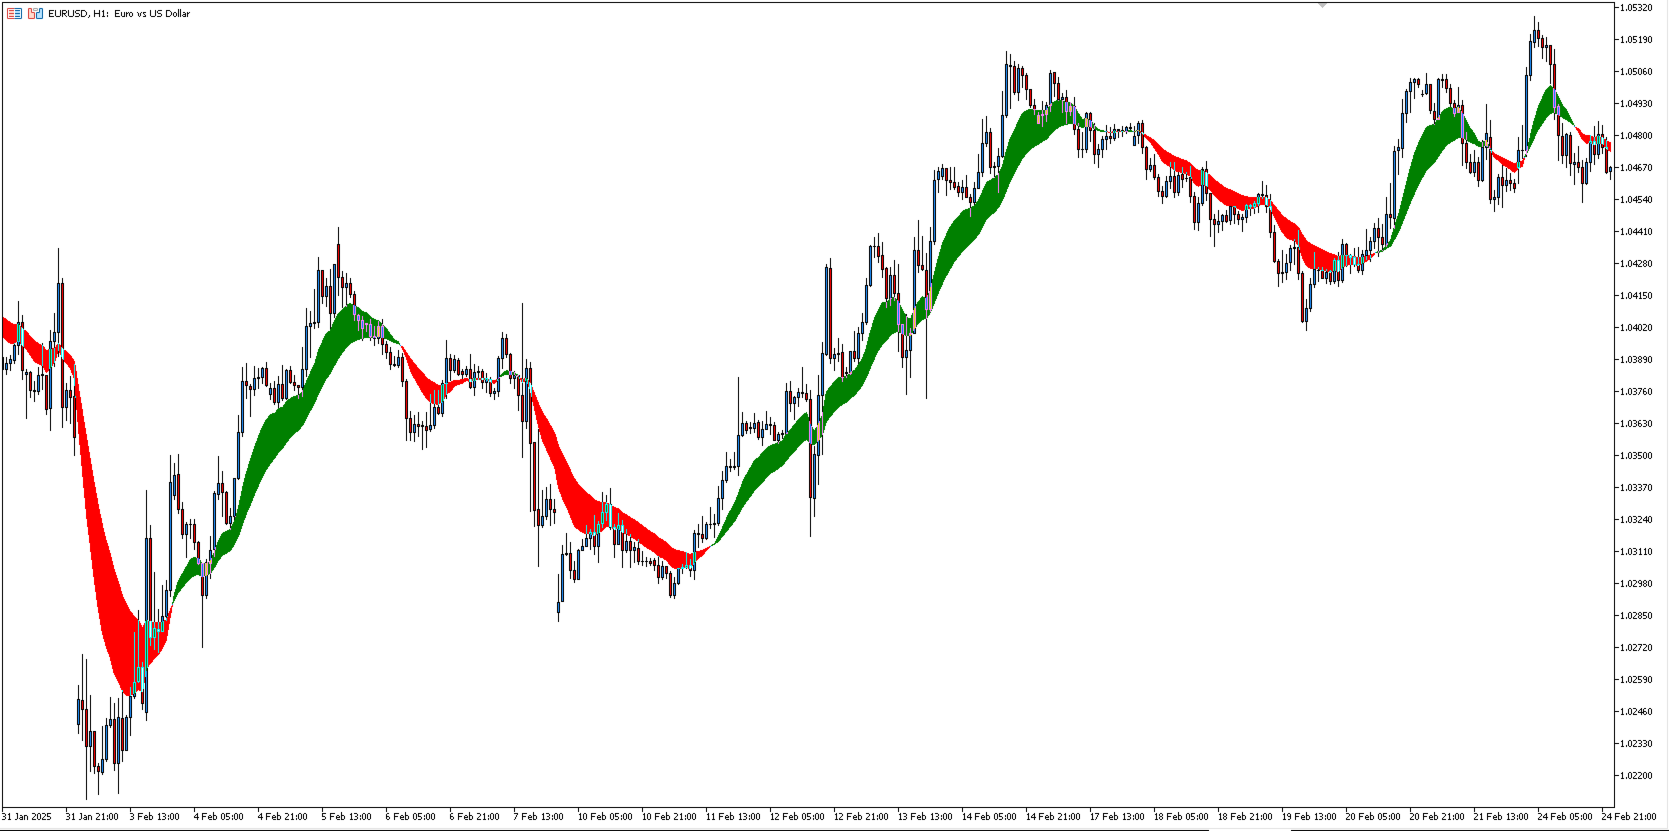
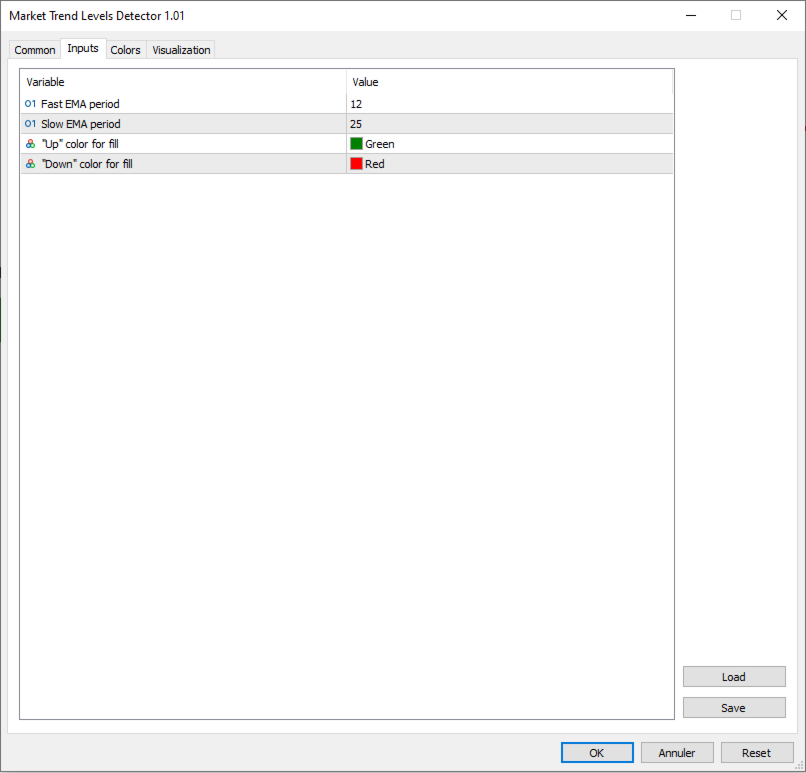
The Market Trend Levels Detector is an MQL5 indicator designed to help traders visualize dynamic market trends and potential reversal points. It operates by calculating two exponential moving averages (EMAs)—a fast EMA and a slow EMA—to assess the current trend direction. Key features include:

  • Dynamic Trend Fill:
    The area between the fast and slow EMAs is filled with different colors depending on the market regime. When the fast EMA is above the slow EMA (suggesting bullish momentum), one color (e.g., green) is used, and when it is below (indicating bearish momentum), another color (e.g., red) is applied.

  • Alert Functionality:
    The indicator is equipped with an alert system that notifies the trader when a new (recent) crossover occurs. This ensures that you receive a notification only for the latest signal, reducing noise from multiple alerts on the same event.

  • Customization:
    Users can customize key inputs such as the periods for the fast and slow EMAs as well as the fill colors, making the tool adaptable to various trading styles and market conditions.

Overall, the Market Trend Levels Detector serves as a visual aid to highlight support/resistance areas and trend changes, helping traders to make more informed decisions by identifying dynamic levels in the market.


Recommended products
MasterCharts
Alexander Berger
You can think of these indicators as moving pivot points. MasterChartsTrading Price Action Indicators show good price levels to enter or exit a trade. The Blue indicator line serves as a Bullish Trend setter. If your instrument closes above the Blue line, we think about going Long (buying). When your trading instrument closes below the Red line, we think about Shorting (selling). It is very easy to read price action if you have a reference point. These support/resistance lines are there to help
A top and bottom indicator that can intuitively identify the trend of the band. It is the best choice for manual trading, without redrawing or drifting. Price increase of $20 every 3 days, price increase process: 79-->   99 --> 119...... Up to a target price of $1000. For any novice and programming trading friend, you can write the signal into the EA to play freely. Array 3 and array 4, for example, 3>4 turns green, 3<4 turns red. If you don't understand, please contact me. ====================P
High And Low MT5
Dmitriy Parfenovich
On the current chart, this indicator displays candlestick highs and lows of another time frame. Input Parameters: TimeFrame - chart time frame whose data will be displayed on the current price chart (by default, H12). Time Zone - shift of the indicator by time zone relative to the broker's time (by default, Broker-1). If the broker's time zone is UTC+1 and the Time Zone parameter is set to Broker-1, the bends of the indicator will be plotted in multiples of Greenwich Time. Indicator buffer value
A lot of professional traders use high quality divergence signals as a part of their strategy to enter a position. Spotting correct divergences quickly can often be hard, especially if your eye isn’t trained for it yet. For this reason we’ve created a series of easy to use professional oscillator divergence indicators that are very customisable so you get only the signals you want to trade. We have this divergence indicator for RSI, MACD, Stochastics, CCI and OBV. RSI:   https://www.mql5.com/en/
FIBO Trend PRO mt5
Evgenii Aksenov
4.5 (8)
The indicator allows you to instantly determine the current trend by color and FIBO levels. Higher Timeframe the panel shows the current trend of higher periods, helping to determine the strength of the trend. Trade according to the trend when changing the color of candles or trade against the trend when the price hit the extreme levels of the FIBO Trend PRO  indicator   Advantages of the FIBO Trend PRO Indicator never repaint and does not change their values Very easy to use and intuitive Appl
FREE
The indicator ‘Probability Range Bands’ gives a prediction of the amount, how much the asset is moving from its current price. The range bands give probabilities, that the candle close will not exceed this certain price level. It is also called the expected move for the current candle close.   This Indicator is based on statistical methods, probabilities and volatility. Asset price is assumed to follow a log-normal distribution. Therefore, log returns are used in this indicator to determine the
Visual Dragon Cloud Indicator
AL MOOSAWI ABDULLAH JAFFER BAQER
The Visual Dragon Cloud Indicator is a powerful and unique tool designed to provide traders with deep insights into market behavior. Priced at $65, it offers a robust framework for understanding price dynamics through its sophisticated strategy, while allowing users to optimize and customize it to fit their unique trading styles. Please note: this indicator is not optimized and is intentionally crafted for you to fine-tune it for your personal trading approach. Strategy and Logic Behind the Ind
BoS CHoCH Indicator
Usiola Oluwadamilol Olagundoye
The Expert Advisor for this Indicator can be found here: https://www.mql5.com/en/market/product/115445 The Break of Structure (BoS) and Change of Character indicator is a powerful tool designed to identify key turning points in price movements on financial charts. By analyzing price action, this indicator highlights instances where the market shifts from a trend to a potential reversal or consolidation phase. Utilizing sophisticated algorithms, the indicator identifies breakouts where the stru
Multi Andrew PitchFork 5
Kourosh Hossein Davallou
Multi Andrew PitchFork   ANDREW’S PITCHFORK TRADING STRATEGY       Essentially, Andrew’s Pitchfork is a tool for drawing price channels. While two lines surrounding price are usually enough to draw a channel, the Pitchfork has an extra line. It is the median line or the handle of the Pitchfork.     The median line is central to this trading method. This is why Andrew’s Pitchfork is also known as the Median Line Method. TRADING RULES      There are many ways to trade using Andrew’s Pitchfork but
Brekaut
Kwuemeka Kingsle Anyanwu
Brekaut, a powerful and intuitive trading indicator designed to take your trading experience to the next level. Built to simplify market analysis and provide timely insights, Brekaut offers traders a reliable way to identify key breakout opportunities across various asset classes, including stocks, forex, and cryptocurrencies. Brekaut cuts through the noise by highlighting potential breakout points where the market is poised for strong movement. This allows traders to make informed decisions a
FREE
ABC Trend Levels MT5
Oleksandr Novosiadlyi
Description ABC Trend Levels  is an indicator that identifies market trends and important trend support and resistance levels. Recommendations You can use this indicator to determine the trend and, accordingly, to determine the direction of opening a position or closing an opposite position. Parameters ===== _INDICATOR_SETTINGS_ =====  - indicator settings Maximum History Bars  - maximum number of history bars for calculating the indicator. Average True Range Period  - ATR indicator period
The First Red MT5
Krzysztof Janusz Stankiewic
1. Introduction The “First Red” Indicator is a tool designed to pinpoint dynamic market turning points by combining local price extremes with signals from the MACD (Moving Average Convergence Divergence) oscillator. Based on Dariusz Dargo’s original concept, it marks specific candles on your chart that meet the conditions of the “First Red” setup or its related variants—“Second Red,” “First Green,” and “Second Green.” These classifications let traders see at a glance when momentum may be shifti
Fibonacci Arcs in the full circles are based on the previous day's candle (High - Low). These arcs intersect the base line at the 23.6%, 38.2%, 50%, 61.8%, and 78.6%. Fibonacci arcs represent areas of potential support and resistance.  Reference point - the closing price of the previous day. These circles will stay still all day long until the beginning of the new trading day when the indicator will automatically build a new set of the Fibonacci Arcs.
Moving pivot Average Fibonacci The  indicator compares the selected period with its counterpart from the previous period. The indicator determines the moving Fibonacci levels for the day or any time interval to assess the price movement range from the time average. The indicator helps predict the expected high or low for the day based on historical time data. The pivot line can be considered an average trend line and use it in a variety of trading strategies. If you have any question about the
Signal Eskiya, in addition to channel lines, reflects entry signals in the form of arrows. Trading strategies using the channel indicator belong to the classic methods of technical analysis, are easy to execute, and therefore available even to beginners. Price ranges work equally well on any trading assets and timeframes, they can be used both independently and with additional confirmation from oscillators and market volumes. American traders say: “Trend is your friend”, which means “Trend is
Marcon s Deviation
Luiz Antonio De Sousa Marcon
DESVIO DE MARCON  (Desvio Dinâmico de VWAP) O Desvio de Marcon é um indicador desenvolvido com o intuito de fornecer ao TRADER uma ferramenta capaz de antecipar pontos relevantes de suporte e resistência através de canais de desvios de VWAP traçados no gráfico.  Mas qual a diferença entre o Desvio de Marcon e os canais de desvio padrão da VWAP já existentes? O Desvio de Marcon utiliza um algoritmo estatístico desenvolvido por Luiz Antonio de Sousa Marcon, que lhe dá a capacidade de se auto calib
Halley´s comet   it is a Secure Automated Software for trade Forex market and indices. The architecture is a Fully Automatic Autonomous Robot Expert capable of Independently analyzing the market and making trading decisions  Halley´s comet             It is an advanced trading system. This is a fully automatic Expert Advisor.     Halley´s comet   . It is a 100% automatic system,  The system is self-sufficient, performing all the work.     Is a revolution in the  customization of the trading.
RSI Trend V1
Suleiman Alhawamdah
"RSI Trend V" Indicator is designed for trend identification and is integrated with Fibonacci to determine target zones and potential reversals. It includes bullish and bearish arrows that appear in potential price movement reversal areas. However, the key elements to focus on are: -Thick blue line - Uptrend -Thick yellow line - Downtrend -Green cloud above the thick green line -Red cloud below the thick yellow line -Bullish and bearish arrows Important Note:   "Some of the images" shown in the
TRACKINGLEVELS (SUPPORTS AND RESISTANCES) TrackingLevels is a useful indicator that saves considerable time when a trader starts analyzing a chart. This indicator draw on the chart all the resistances and supports that the market is creating. The resistance and support levels are very important, this levels define areas where there can be a considerable accumulation of sell or buy orders. These are a key areas that every trader must know and keep in mind all the time. This indicator helps the t
Trading Hours indicator draws the frames which represents opening and closing hours of concrete exchange in a chart. Inputs: The input parameter `UTC time zone shift` sets the user's time zone shift from the UTC, The other parameters are used for showing or hiding the frames, or setting the color.   Features: Draws the frames which represents opening and closing hours of concrete exchange in a chart, Shows/hide frames for selected exchange, Sets the color for selected exchange, Supports 17 larg
Highest High and Lowest Low (HH_LL) Indicator Description: The HH_LL Indicator is a trading tool designed to help traders identify key market points by automatically drawing Higher High (HH) and Lower Low (LL) lines across multiple timeframes. This indicator allows traders to easily spot significant levels on the chart, facilitating more accurate trading decisions. Key Features: Multi-Timeframe Analysis: The indicator supports various timeframes, including M30, H1, and H4. This enables traders t
FREE
Bandas Bolinger Profesional
Ignacio Agustin Mene Franco
Bolinger Professional Bands, Last indicator of the Safari Pack. in this last indicator we find a unique programming of bolinger bands where you can better catch the rebounds on the bands above and below, works for forex currency markets! synthetic index markets and also crypto! It works in all temporalities and all pairs! Good profit! World Inversor!!!!!
Product Description: Adaptive Y-Axis Scaling is a powerful MT5 indicator designed to enhance your trading experience by providing precise control over the Y-axis (price) scaling of your charts. This innovative tool allows you to customize the price scaling by specifying the number of pips from the visible chart's highs and lows. The calculated price range from this input is then used to set the maximum and minimum prices for the open chart, ensuring an optimized and comprehensive view of market
FREE
Unlock the Power of Trend Dynamics with ATR Bands Midline Trend Indicator The ATR Bands Midline Trend Indicator is a meticulously crafted tool designed to help traders identify trends with precision using the Average True Range (ATR) as a foundation. This indicator focuses on calculating a midline derived from ATR bands, providing a unique perspective for traders to detect trend direction and strength effectively. Important: This indicator is not optimized, leaving the door open for you to tail
Update 2.2: Added MFI with predictive mod. Updated all indicators to reflect similar values, to combine multiple ones to rest well on overbought/oversold lines. Update 2.3: Minor bug fixes. Update 2.4: Removed buggy indicators DeMarker, and MACD, as it was too complicated and not as accurate as the rest due to it's nature. Added Awesome Oscillator. removed spreads, as it bogged the indicator down. Added other features, like indicator value compensators to match each other's levels when combined.
Contact me for instruction, any questions! Introduction The Elliott Wave in technical analysis describes price movements in the financial market that are related to changes in trader sentiment and psychology. The 5 W Pattern (Known as 3 Drives) is an Elliott Wave pattern that is formed by 5 consecutive symmetrical moves up or down. In its bullish form, the market is making 5 drives to a bottom before an uptrend forms. In a bearish 5-drive, it is peaking before the bears take over.  5W Pattern
Indicator Description This indicator displays the highest and lowest prices for the previous day, week, and month. Additionally, it shows pivot levels calculated using different methods: Standard, Fibonacci, Woodie, Camarilla, and Floor pivots. Features: Previous Day High/Low: Indicates the highest and lowest prices of the previous trading day. Previous Week High/Low: Indicates the highest and lowest prices of the previous trading week. Previous Month High/Low: Indicates the highest and lowest p
First Dawn MT5
Innovicient Limited
The First Dawn indicator uses a unique mechanism to search and plot signals. This keeps searching for signals, making it a great indicator for scaping and identification of changes in direction, swing trading and trend trading. The    First Dawn     helps you get early signals. The backtest gives the true picture of how the indicator works with real/demo accounts. Although this is a tiny indicator it is packed with advantageous settings that will help you whether you desire to: Snap the Peaks a
What is a wick in trading? How Does this Screener work? A wick in a candlestick reflects a rejection in the price. This Screener is trying to identify wicks with great potential to be filled. This Screener is focused on the wicks that happen in the trend market.  The Screener displays a dashboard that offers an overall view of the potential wicks traded live. It shows ALL the pairs/instruments organize by timeframe. Buys opportunities are named "UP-W.’’ They appear green on the dashboard, and t
The TMA Centered Bands Indicator for MT5 draws bands on the chart and shows the overall price trend. It displays three bands - the lower and upper boundaries of the channel and the median.   The bands are made up of moving averages, and each of them has an MA period. The name TMA comes from triangular moving averages, as the indicator draws triangular bands.   The price will fluctuate between these ranges whenever the trend changes direction, thus creating entry and exit points.   How to trade
FREE
Buyers of this product also purchase
Trend Screener Pro MT5
STE S.S.COMPANY
4.85 (79)
Unlock the Power of Trends Trading with the Trend Screener Indicator: Your Ultimate Trend Trading Solution powered by Fuzzy Logic and Multi-Currencies System! Elevate your trading game with the Trend Screener, the revolutionary trend indicator designed to transform your Metatrader into a powerful Trend Analyzer. This comprehensive tool leverages fuzzy logic and integrates over 13 premium features and three trading strategies, offering unmatched precision and versatility. LIMITED TIME OFFER : Tre
Описание индикатора MONEY Индикатор MONEY предназначен для анализа волатильности и выявления значительных рыночных движений (всплесков). Он использует ATR (Average True Range) для определения момента, когда цена выходит за пределы обычного диапазона, и сигнализирует об этом трейдеру с помощью стрелок на графике. Основные параметры: • Минимальное количество свечей – задает период для анализа всплесков. • Алерты (уведомления) – включение или отключение звуковых и текстовых сигналов. • Период AT
Golden Trend Indicator MT5
Noha Mohamed Fathy Younes Badr
4.88 (17)
Golden Trend indicator  is The best indicator for predicting trend movement this indicator never lags and never repaints and never back paints    and give  arrow buy and sell    before the candle appear  and it will help you and  will make your trading decisions clearer its work on all currencies and  gold and crypto and all time frame This unique  indicator uses very secret algorithms to catch the  trends, so you can trade using this indicator and see the trend clear on charts  manual guide and
Algo Pumping
Ihor Otkydach
5 (4)
PUMPING STATION – Your Personal All-inclusive strategy Introducing PUMPING STATION — a revolutionary Forex indicator that will transform your trading into an exciting and effective activity! This indicator is not just an assistant but a full-fledged trading system with powerful algorithms that will help you start trading more stable! When you purchase this product, you also get FOR FREE: Exclusive Set Files: For automatic setup and maximum performance. Step-by-step video manual: Learn how to tr
FX Power MT5 NG
Daniel Stein
5 (13)
FX Power: Analyze Currency Strength for Smarter Trading Decisions Overview FX Power is your go-to tool for understanding the real strength of currencies and Gold in any market condition. By identifying strong currencies to buy and weak ones to sell, FX Power simplifies trading decisions and uncovers high-probability opportunities. Whether you’re looking to follow trends or anticipate reversals using extreme delta values, this tool adapts seamlessly to your trading style. Don’t just trade—trade
Grabber System MT5
Ihor Otkydach
5 (5)
Let me introduce you to an excellent technical indicator – Grabber, which works as a ready-to-use "All-Inclusive" trading strategy. Within a single code, it integrates powerful tools for technical market analysis, trading signals (arrows), alert functions, and push notifications. Every buyer of this indicator also receives the following for free: Grabber Utility for automatic management of open orders Step-by-step video guide: how to install, configure, and trade with the indicator Custom set fi
Support And Resistance Screener Breakthrough unique Solution With All Important levels analyzer and Markets Structures Feature Built Inside One Tool ! Our indicator has been developed by traders for traders and with one Indicator you will find all Imporant market levels with one click. LIMITED TIME OFFER : Support and Resistance Screener Indicator is available for only 50 $ and lifetime. ( Original price 125$ ) (offer extended) The available tools ( Features ) in our Indicator are :  1. HH-LL S
FX Volume MT5
Daniel Stein
4.82 (17)
FX Volume: Experience Genuine Market Sentiment from a Broker’s Perspective Quick Overview Looking to elevate your trading approach? FX Volume provides real-time insights into how retail traders and brokers are positioned—long before delayed reports like the COT. Whether you’re aiming for consistent gains or simply want a deeper edge in the markets, FX Volume helps you spot major imbalances, confirm breakouts, and refine your risk management. Get started now and see how genuine volume data can
FX Levels MT5
Daniel Stein
5 (4)
FX Levels: Exceptionally Accurate Support & Resistance for All Markets Quick Overview Looking for a reliable way to pinpoint support and resistance levels across any market—currencies, indices, stocks, or commodities? FX Levels merges our traditional “Lighthouse” method with a forward-thinking dynamic approach, offering near-universal accuracy. By drawing from real-world broker experience and automated daily plus real-time updates, FX Levels helps you identify reversal points, set profit targe
Gold Stuff mt5
Vasiliy Strukov
4.93 (178)
Gold Stuff mt5 is a trend indicator designed specifically for gold and can also be used on any financial instrument. The indicator does not redraw and does not lag. Recommended time frame H1. Contact me immediately after the purchase to get   personal bonus!  You can get a free copy of our Strong Support and Trend Scanner indicator, please pm. me! Settings  and manual   here  Please note that I do not sell my EA's or special sets on telegram, it is only available on Mql5 and my set files are on
TPSpro RFI Levels MT5
Roman Podpora
4.55 (20)
A key element in trading is zones or levels from which decisions to buy or sell a trading instrument are made. Despite attempts by major players to conceal their presence in the market, they inevitably leave traces. Our task was to learn how to identify these traces and interpret them correctly. ИНСТРУКЦИЯ RUS         INSTRUCTIONS  ENG         R ecommended to use with an indicator   -   TPSpro  TREND PRO -  Version MT4 Bonus: 6 months of  " RFI SIGNALS "  subscription with your purchase! Main f
This dashboard shows the latest available   harmonic patterns   for the selected symbols, so you will save time and be more efficient /   MT4 version . Free Indicator:   Basic Harmonic Pattern Comparison of "Basic Harmonic Pattern" vs. "Basic Harmonic Patterns Dashboard" Indicators Feature Basic Harmonic Pattern Basic Harmonic Patterns Dashboard Functionality Detects and displays harmonic patterns on a single chart Searches multiple symbols and timeframes for harmonic patterns, displays res
TPSproTREND PrO MT5
Roman Podpora
4.72 (18)
VERSION MT4        —        ИНСТРУКЦИЯ RUS           —        INSTRUCTIONS  ENG Main functions: Accurate entry signals WITHOUT REPAINTING! Once a signal appears, it remains valid! This is a significant distinction from repainting indicators that might provide a signal and then alter it, potentially leading to deposit losses. Now, you can enter the market with higher probability and precision. There's also a function to color candles after an arrow appears until the target (take profit) is reac
IX Power MT5
Daniel Stein
4.86 (7)
IX Power: Unlock Market Insights for Indices, Commodities, Cryptos, and Forex Overview IX Power is a versatile tool designed to analyze the strength of indices, commodities, cryptocurrencies, and forex symbols. While FX Power offers the highest precision for forex pairs by leveraging all available currency pair data, IX Power focuses exclusively on the underlying symbol’s market data. This makes IX Power an excellent choice for non-forex markets and a reliable option for forex charts when deta
Matrix Arrow Indicator MT5
Juvenille Emperor Limited
5 (13)
Matrix Arrow Indicator MT5  is a unique 10 in 1 trend following   100% non-repainting  multi-timeframe indicator that can be used on all symbols/instruments:   forex,   commodities,   cryptocurrencies,   indices,   stocks .  Matrix Arrow Indicator MT5  will determine the current trend at its early stages, gathering information and data from up to 10 standard indicators, which are: Average Directional Movement Index (ADX) Commodity Channel Index (CCI) Classic Heiken Ashi candles Moving Average
Trend Line Map Pro MT5
STE S.S.COMPANY
4.09 (11)
Trend Line Map indicator is an addons for   Trend Screener Indicator . It's working as a scanner for all signals generated by Trend screener ( Trend Line Signals ) . It's a Trend Line Scanner based on Trend Screener Indicator.  If you don't have Trend Screener Pro Indicator,   the Trend Line Map Pro will not work.     LIMITED TIME OFFER : Trend Line Map Indicator is available for only 50 $ and lifetime. ( Original price 125$ ) By accessing to our MQL5 Blog,  you can find all our premium indicat
Quantum TrendPulse
Bogdan Ion Puscasu
5 (13)
Introducing Quantum TrendPulse , the ultimate trading tool that combines the power of SuperTrend , RSI , and Stochastic into one comprehensive indicator to maximize your trading potential. Designed for traders who seek precision and efficiency, this indicator helps you identify market trends, momentum shifts, and optimal entry and exit points with confidence. Key Features: SuperTrend Integration: Easily follow the prevailing market trend and ride the wave of profitability. RSI Precision: Detect
FourAverageMT5
Mikhail Sergeev
5 (2)
FourAverage is a new word in trend detection. With the development of information technology and a large number of participants, financial markets are becoming less amenable to analysis by outdated indicators. Conventional technical analysis tools, such as a Moving Average or Stochastic, in their pure form are not able to determine the direction of a trend or its reversal. Can one indicator indicate the correct direction of the future price, without changing its parameters, based on the history
FX Dynamic: Track Volatility and Trends with Customized ATR Analysis Overview FX Dynamic is a powerful tool that leverages Average True Range (ATR) calculations to give traders unparalleled insights into daily and intraday volatility. By setting up clear volatility thresholds—such as 80%, 100%, and 130%—you can quickly identify potential profit opportunities or warnings when markets exceed typical ranges. FX Dynamic adapts to your broker’s time zone, helps you maintain a consistent measure of
CBT Quantum Maverick High-Efficiency Binary Trading System CBT Quantum Maverick is a finely tuned, high-performance binary options trading system designed for traders seeking precision, simplicity, and disciplined trading. No customization is required—this system is optimized for effective results right out of the box. Simply follow the signals, which can be mastered with a bit of practice. Key Features: Signal Precision: New-bar-based trading signals—targeting the next candle based on curren
- Lifetime update free Contact me for instruction, any questions! Related Product:  Gold Trade Expert MT5 - Non-repaint - I just sell my products in Elif Kaya Profile, any other websites are stolen old versions, So no any new updates or support. Introduction The breakout and retest strategy is traded support and resistance levels. it involves price breaking through a previous level.  The break and retest strategy is designed to help traders do two main things, the first is to avoid false breako
First of all Its worth emphasizing here that this Trading Tool is Non Repainting , Non Redrawing and Non Lagging Indicator , Which makes it ideal for professional trading . Online course, user manual and demo. The Smart Price Action Concepts Indicator is a very powerful tool for both new and experienced traders . It packs more than 20 useful indicators into one , combining advanced trading ideas like Inner Circle Trader Analysis and Smart Money Concepts Trading Strategies . This indicator focus
Trend Hunter MT5
Andrey Tatarinov
5 (2)
Trend Hunter is a trend indicator for working in the Forex, cryptocurrency, and CFD markets. A special feature of the indicator is that it confidently follows the trend, without changing the signal when the price slightly pierces the trend line. The indicator is not repaint; a signal to enter the market appears after the bar closes. When moving along a trend, the indicator shows additional entry points in the direction of the trend. Based on these signals, you can trade with a small StopLoss. Tr
First of all Its worth emphasizing here that this Trading System is Non-Repainting   , Non Redrawing and Non Lagging Indicator Which makes it ideal from both manual and robot trading .  Online course, manual and download presets. The Smart Trend Trading System MT5 is a comprehensive trading solution tailored for new and experienced traders . It combines over 10 premium indicators and features more than 7 robust trading strategies , making it a versatile choice for diverse market conditions . Tre
Royal Scalping Indicator M5
Vahidreza Heidar Gholami
5 (6)
Royal Scalping Indicator is an advanced price adaptive indicator designed to generate high-quality trading signals. Built-in multi-timeframe and multi-currency capabilities make it even more powerful to have configurations based on different symbols and timeframes. This indicator is perfect for scalp trades as well as swing trades. Royal Scalping is not just an indicator, but a trading strategy itself. Features Price Adaptive Trend Detector Algorithm Multi-Timeframe and Multi-Currency Trend Low
Gold Trend 5
Sergei Linskii
3.5 (2)
Gold Trend - this is a good stock technical indicator. The indicator algorithm analyzes the price movement of an asset and reflects volatility and potential entry zones. The best indicator signals: For SELL = red histogram + red SHORT pointer + yellow signal arrow in the same direction. For BUY = blue histogram + blue LONG pointer + aqua signal arrow in the same direction. Benefits of the indicator: The indicator produces signals with high accuracy. A confirmed arrow signal can only be redrawn
Auto Order Block with break of structure based on ICT and Smart Money Concepts (SMC) Futures Break of Structure ( BoS )             Order block ( OB )            Higher time frame Order block / Point of Interest ( POI )    shown on current chart           Fair value Gap ( FVG ) / Imbalance   -  MTF      ( Multi Time Frame )    HH/LL/HL/LH  -  MTF      ( Multi Time Frame )  Choch  MTF      ( Multi Time Frame )  Volume Imbalance     ,  MTF          vIMB Gap’s Power of 3 Equal High / Low’s  
Volumatic VIDyA MT5
Duc Hoan Nguyen
5 (2)
Special offer : ALL TOOLS , just $35 each! New tools   will be   $30   for the   first week   or the   first 3 purchases !  Trading Tools Channel on MQL5 : Join my MQL5 channel to update the latest news from me Volumatic VIDYA (Variable Index Dynamic Average) is an advanced indicator designed to track trends and analyze buy-sell pressure within each phase of a trend. By utilizing the Variable Index Dynamic Average as a core dynamic smoothing technique, this tool provides critical insights into
Atomic Analyst MT5
Issam Kassas
4.32 (19)
First of all Its worth emphasizing here that this Trading Indicator is   Non-Repainting   , Non Redrawing and Non Lagging Indicator   Indicator, Which makes it ideal from both manual and robot trading.  User manual: settings, inputs and strategy . The Atomic Analyst  is a PA Price Action Indicator that uses Strength and Momentum of the price to find a better edge in the market. Equipped with Advanced filters which help remove noises and false signals, and Increase Trading Potential. Using Multi
ATrend
Zaha Feiz
4.77 (13)
ATREND: How It Works and How to Use It How It Works The " ATREND " indicator for the MT5 platform is designed to provide traders with robust buy and sell signals by utilizing a combination of technical analysis methodologies. This indicator primarily leverages the Average True Range (ATR) for volatility measurement, alongside trend detection algorithms to identify potential market movements. Leave a massage after purchase and receive a special bonus gift. Key Features: ⦁ Dynamic Trend Detect
More from author
Swing High/Low & Candle Patterns Indicator is a pivot‐based technical tool that helps traders identify potential turning points in the market (swing highs and swing lows) and automatically detects common candlestick reversal patterns. Below is a detailed overview of how it works and what you can expect: 1. Pivot Detection (Swing Highs and Swing Lows) Core Logic : The indicator uses a user‐defined lookback period ( InpLength ) to determine whether a bar qualifies as a local maximum (pivot high) o
FREE
Why Use the WaveTrend Indicator? Here’s why WaveTrend stands out as a must-have tool for traders: Precision Timing for Entries and Exits By highlighting overbought and oversold zones, WaveTrend helps you enter trades at undervalued levels and exit at overvalued peaks, optimizing your risk-to-reward ratio. Clear Trend Confirmation Crossovers provide straightforward signals to confirm whether a trend is starting or ending, reducing uncertainty and boosting decision-making confidence. Early Reve
FREE
ADX and DI Indicator
Mohamed Elyes Hantous
ADX and DI Indicator: Your Key to Smarter Trading The ADX and DI Indicator is a must-have tool for traders who want to master trend analysis and make confident, data-driven decisions. Whether you’re trading stocks, forex, commodities, or cryptocurrencies, this indicator delivers clear insights into both the strength and direction of market trends—helping you seize opportunities and avoid costly missteps. Why Choose the ADX and DI Indicator? In fast-paced markets, timing is everything. The ADX a
FREE
Cm Williams Vix
Mohamed Elyes Hantous
CM_Williams_Vix_Fix Indicator Description The CM_Williams_Vix_Fix is a sophisticated, volatility-based technical indicator designed to help traders identify potential market reversals by analyzing the relationship between current price lows and the highest closing prices over a specified period. Drawing inspiration from the Volatility Index (VIX)—often referred to as the "fear index"—and possibly incorporating concepts from trader Larry Williams, this indicator provides a unique perspective on
FREE
Smart Range Detector
Mohamed Elyes Hantous
Smart Range Detector – Advanced Market Structure Indicator Overview The Smart Range Detector is an advanced trading indicator designed to automatically identify key price ranges where market consolidation, accumulation, or distribution occurs. This tool helps traders spot high-probability breakout zones, liquidity areas, and potential trade setups by detecting significant price ranges that the market respects. Unlike traditional range indicators, the Smart Range Detector dynamically adjusts base
FREE
Quantum Ladder SPX500
Mohamed Elyes Hantous
Next-Gen E-mini SPX500 DCA Trading Bot: Your Ultimate Wealth Growth Machine Unleash the Power of AI-Driven Trading Introducing the E-mini SPX500 DCA AI Trader , a cutting-edge, fully automated trading algorithm designed to turn small capital into substantial wealth with unmatched risk management and precision. Optimized for the 4-hour timeframe , this bot strategically capitalizes on every market fluctuation, compounding gains while minimizing risk. With a proven track record of growing $1,000
Market Structure Pro
Mohamed Elyes Hantous
Break & Retest Indicator – Precision Market Structure Tool The Break and Retest Indicator is a powerful trading tool designed to help traders spot high-probability break-and-retest setups based purely on support and resistance levels . This indicator automatically identifies when price breaks a significant level and then retests it, providing clear bullish or bearish signals . Key Features: Automated Break & Retest Detection The indicator scans price action in real time to identify valid breakou
Filter:
No reviews
Reply to review