Boilinger Bands and RSI by Gerega
- Experts
- Illia Hereha
- Version: 1.6
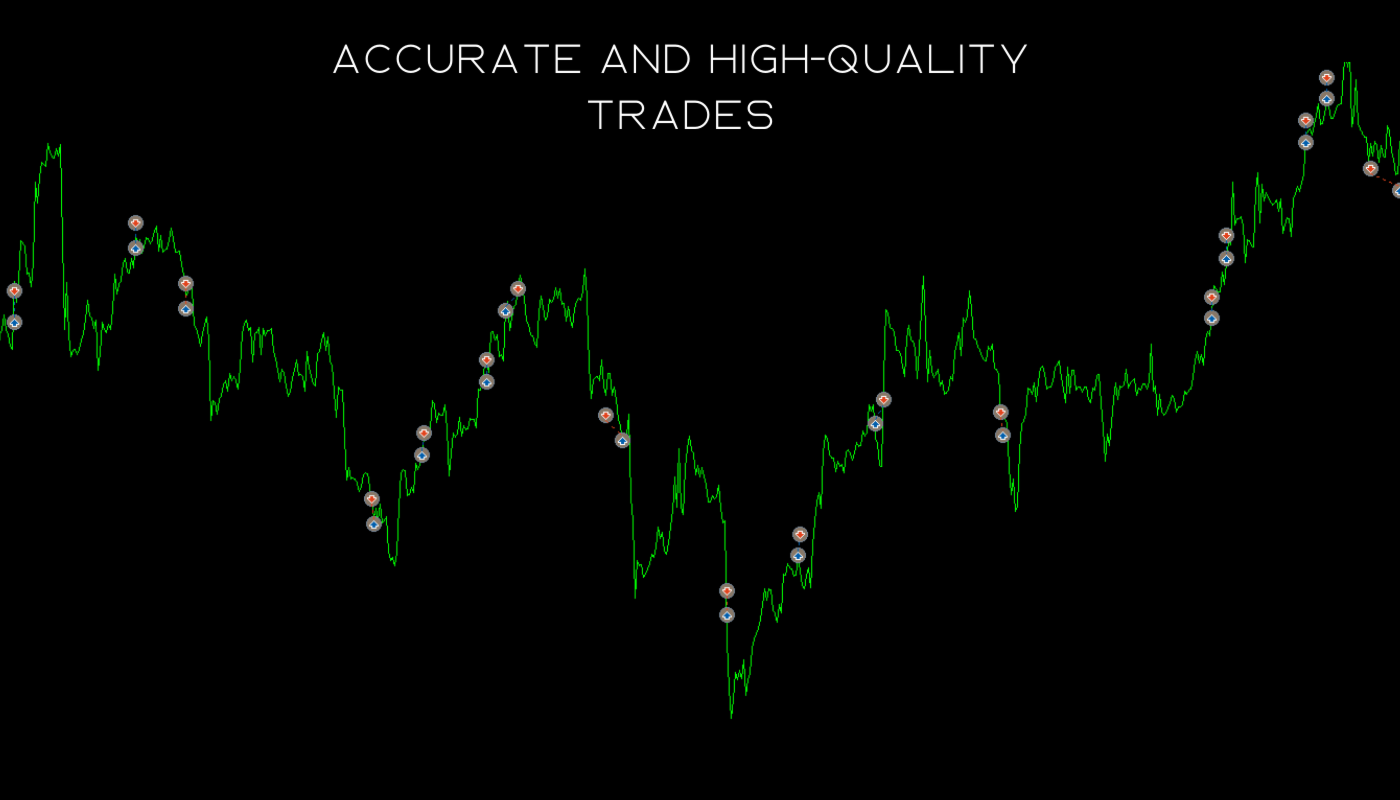
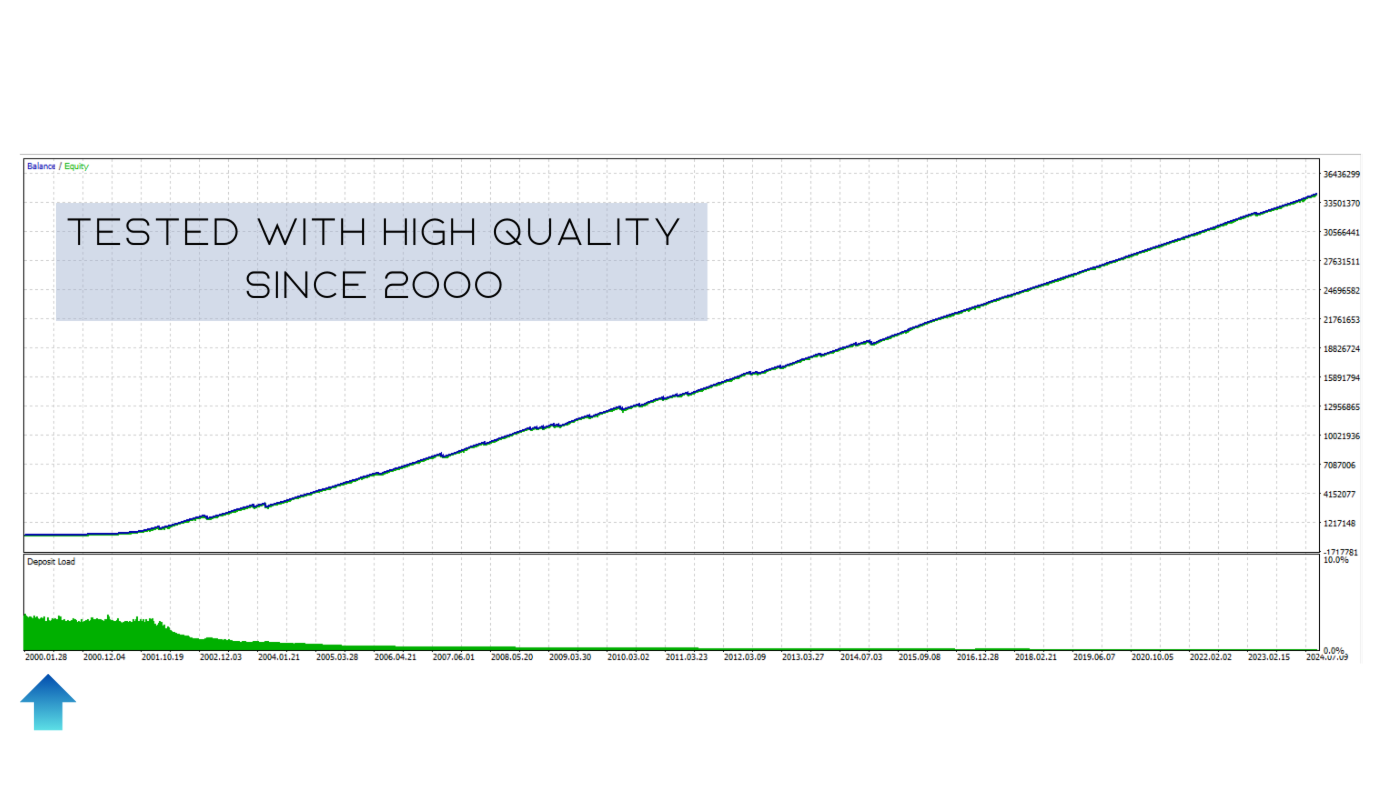
This strategy uses Bollinger Bands and the Relative Strength Index (RSI) to identify potential trade opportunities. It is designed for both mean-reversion and trend-following approaches, making it suitable for various market conditions.
How It Works:
-
Bollinger Bands assess volatility and identify overbought/oversold conditions.
-
RSI gauges momentum and confirms potential market reversals.
Trade Entry:
-
Buy: When the price reaches or falls below the lower Bollinger Band, and the RSI is below 30 (indicating oversold conditions).
-
Sell: When the price reaches or exceeds the upper Bollinger Band, and the RSI is above 70 (indicating overbought conditions).
Trade Exit:
-
Positions are closed when the RSI moves back to a neutral zone (between 40-60), or when the price returns to the middle Bollinger Band.
Key Features:
-
Volatility & Momentum Combination: Offers strong confirmation signals for trade decisions.
-
Adaptable to Various Market Conditions: Works well for both trending and ranging markets.
-
Suitable for Scalping & Swing Trading: Flexible across different timeframes.
-
Customizable Parameters: Fine-tune Bollinger Bands and RSI settings to enhance performance.
This strategy is suitable for traders who seek dependable entry and exit signals, based on market conditions.