Inducement Market Structure ICT with ZigZag MT4
- Indicators
- Eda Kaya
- Version: 1.11
- Activations: 10
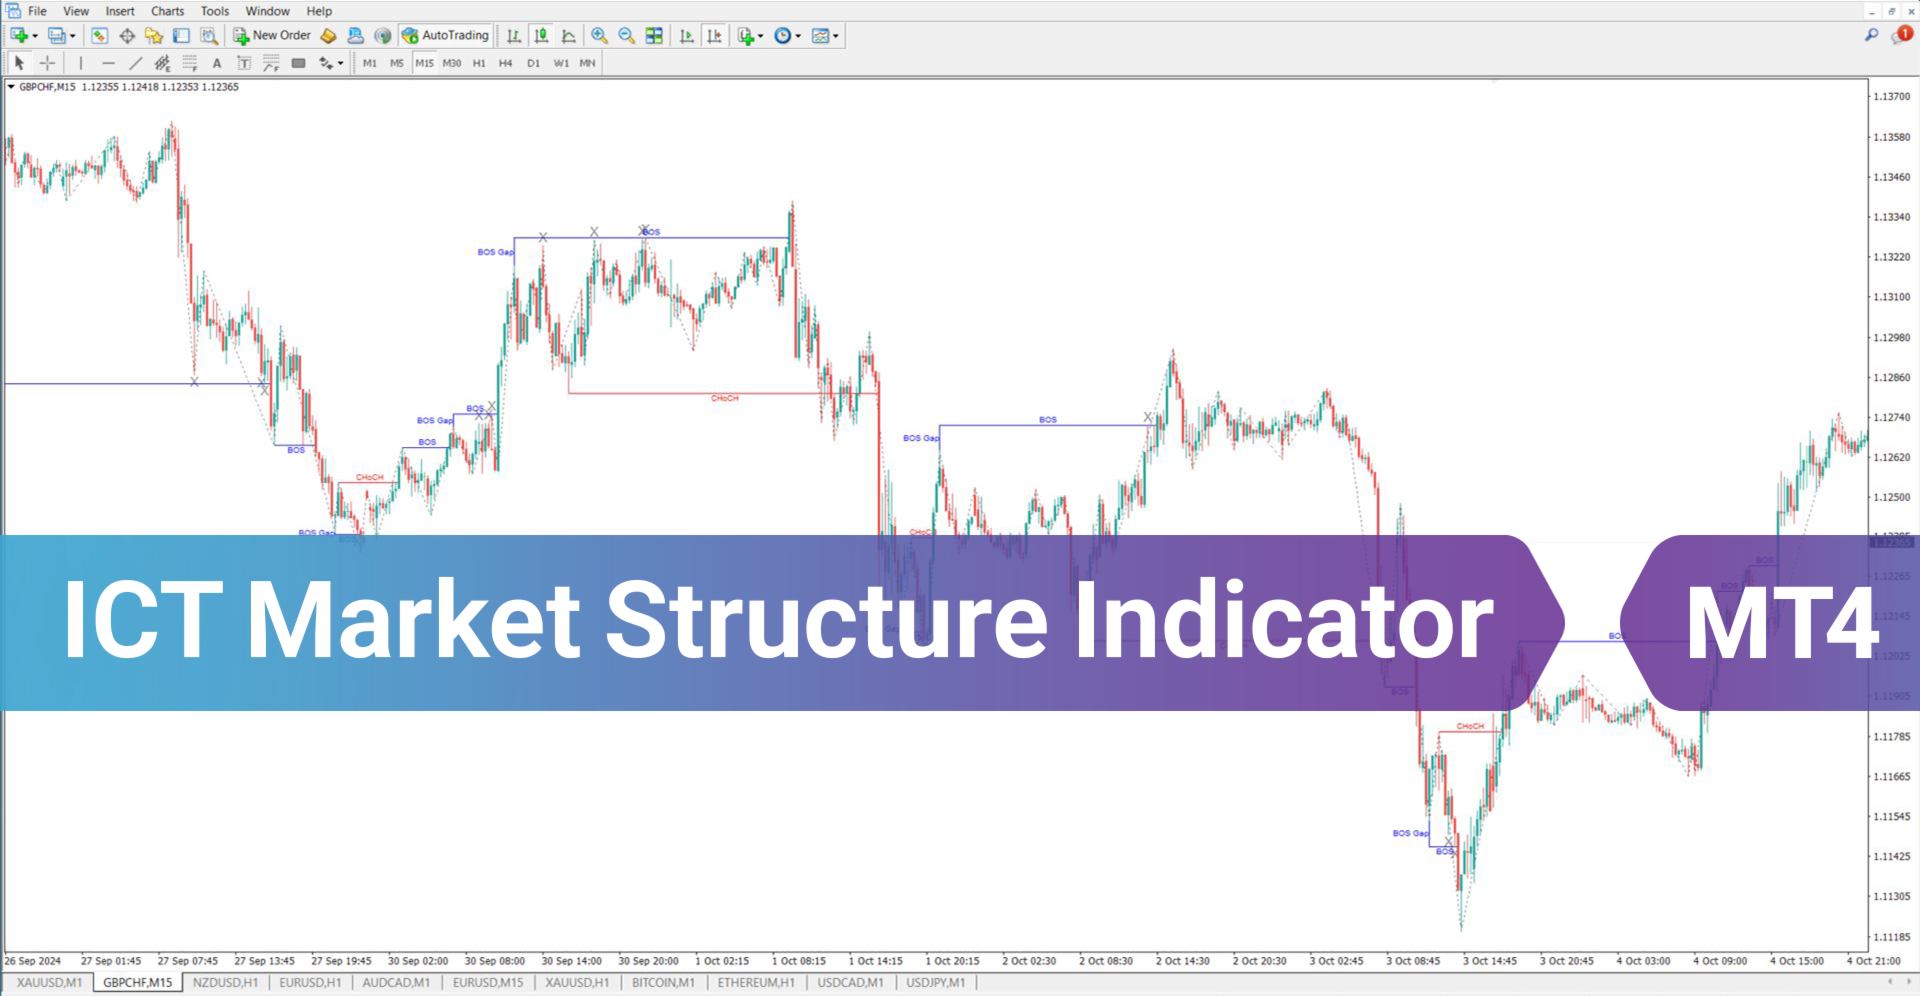
ICT Market Structure Indicator with Inducements MT4
The ICT-style Market Structure Indicator for MetaTrader 4 provides traders with a detailed analysis of Smart Money market dynamics. This tool integrates essential elements such as Change of Character (CHoCH), Break of Structure (BOS), and Inducement Detection (IDM) to give a precise representation of price movement.
On the price chart, red lines highlight CHoCH levels, blue lines represent structural breaks, and gray lines indicate inducement zones. A dashed line follows price fluctuations, visually linking key movements in the market.
«Indicator Installation & User Guide»
MT4 Indicator Installation | Inducement Market Structure ICT with ZigZag MT5 | ALL Products By TradingFinderLab | Best MT4 Indicator: Refined Order Block Indicator for MT4 | Best MT4 Utility: Trade Assistant Expert TF MT4 | TP & SL Tool: Risk Reward Ratio Calculator RRR MT4 | Money Management: Easy Trade Manager MT4 | Trade Copier: Free Fast Local Trade Copier MT4
Indicator Specifications Table
| Category | ICT - Smart Money - Liquidity |
| Platform | MetaTrader 4 |
| Skill Level | Advanced |
| Indicator Type | Continuation - Reversal |
| Timeframe | Multi timeframe |
| Trading Style | Scalping - Day Trading - Swing Trading |
| Market | Cryptocurrency - Forex - Commodities - Stocks |
Overview of the Indicator
The Market Structure Indicator highlights key price movement areas like CHoCH and BOS on the price chart. When price surpasses a support or resistance level, it signifies a structure break.
The Inducement Detection (IDM) component pinpoints levels where traders are likely to enter positions. The importance of these levels increases in higher timeframes, as shorter timeframes can reflect temporary market fluctuations driven by sentiment.
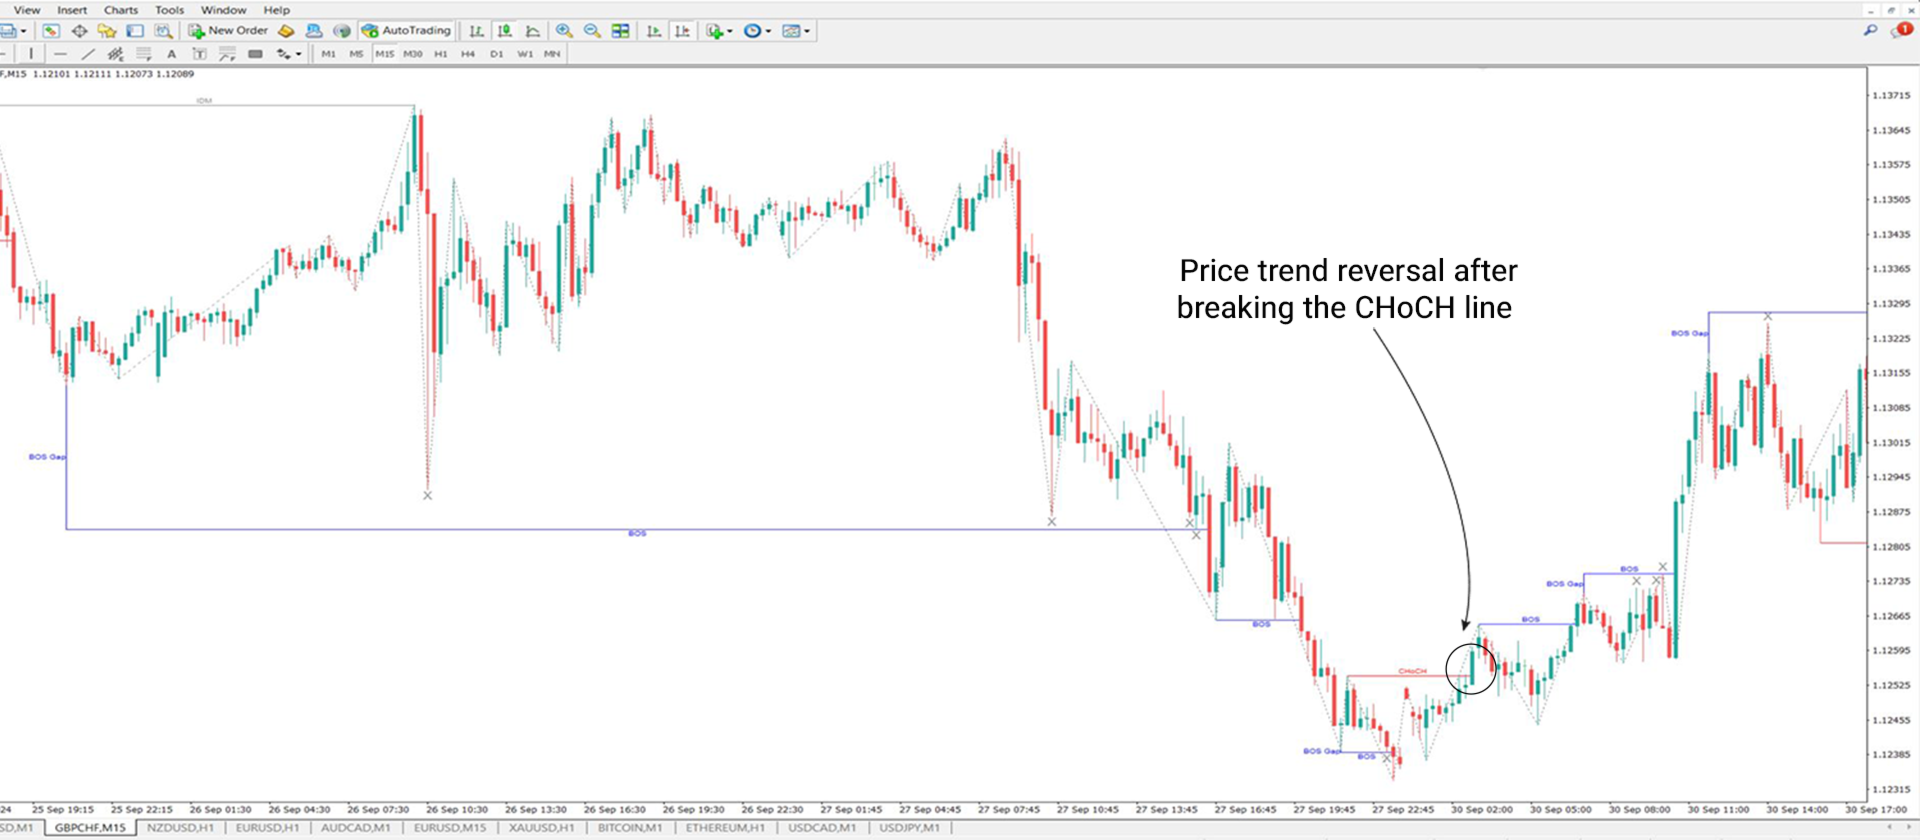
ICT Market Structure Indicator in an Uptrend
On a 15-minute GBP/CHF chart, a green candle crosses the CHoCH line, signaling a market shift. If a candle body moves above the red line, it suggests an optimal moment to initiate a buy (Long) trade. Furthermore, breaking through the blue structure levels confirms an entry point. However, if only the candle’s wick crosses these lines, it does not confirm a buy opportunity.
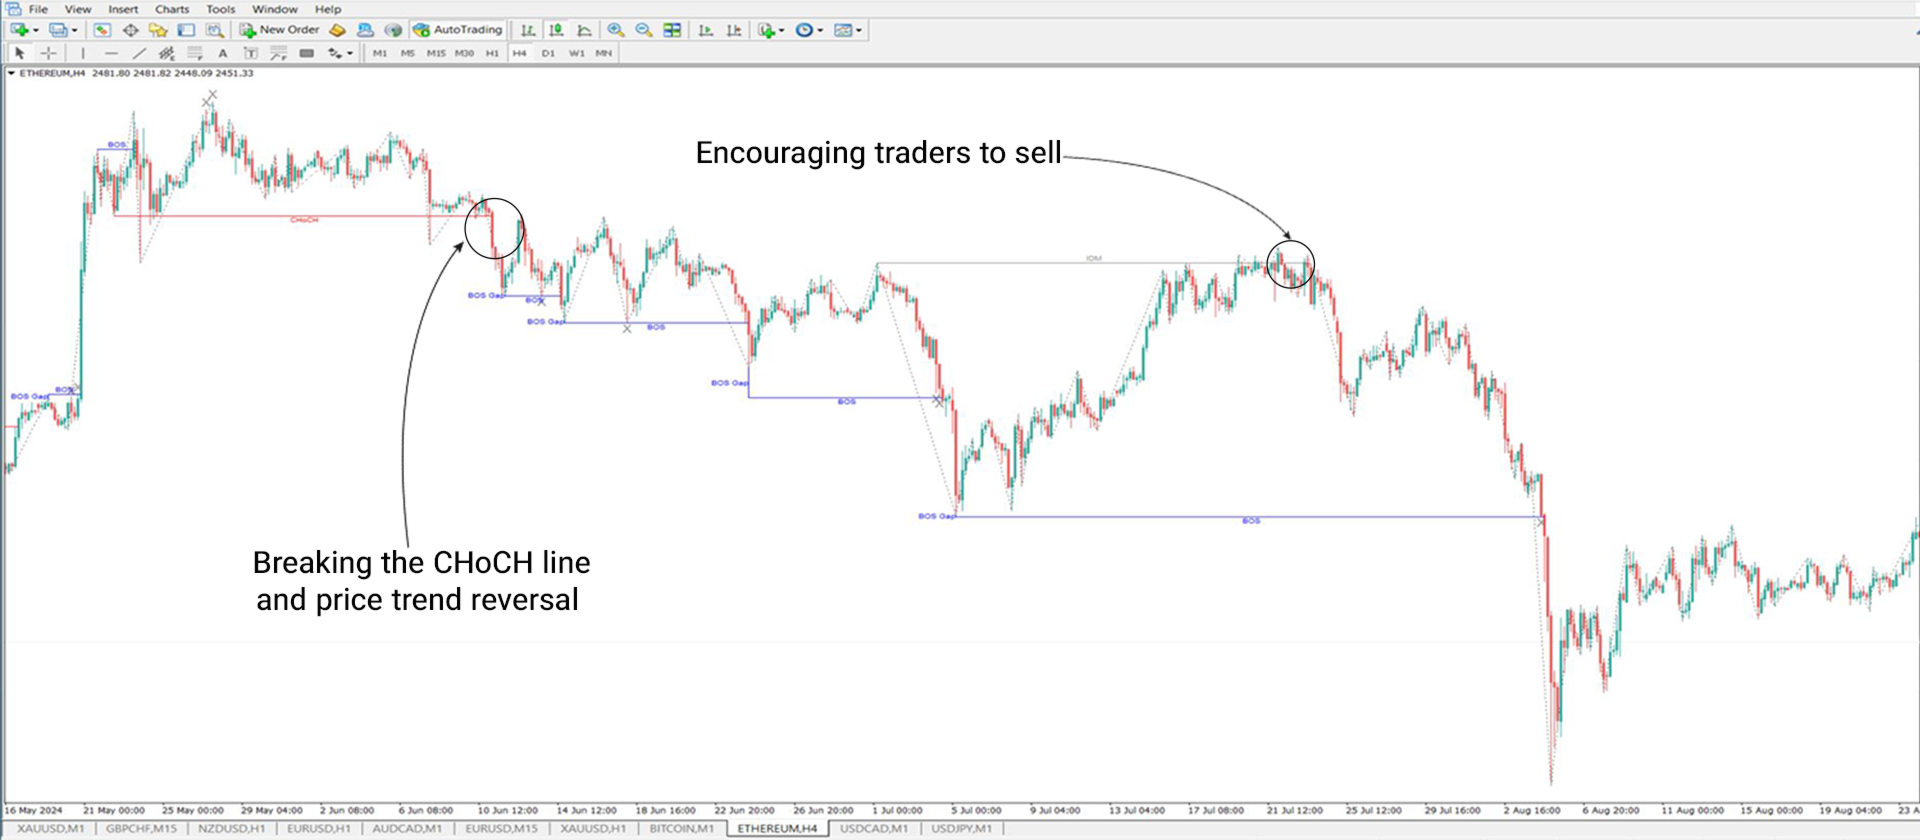
ICT Market Structure Indicator in a Downtrend
On a 4-hour Ethereum (ETH/USD) chart, two key sell confirmations are visible. The first occurs when a red candle body breaks below the CHoCH level, signaling a trend reversal. Next, inducement detection at the gray IDM zone reinforces the sell setup. BOS confirmations further support the trend continuation, validating the price movement.
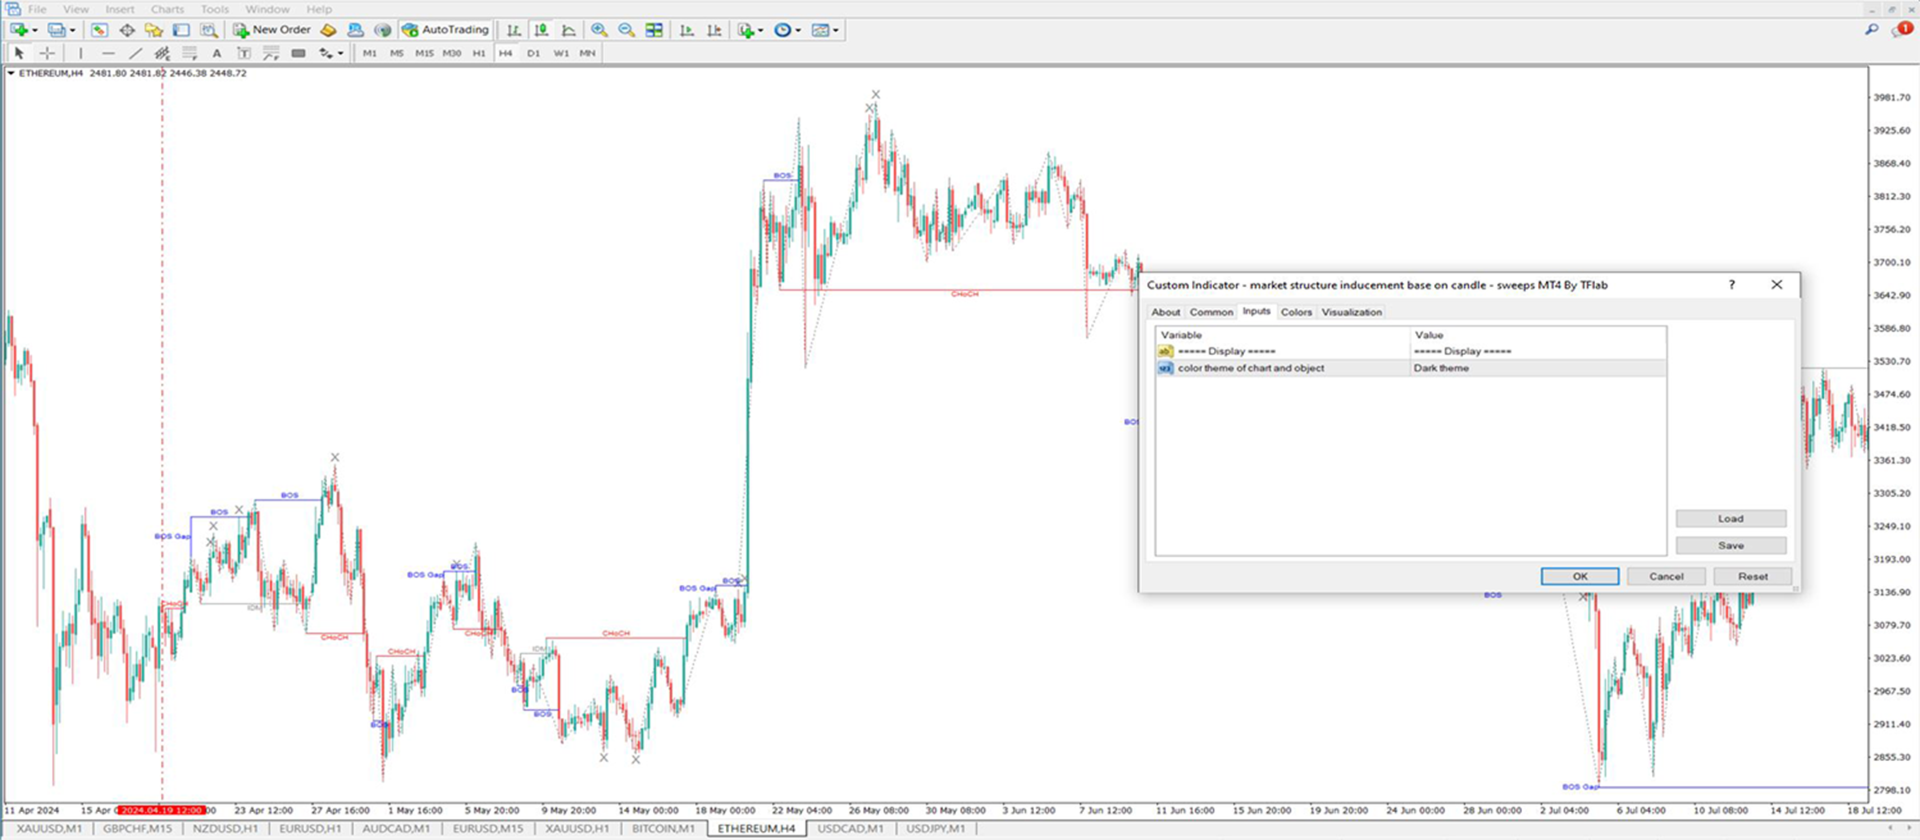
Indicator Settings
- Theme: Dark Mode for improved visibility
Final Thoughts
Designed with a clean and practical interface, the ICT Market Structure Indicator with Inducements MT4 equips traders with critical insights into price direction, market structure shifts, and inducement points. This tool is ideal for Smart Money strategies, ICT methodologies, and price action-based trading across various financial markets, including crypto, forex, and stocks.