MT5 Fimathe Canal de referencia e zona neutra
- Indicators
- Gidione Fontes
- Version: 1.1
- Updated: 28 February 2025
- Activations: 5
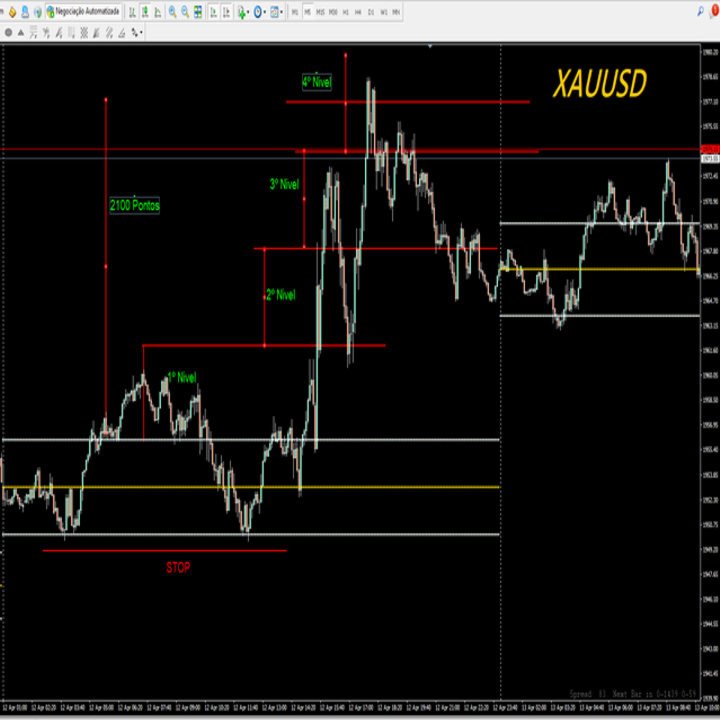
Esse indicador mede o 1º Canal de referencia e a 1º Zona Neutra
* configurar o canal macro para verificar a frequencia MAIOR H1 H4 1D
* configurar o canal micro para verificar a frequencia Menor 1M 5M 15M
Como instalar o Indicador fimathe. E uma pré mentoria
tem uma estrategia Secreta bonus nesse video .
assitao o video para enteder as logicas que podemos iniciar com esse indicador.
https://www.youtube.com/playlist?list=PLxg54MWVGlJzzKuaEntFbyI4ospQi3Kw2