Reversal Radar
- Indicators
- Muhammad Abdullah Bhatti
- Version: 1.0
- Activations: 5
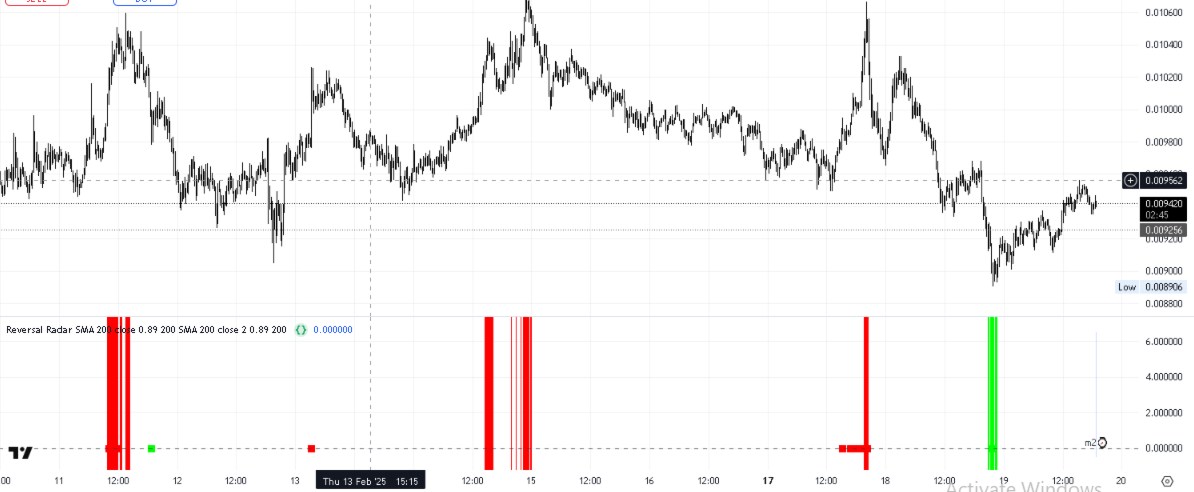
Reversal Radar – Technical Indicator for Market Reversal Analysis
Overview
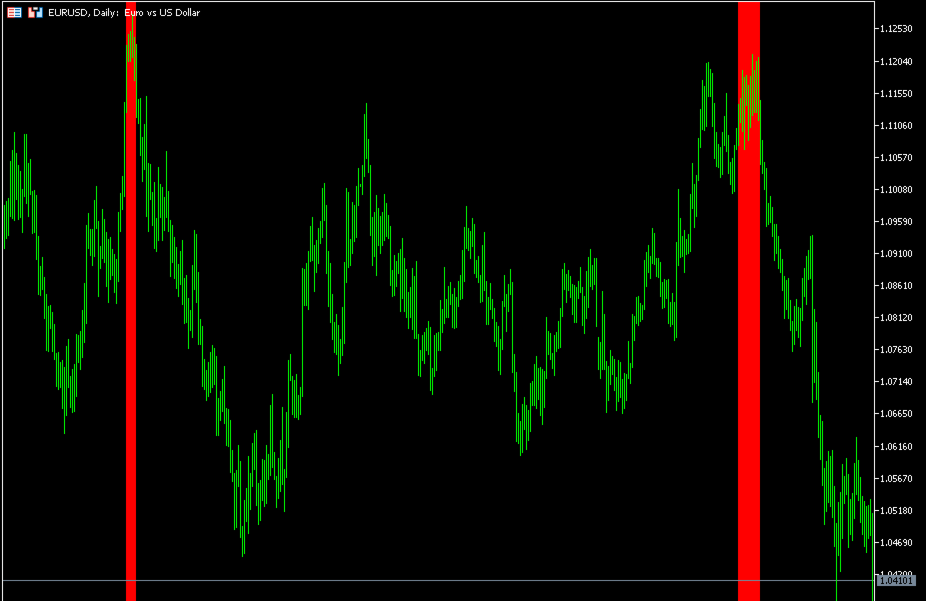
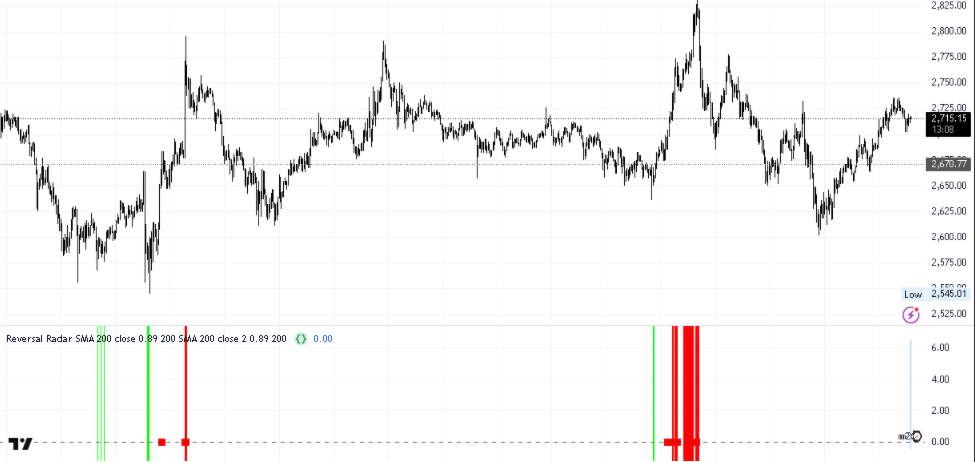
Reversal Radar is a technical indicator developed to assist in identifying potential market turning points. It analyzes historical price data to detect significant highs and lows, providing visual signals that help traders recognize areas where market momentum may shift.
Key Features
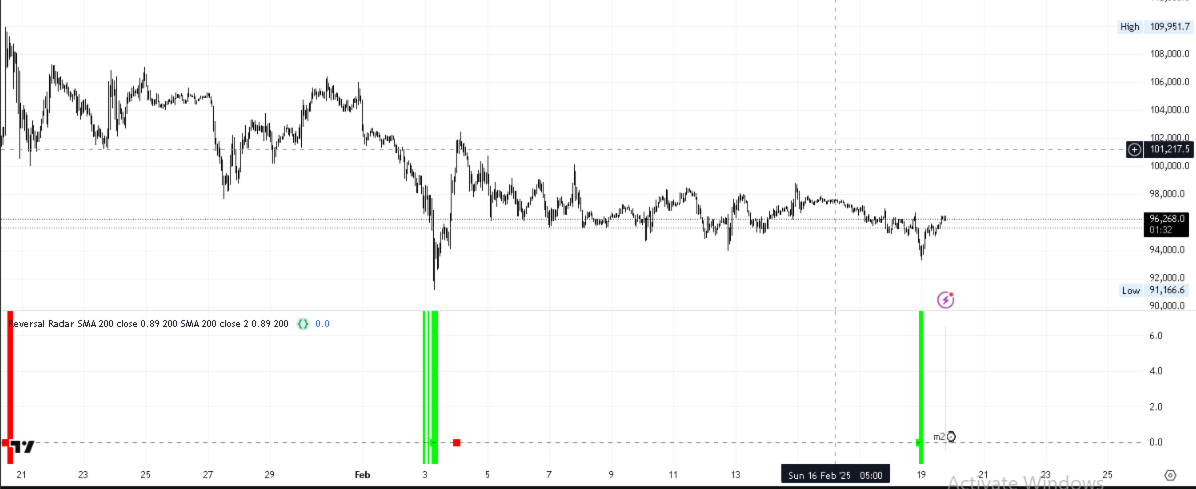
- Extreme Price Detection:
Identifies notable price peaks and troughs that may indicate potential changes in market direction. - Noise Reduction:
Utilizes a volatility filter to minimize minor fluctuations and focus on significant price movements. - Customizable Parameters:
Offers adjustable sensitivity and settings, making it adaptable to different trading styles and timeframes. - Visual Alerts:
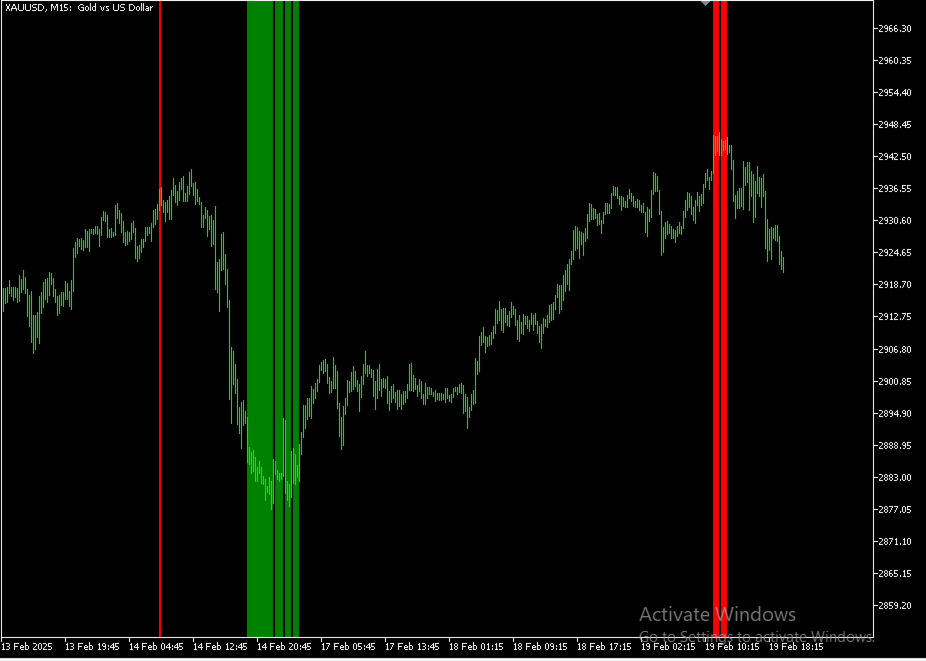
Displays clear signals on charts to support timely decision-making.
How It Works
Reversal Radar examines historical price movements to pinpoint robust extreme levels. By applying dynamic volatility thresholds, it filters out less significant fluctuations, thereby highlighting areas where the market might be preparing to reverse its trend. The indicator’s adjustable parameters allow traders to tailor its responsiveness to suit specific market conditions.
Usage Recommendations
- Timeframes:
Works best on H1 charts and higher for clearer signal visualization. - Markets:
Suitable for Forex, indices, commodities, cryptocurrencies, and stocks. - Complementary Analysis:
Can be effectively combined with other technical analysis tools for added confirmation.
Disclaimer
Reversal Radar is provided solely as an analytical tool to assist in identifying potential market reversals. It does not guarantee profits, and its signals should be verified with additional analysis. Past performance is not indicative of future results. It is recommended that you test the indicator on a demo account before using it in live trading.


User didn't leave any comment to the rating