Rejection Block Indicator and Void MT5
- Indicators
- Eda Kaya
- Version: 1.11
- Activations: 10
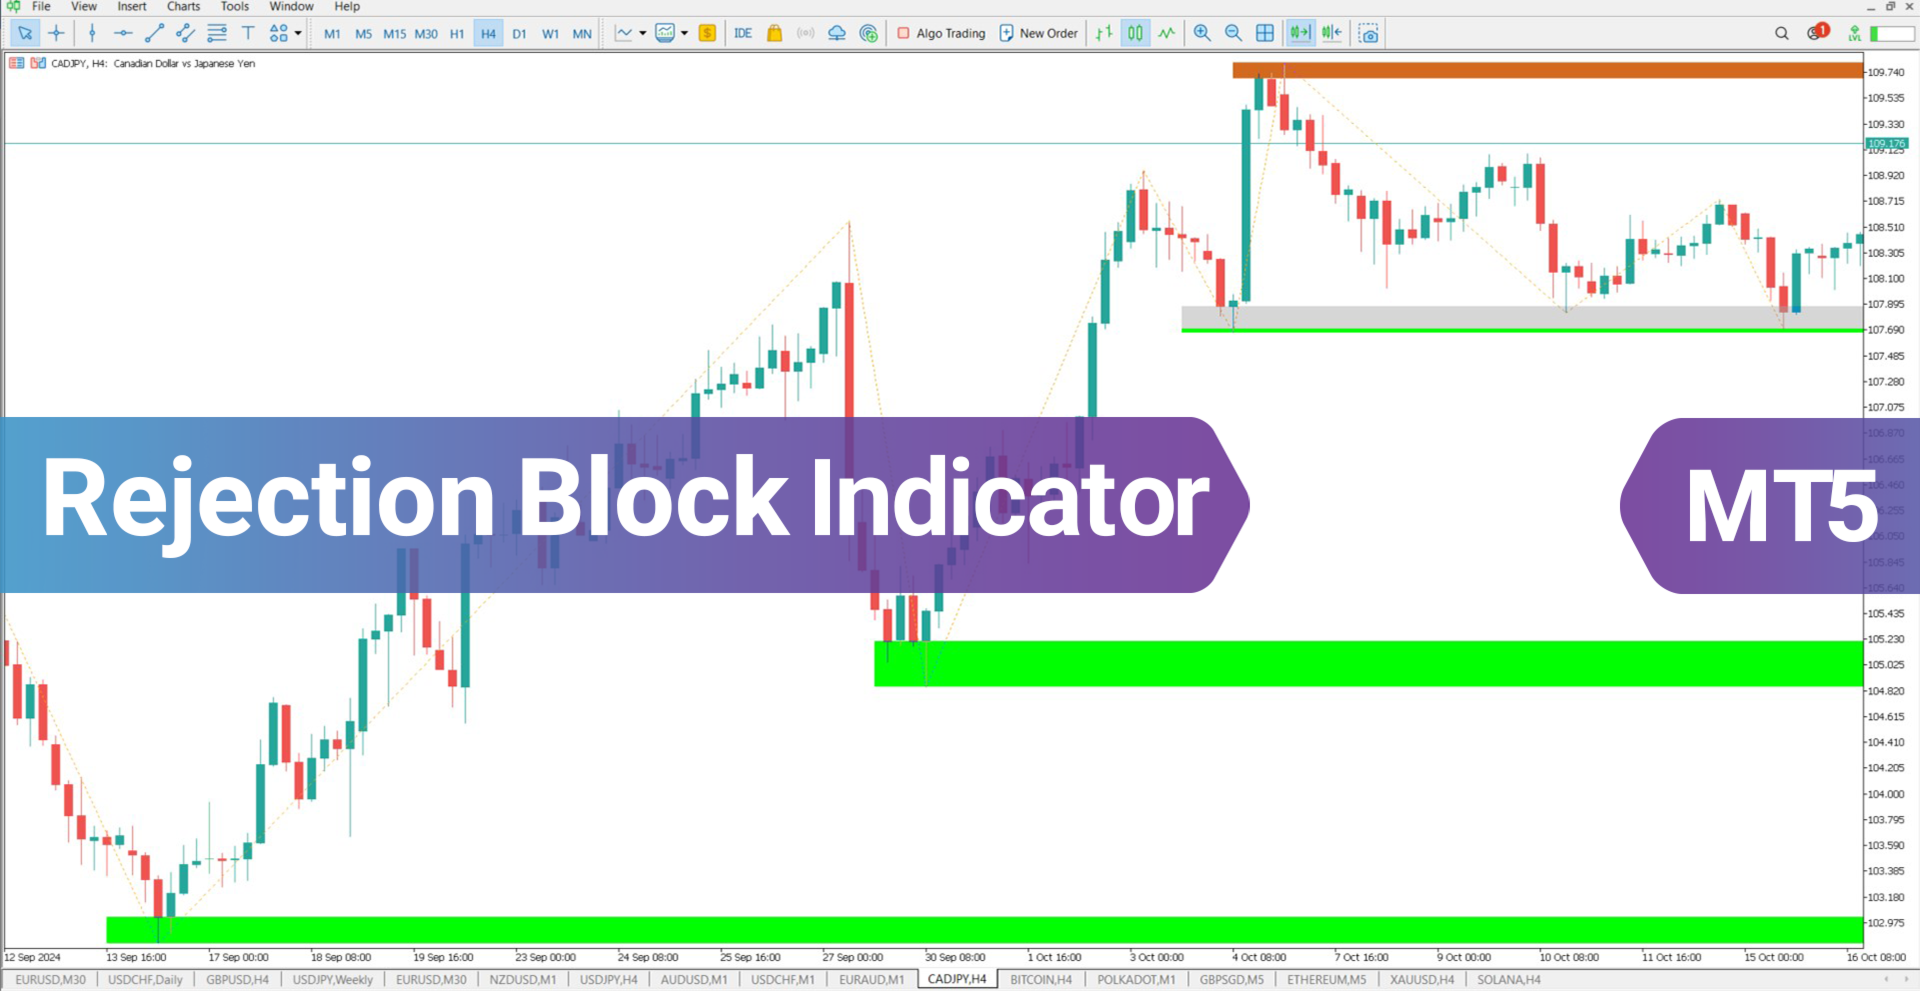
Rejection Block Indicator and Void MT5
The Rejection Block Indicator is a powerful tool designed to detect market reversal zones in MetaTrader 5. By analyzing candle wicks, this indicator marks crucial rejection block areas where long upper shadows near price highs and lower shadows near price lows act as potential reversal points. Additionally, the Void (absorbed portion) within the rejection blocks is highlighted in gray. Once this void is entirely filled, it signals that the level has lost its relevance.
Indicator Specifications Table
| Category | ICT – Liquidity – Smart Money |
| Platform | MetaTrader 5 |
| Skill Level | Intermediate |
| Indicator Type | Continuation - Reversal |
| Timeframe | Multi-Timeframe |
| Trading Style | Intraday Trading |
| Market | Cryptocurrency - Forex - Stocks - Commodities |
Indicator at a Glance
The Rejection Block Indicator detects areas of price rejection by evaluating extended candle wicks. Once such zones are identified, the tool automatically plots them on the price chart. Traders following ICT and liquidity-driven methodologies can utilize this indicator to pinpoint potential market reversals. Bullish rejection blocks are highlighted in green, while bearish rejection blocks appear in red.
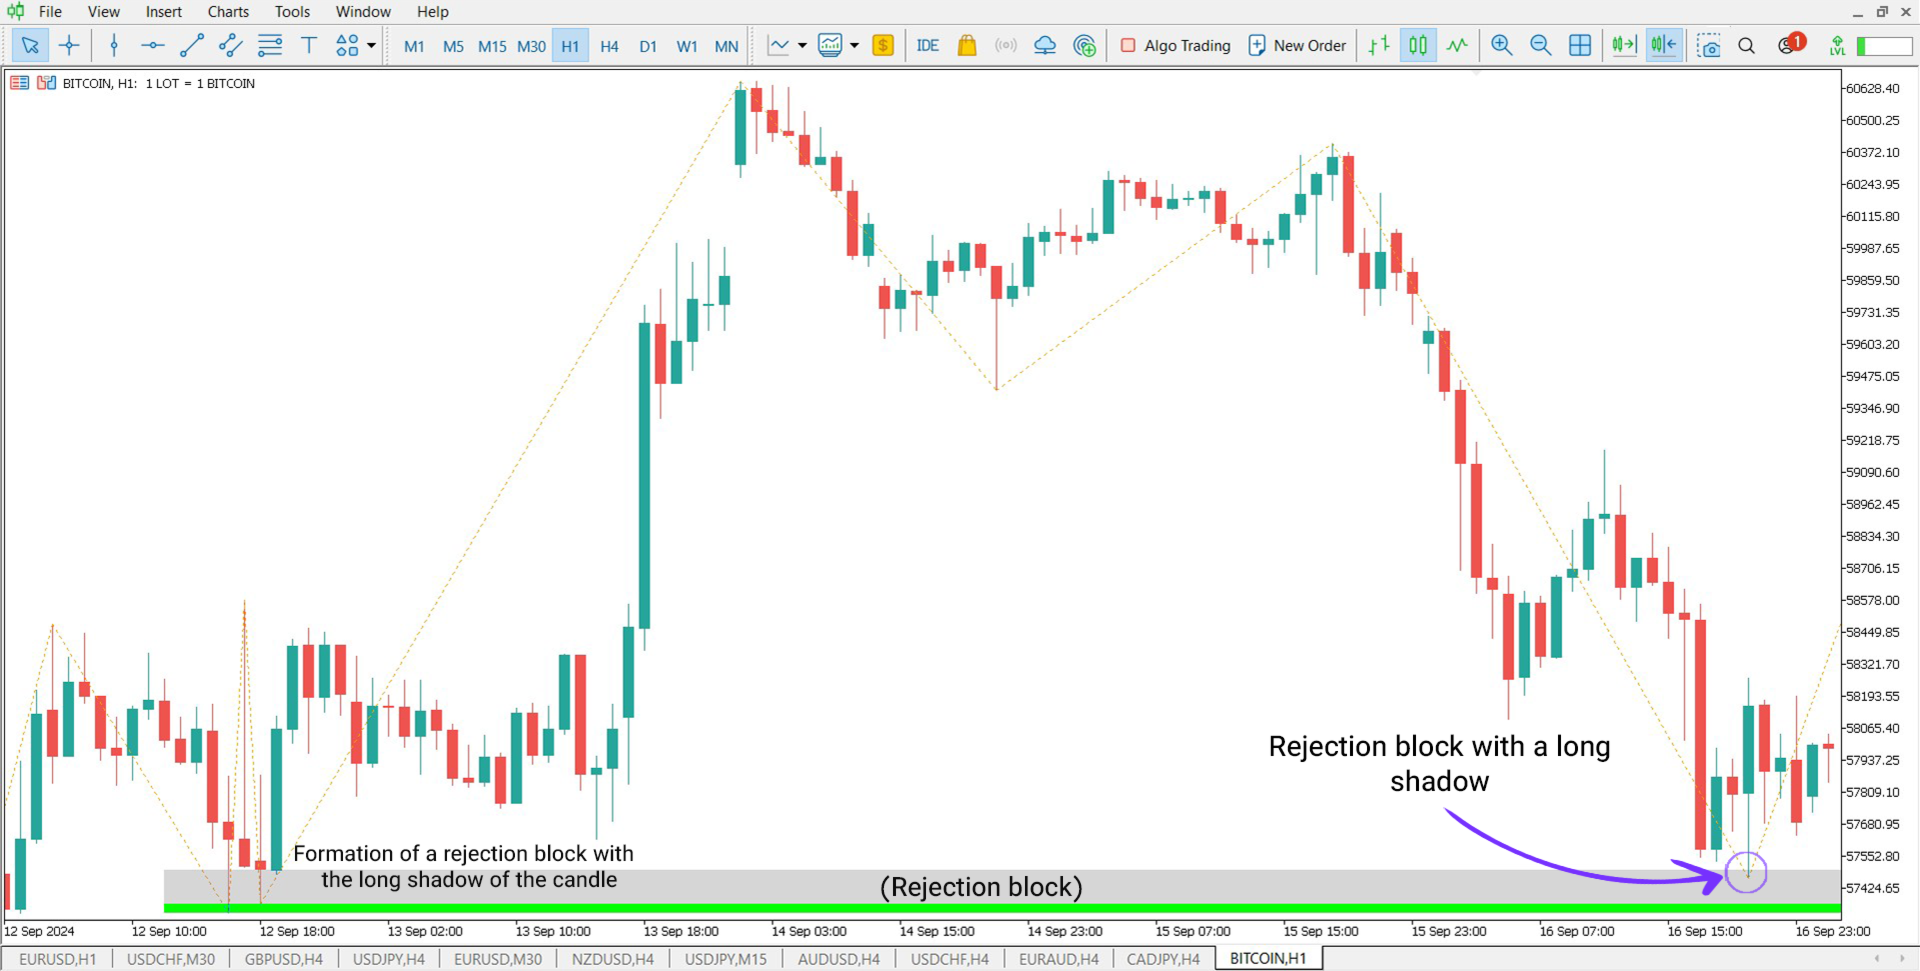
Rejection Block Indicator in an Uptrend
A Bitcoin (BTC) price chart on the 1-hour timeframe showcases how this indicator functions in an upward trend. After identifying a low and the corresponding candle wick, the indicator marks a rejection block area. Later, as the price retraces downward in a corrective move, it revisits this level, providing an optimal entry opportunity for a Buy position.
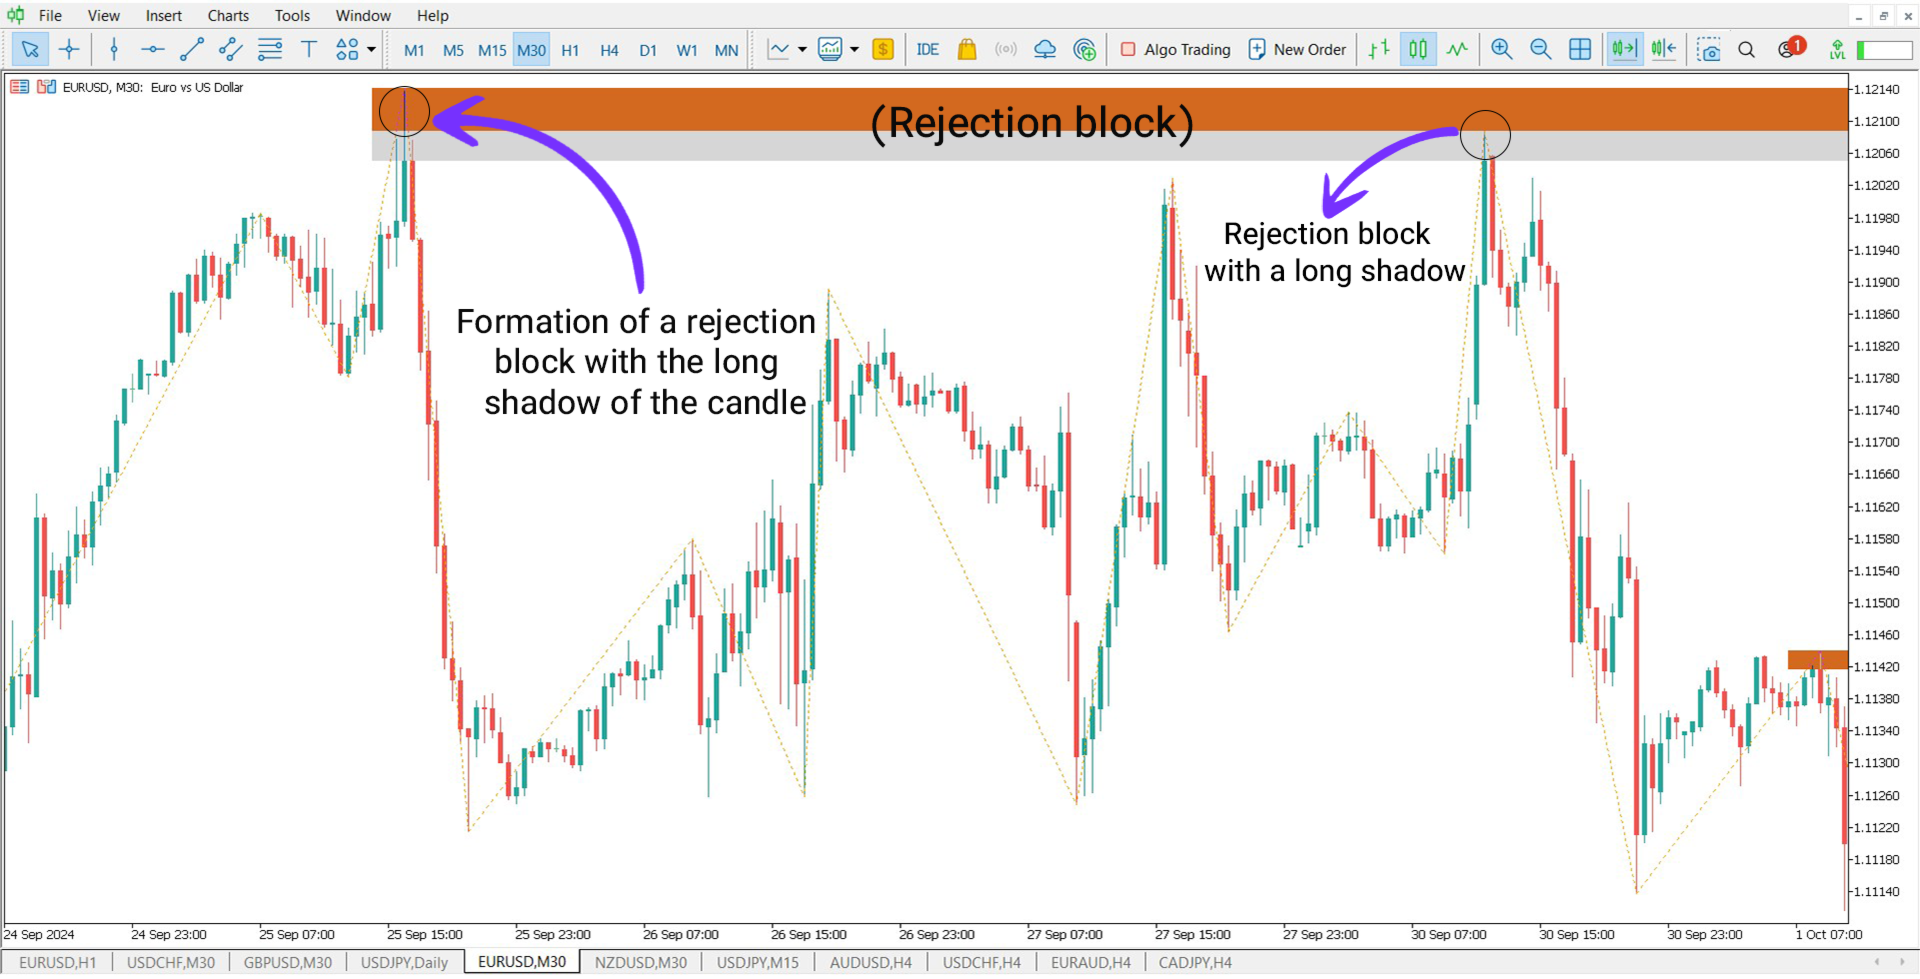
Rejection Block Indicator in a Downtrend
The indicator's application in a downtrend is illustrated in a 30-minute EUR/USD chart. Here, a bearish rejection block forms, and after a corrective price increase, the price returns to this zone. This pattern creates a potential Sell entry point, aligning with smart money and liquidity-based trading principles.
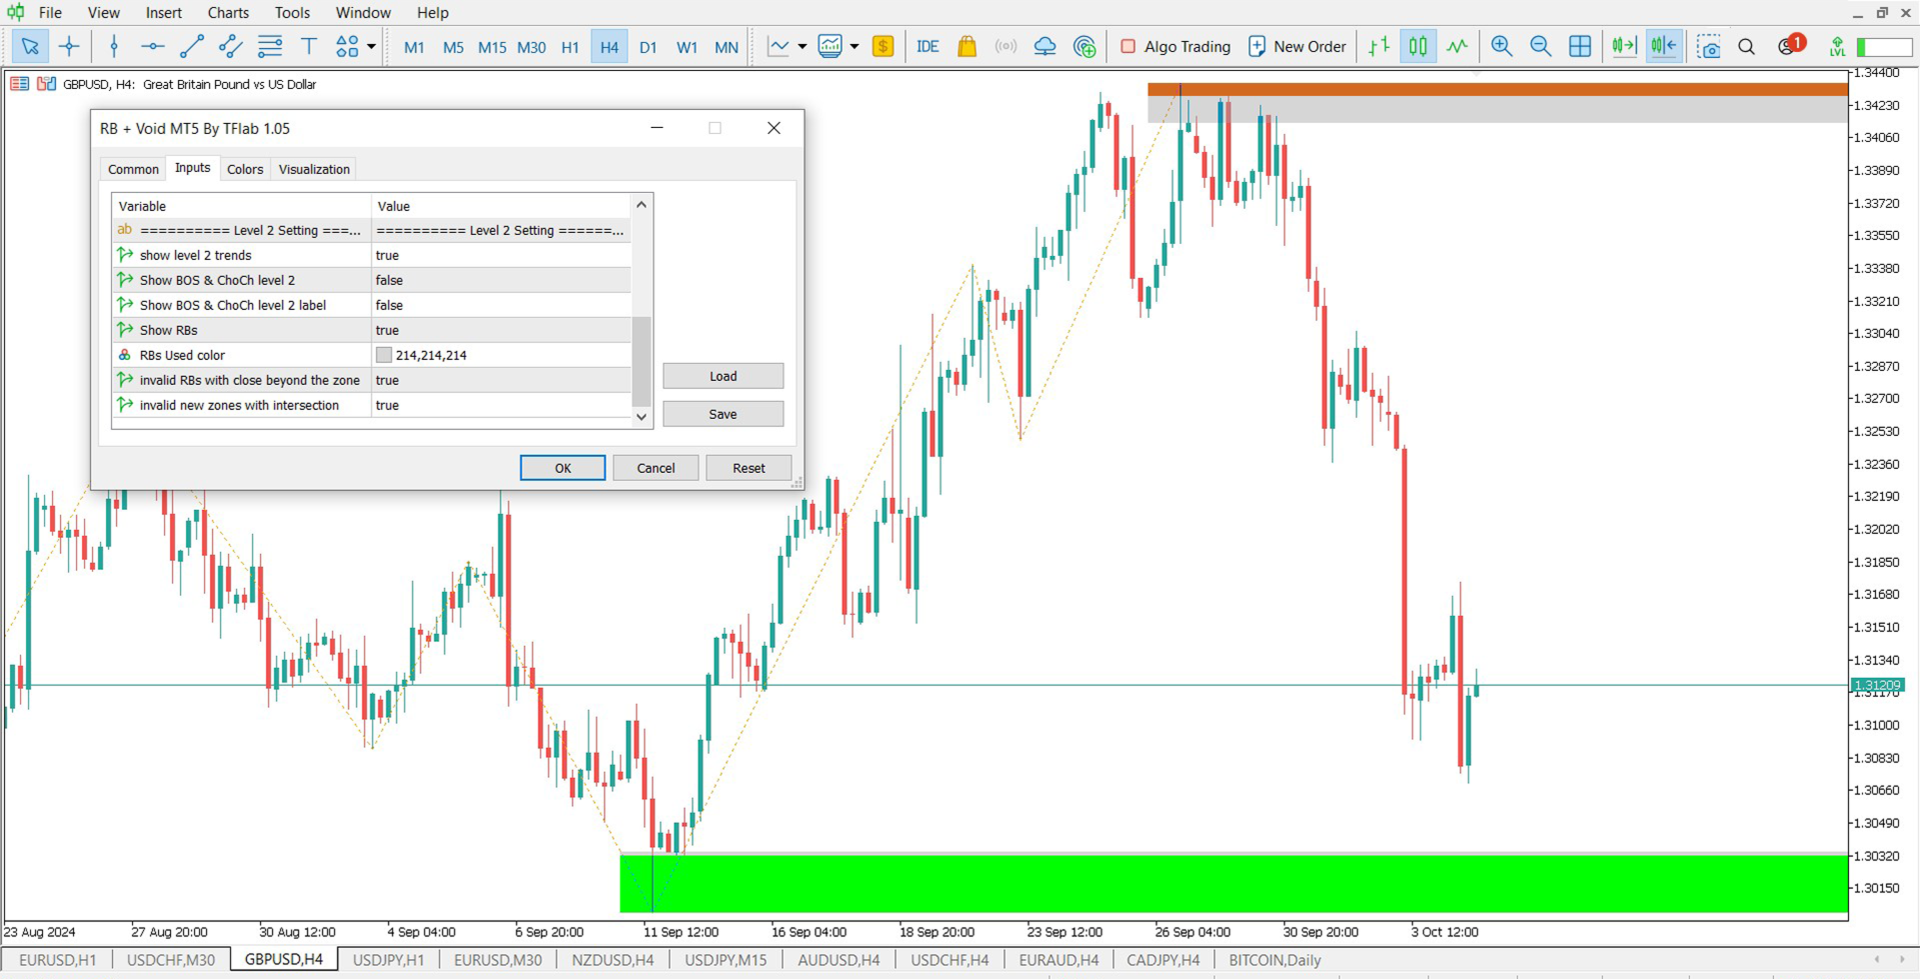
Indicator Settings
Display settings: Configure on-screen display preferences.
- Chart and object color scheme: Customize the chart background color.
- Standard configuration: Default indicator settings.
- Previous candle analysis: Review past price action.
- Object prefix: Labeling of indicator objects.
- Vertical separator line: Enable or disable time-based vertical lines.
- Trend visualization - Level 1: Display primary trend directions.
- Break of Structure (BOS) & Change of Character (ChoCH) - Level 1: Identify key market shifts.
- Trend visualization - Level 2: Show secondary trend levels.
- BOS & ChoCH - Level 2: Highlight market structure shifts at a deeper level.
- BOS & ChoCH Level 2 labeling: Enable or disable additional labels.
- Rejection Blocks display: Toggle rejection block visibility.
- Custom RB colors: Define colors for bullish and bearish RBs.
- Invalid RBs (closure beyond zone): Identify invalidated RBs.
- Invalid overlapping zones: Exclude new RBs that intersect with existing ones.
Conclusion
The Rejection Block Indicator serves as an essential tool for recognizing price reversal zones within financial markets. By assessing candle wicks at key price points, it effectively maps rejection block areas on charts. Liquidity-focused traders and ICT practitioners can integrate this indicator into their strategies to enhance decision-making and improve market timing.