HTF Candle 5
- Indicators
- Sopheak Khlot
- Version: 1.0
- Activations: 5
ICT Traders! Here's another cool Indicator that will allow to trade the HTF narrative while focus on price action on your entry timeframes.
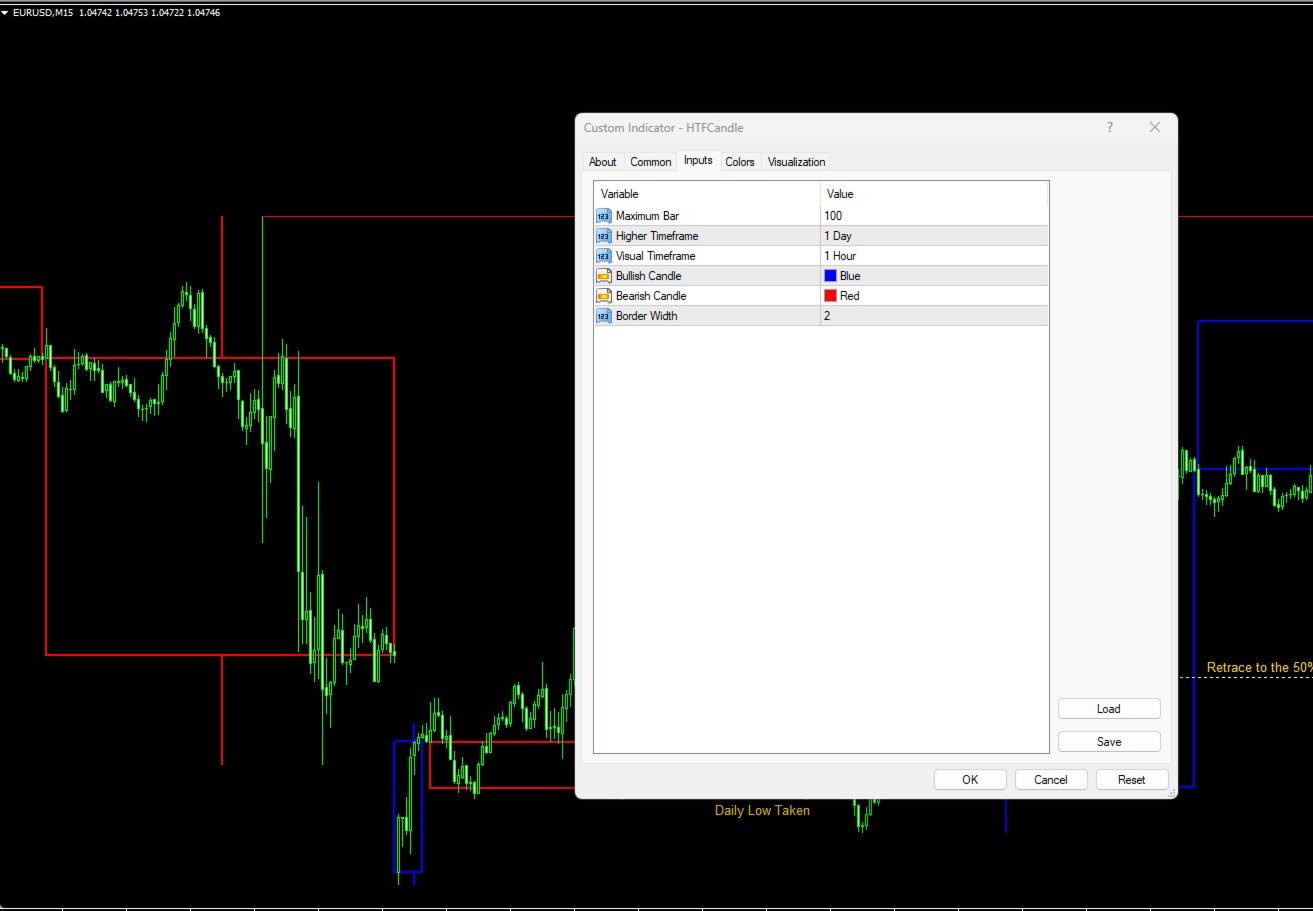
The following are the input for setup the indicator:
- Maximum Bar: The number of HTF bar you want to display
- High Timeframe: the Timeframe which narrative you want to base on and trade from the lower timeframe.
- Visual Timeframe: the largest Timeframe the indicator will print the HTF candles.
- Bullish Candle: The color of the bullish candle
- Bearish Candle: The color of the bearish candle
- Border Width: the width of the HTF candle drawn on the chart.