RSI Dashboard Multi Overbought Oversold Analyzer
- Utilities
- Dominik Mandok
- Version: 7.0
- Updated: 3 July 2020
- Activations: 10
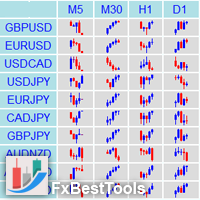
RSI Dashboard is a great tool for quickest possible analysis of multiple currency pairs at the same time in terms of Oversold or Overbought.
All displayed and used by indicator symbols are freely to choose and are specified using a space separated list in parameters you're able to analyze not only predetermined ones, but everything that your broker offers, also commodities, equities, indices, ones with prefixes, suffixes etc.
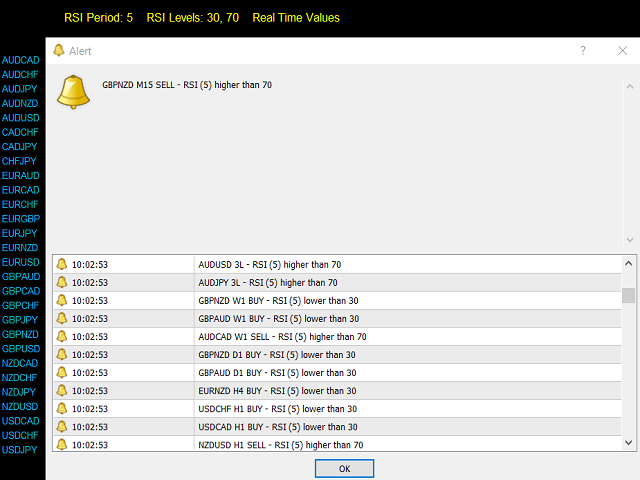
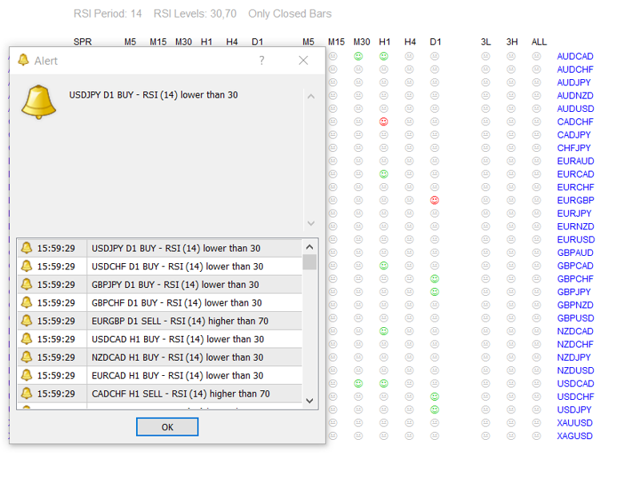
There are 3 types of alerts: alert notifications in the MT4 terminal, push notifications to mobile device and email alerts.
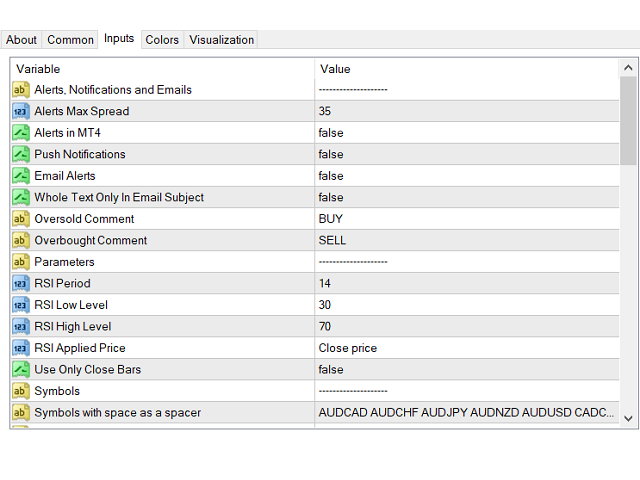
The most important parameters are "RSI Period" and 2 levels: "RSI Low Level" and "RSI High Level", below/above which you get alerts.
You can choose desired price base for calculations("RSI Applied Price") as Close Price, Open Price, Maximum/Minimum Price for the period, Median, Typical or Average Price.
If RSI Period=7, RSI Low Level=20 and RSI High Level=80, you get alerts when RSI with period 7 for a given currency pair on selected timeframes is be below 20 (OS) or above 80 (OB).
Another parameter is "Use Only Closed Bars" - if set to "True" alerts come only from closed candles. If set to "False" - alerts come immediately.
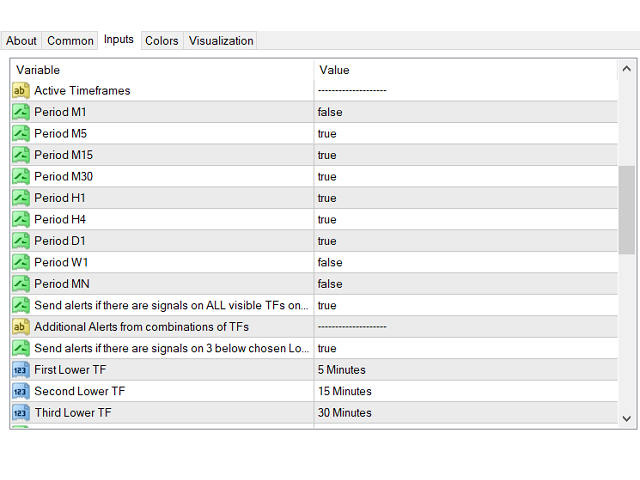
All available MT4 timeframes are possible to choose in parameters of indicator, from M1 (1 Minute) to MN (1 Month). On the screen you see (as columns) selected timeframes and only they will be used for alerts.
You have possibility to choose alerts from all chosen timeframes and two sets of combined timeframes with same conditions - all in Overbought or Oversold zone:
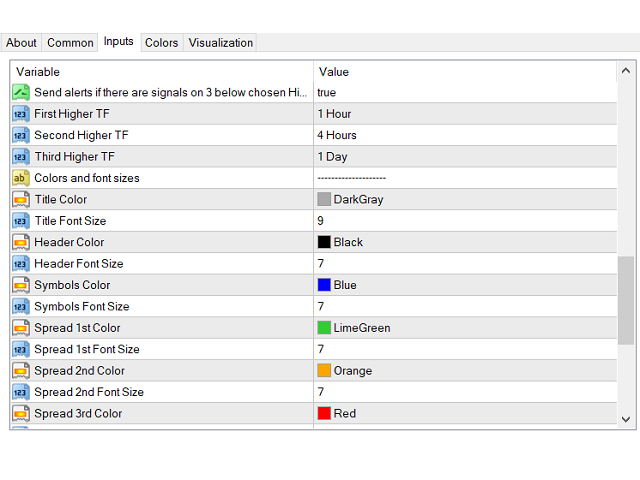
"Send alerts if there are signals on...
- ...ALL visible TFs on pair" - if "True", it just does what it says,
- ...3 below chosen Lower TFs" - if "True", alerts come when conditions match for the below selected 3 timeframes (and they can be also duplicated - so the alerts will be sent when the conditions match only for 2 timeframes).
- ...3 below chosen Higher TFs" - analogical as above.
For all alerts you can add comments that work in two cases: "Oversold Comment" in the case of Oversold (RSI lower than "RSI Low Level" - default comment: "BUY") and "Overbought Comment" when Overbought (RSI value higher than "RSI High Level" - default comment: "SELL"). Information that you receive in emails are: symbol, timeframe, comment, RSI (with period) is lower/higher than (set in parameters) RSI level, eg.: EURUSD M15 BUY - RSI (14) lower than 20 or USDCHF H1 SELL - RSI (7) higher than 75. If you leave blank fields in these parameters you'll get alerts without comments.
You can choose whether the whole text of alert is in the body or in the subject of email messages ("Whole Text In Email Subject"). When set to "True" (with comments off):
Subject: GBPUSD M5 - RSI (14) higher than 70
If "False":
Subject: GBPUSD
Body: M5 - RSI (14) higher than 70
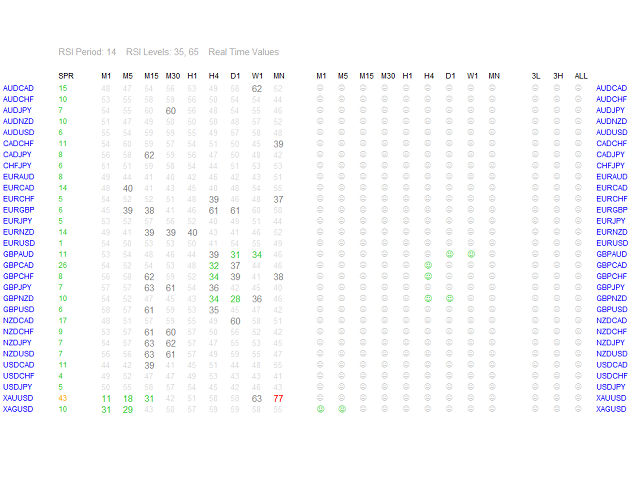
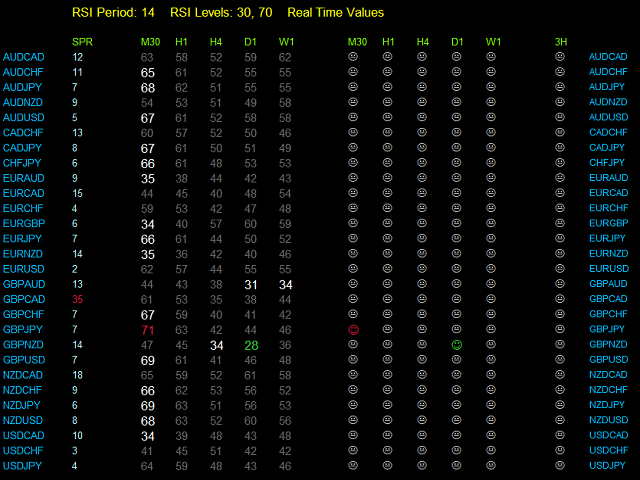
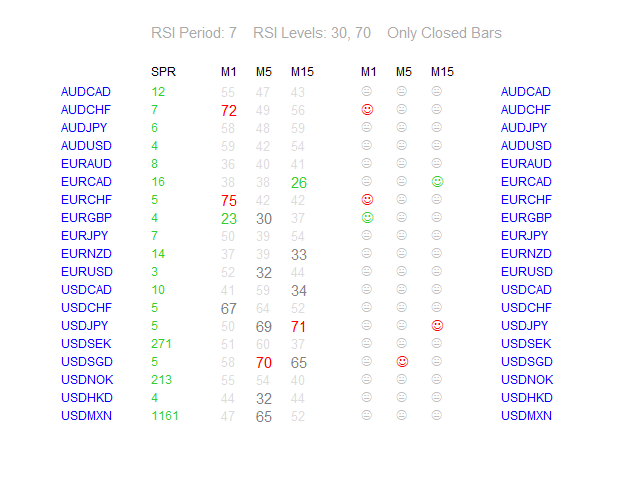
In header there are 4 parameters: RSI Period, 2 RSI Levels and "Real Time Values" or "Only Closed Bars" (depending on "Use Only Closed Bars").
Every color and font size of RSI Dashboard is modifiable. Default colors of values and meaning:
- Green - means that value of RSI is below RSI Low Level.
- Red - RSI is above RSI High Level.
- Gray - RSI value is maximal "Near Level Percent" points above RSI Low Level or below RSI High Level.
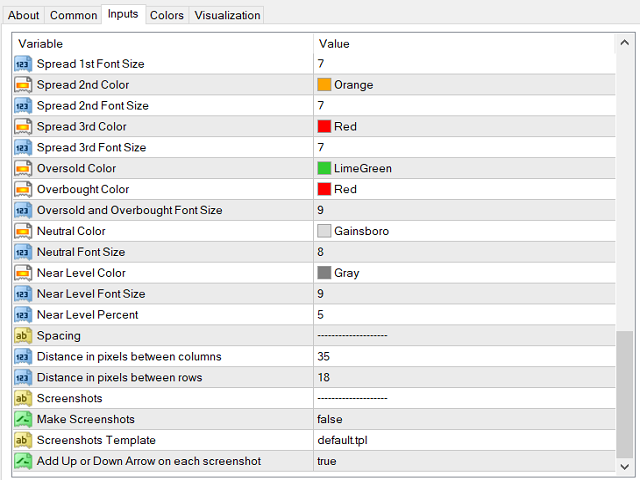
You can also set spacing as "Distance in pixels between columns" and "Distance in pixels between rows".
You can set maximum spread at which the alerts will come ("Alerts Max Spread").
Spread values also can have different colors:
- a) when lower or equal to "Alerts Max Spread",
- b) between 1 and 1.5 times higher,
- c) above 1.5 times higher.
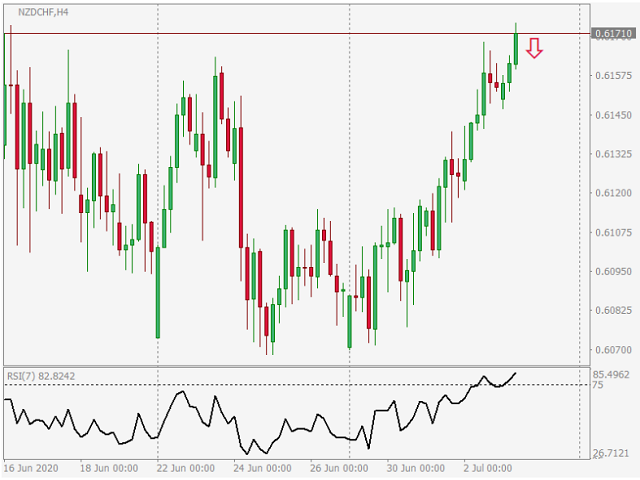
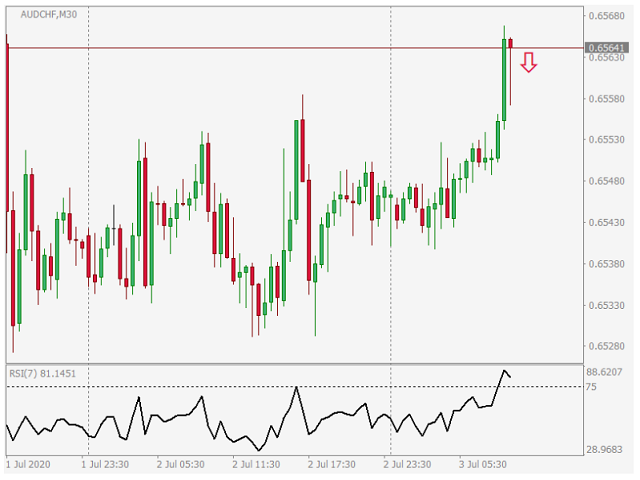
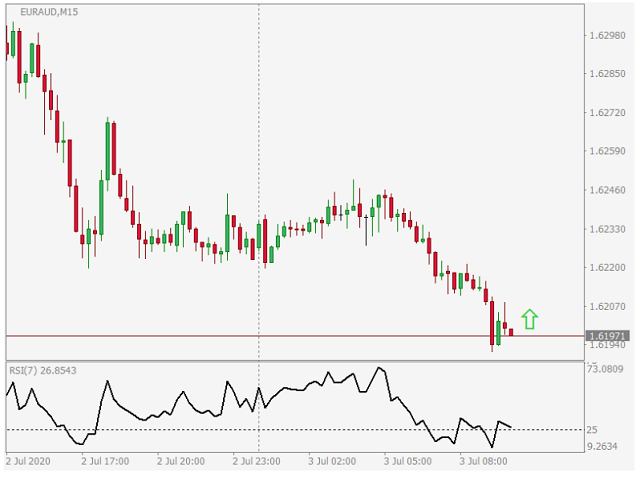
With 3 last parameters you can turn on making screenshots ("Make Screenshots"), choose template for them ("Screenshots Template") and enable or disable visible arrow ("Add Up or Down Arrow...").
Screenshots are saved in your default MT4 "Data Folder"/MQL4/Files/RSI_Dashboard/and their name look like this:
symbol - timeframe in minutes - BUY or SELL (if from 3 Lower or 3 Higher TFs than also 3L or 3H) - year - month - day - hour - minute - second.png
For example: NZDCHF-5-SELL-2020-7-3-10-20-11.png
Your template must be in MT4 "Data Folder"/templates.
I suggest to make a new template with "RSI Dashboard" without colors ("None"), only Background and Foreground set to "White".
Good luck!





























手动好工具!用来提醒。~