Dual Timeframes
- Utilities
- Scott Adam Meldrum
- Version: 2.7
- Updated: 18 February 2025
Overview
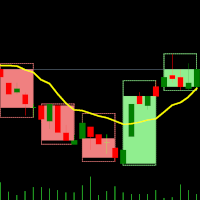
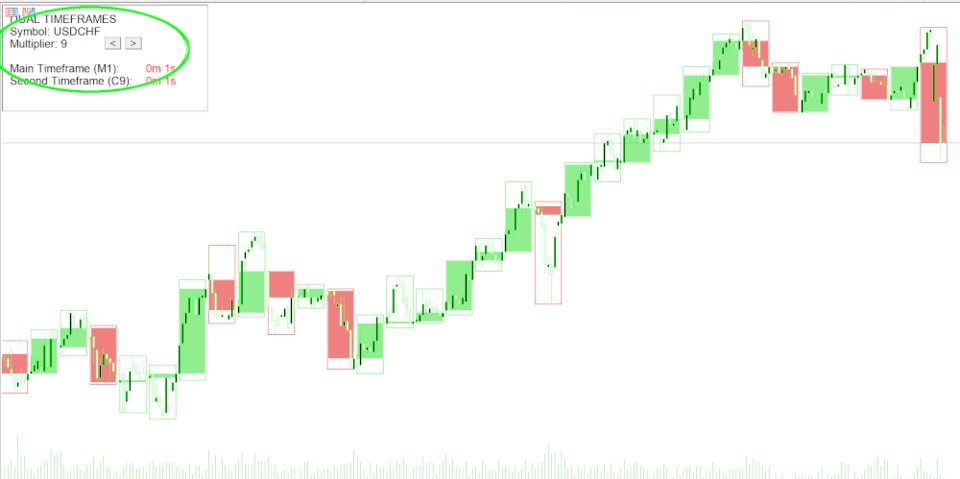
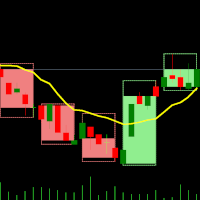
The Candles-in-Candles Indicator is a multi-time frame visualization tool designed to enhance market structure analysis by overlaying higher time frame candles onto a lower time frame chart. Instead of switching between time frames, traders can see how smaller candles behave inside larger ones, improving trade precision, trend identification, and price action clarity.
Unlike standard multi-time frame indicators, this tool allows users to select a base time frame and apply a multiplier, dynamically generating the higher time frame structure. This flexible approach makes it easier to analyze multiple time frames in real time without cluttering the chart with unnecessary indicators.
How the Indicator Works
- Select Your Lower Time Frame: Open the chart on the time frame you want to analyze (e.g., M1, M5, M10).
- Apply a Multiplier: Choose a multiplication factor to determine the higher time frame candle structure.
- Example:
- M1 chart with a 5x multiplier → Displays M1 candles inside M5 candles.
- M10 chart with a 6x multiplier → Displays M10 candles inside H1 candles.
- Example:
- Higher Time Frame Candles Appear: The indicator plots the OHLC (Open, High, Low, Close) of the selected higher time frame over the lower time frame chart while maintaining real-time updates.
Each higher time frame candle consists of:
✔ Outer Boxes (High-Low Box) – Represents the highest and lowest price within the higher time frame period.
✔ Inner Boxes (Open-Close Box) – Represents the opening and closing prices of the higher time frame candle.
✔ Real-Time Updates – The last active candle updates dynamically as price moves within the current higher time frame period.
How to Test the Indicator
-
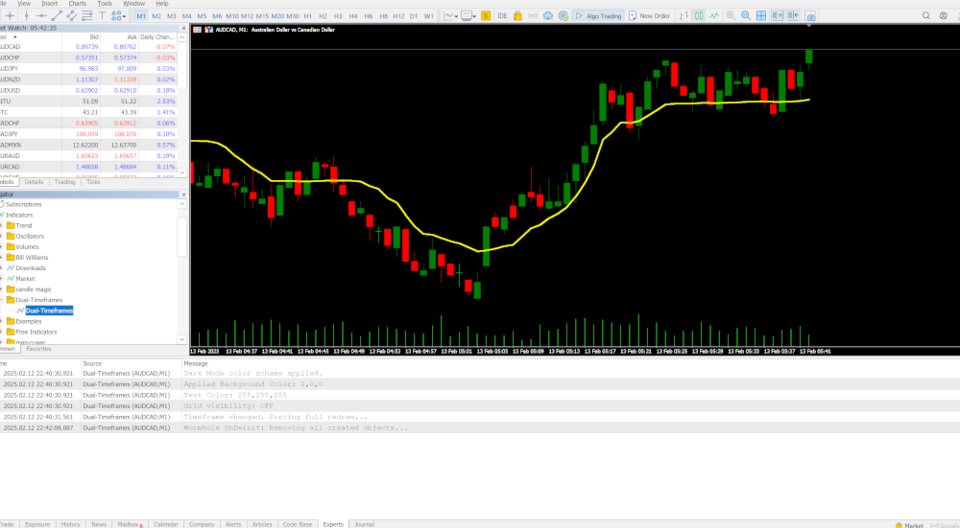
Apply the Indicator to a Chart:
- Open an M1 chart (or any lower time frame chart).
- Drag and drop the Dual Time Frame Indicator onto the chart.
-
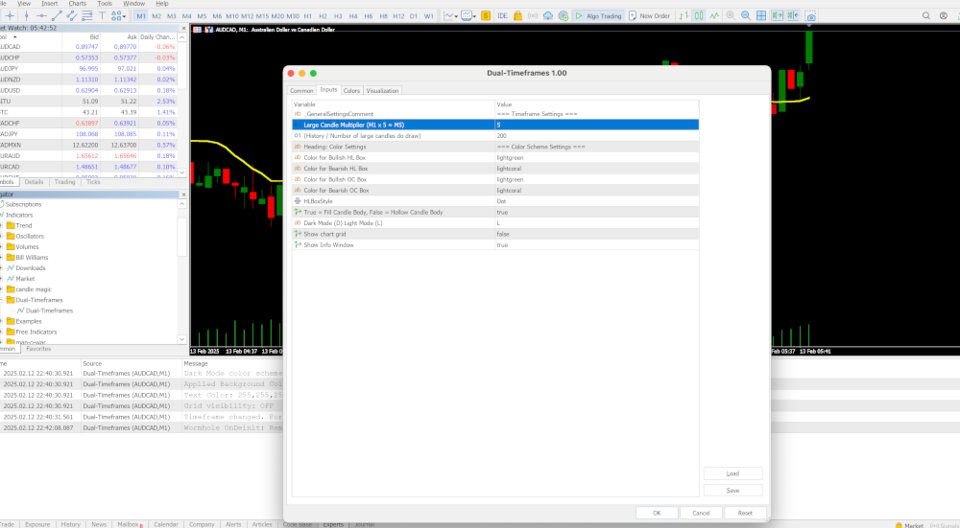
Select the Period Multiplier:
- The default Period Multiplier is set to 5.
- If applied to an M1 chart, this means you will see M1 candles inside M5 candles.
- If applied to an M10 chart with a multiplier of 6, it will display M10 candles inside H1 candles.
- Click OK to confirm settings.
-
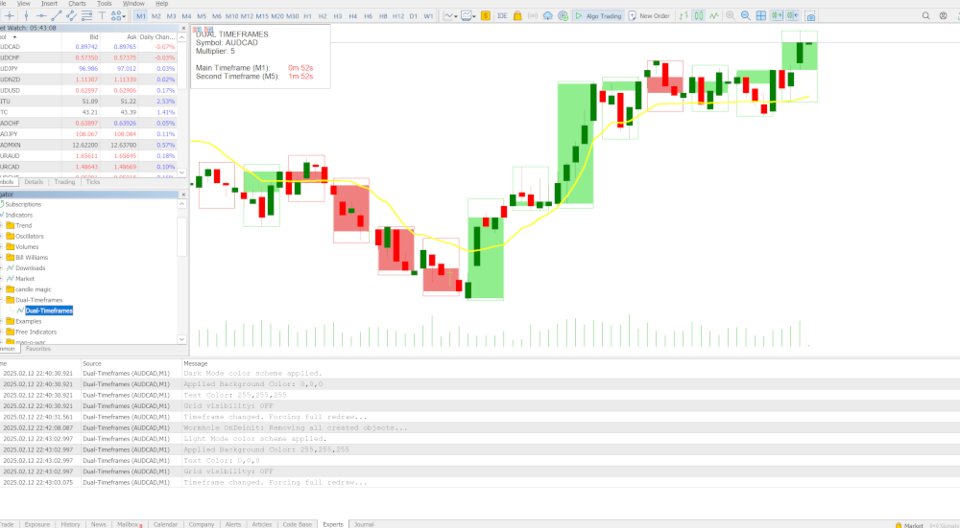
Observe the Indicator Display:
- You will now see both the lower time frame candles and the higher time frame candle structure overlaid.
- The outer boxes represent the High and Low of the higher time frame.
- The inner boxes represent the Open and Close of the higher time frame.
- The last (current) higher time frame box updates in real time.
Customization Options
The indicator includes multiple customizable settings to enhance visual clarity and usability:
- Grid Display: Enable or disable a grid for a clearer view of price structure.
- Info Window: Show or hide additional details about the current higher time frame candle.
- Background Color: Adjust shading for better contrast and readability.
- High-Low Box Color: Customize the color of the outer box representing the High and Low range.
- Open-Close Box Color: Modify the color of the inner box representing the Open and Close levels.
Trading Benefits
- Enhanced Multi-Time Frame Analysis: View multiple time frames simultaneously without switching charts.
- Stronger Trend Confirmation: Align lower time frame trades with higher time frame market direction.
- Improved Support & Resistance Identification: Higher time frame candle highs/lows provide strong reference levels.
- Refined Trade Entries & Exits: See how price interacts within larger candle structures for better timing.
- Reduces Market Noise: Helps filter out false signals by focusing on higher time frame price behavior.
Why Use This Indicator?
✔ Multi-Time Frame Confluence – Get a broader market view while trading lower time frames.
✔ Trade with More Precision – Identify breakouts, reversals, and rejections using higher time frame levels.
✔ No Need for Chart Switching – Saves time and reduces analysis complexity.
✔ Works on Any Time Frame & Market – Fully adaptable for different trading styles.
This Candles-in-Candles Indicator is a must-have tool for traders looking to merge short-term trading with long-term structure in a simple, efficient, and highly customizable way.
If you find this useful, follow me and post a review, check out the wormhole indicator >> wormhole time


























User didn't leave any comment to the rating