Maximus Forex Gladius usdcad divergence patterns
- Experts
- Damiem Marchand De Campos
- Version: 4.0
- Updated: 14 April 2025
- Activations: 10
EXPERT for YOUR OWN ACCOUNT - This Expert Advisor has been designed, developed and optimized especially for your own use.
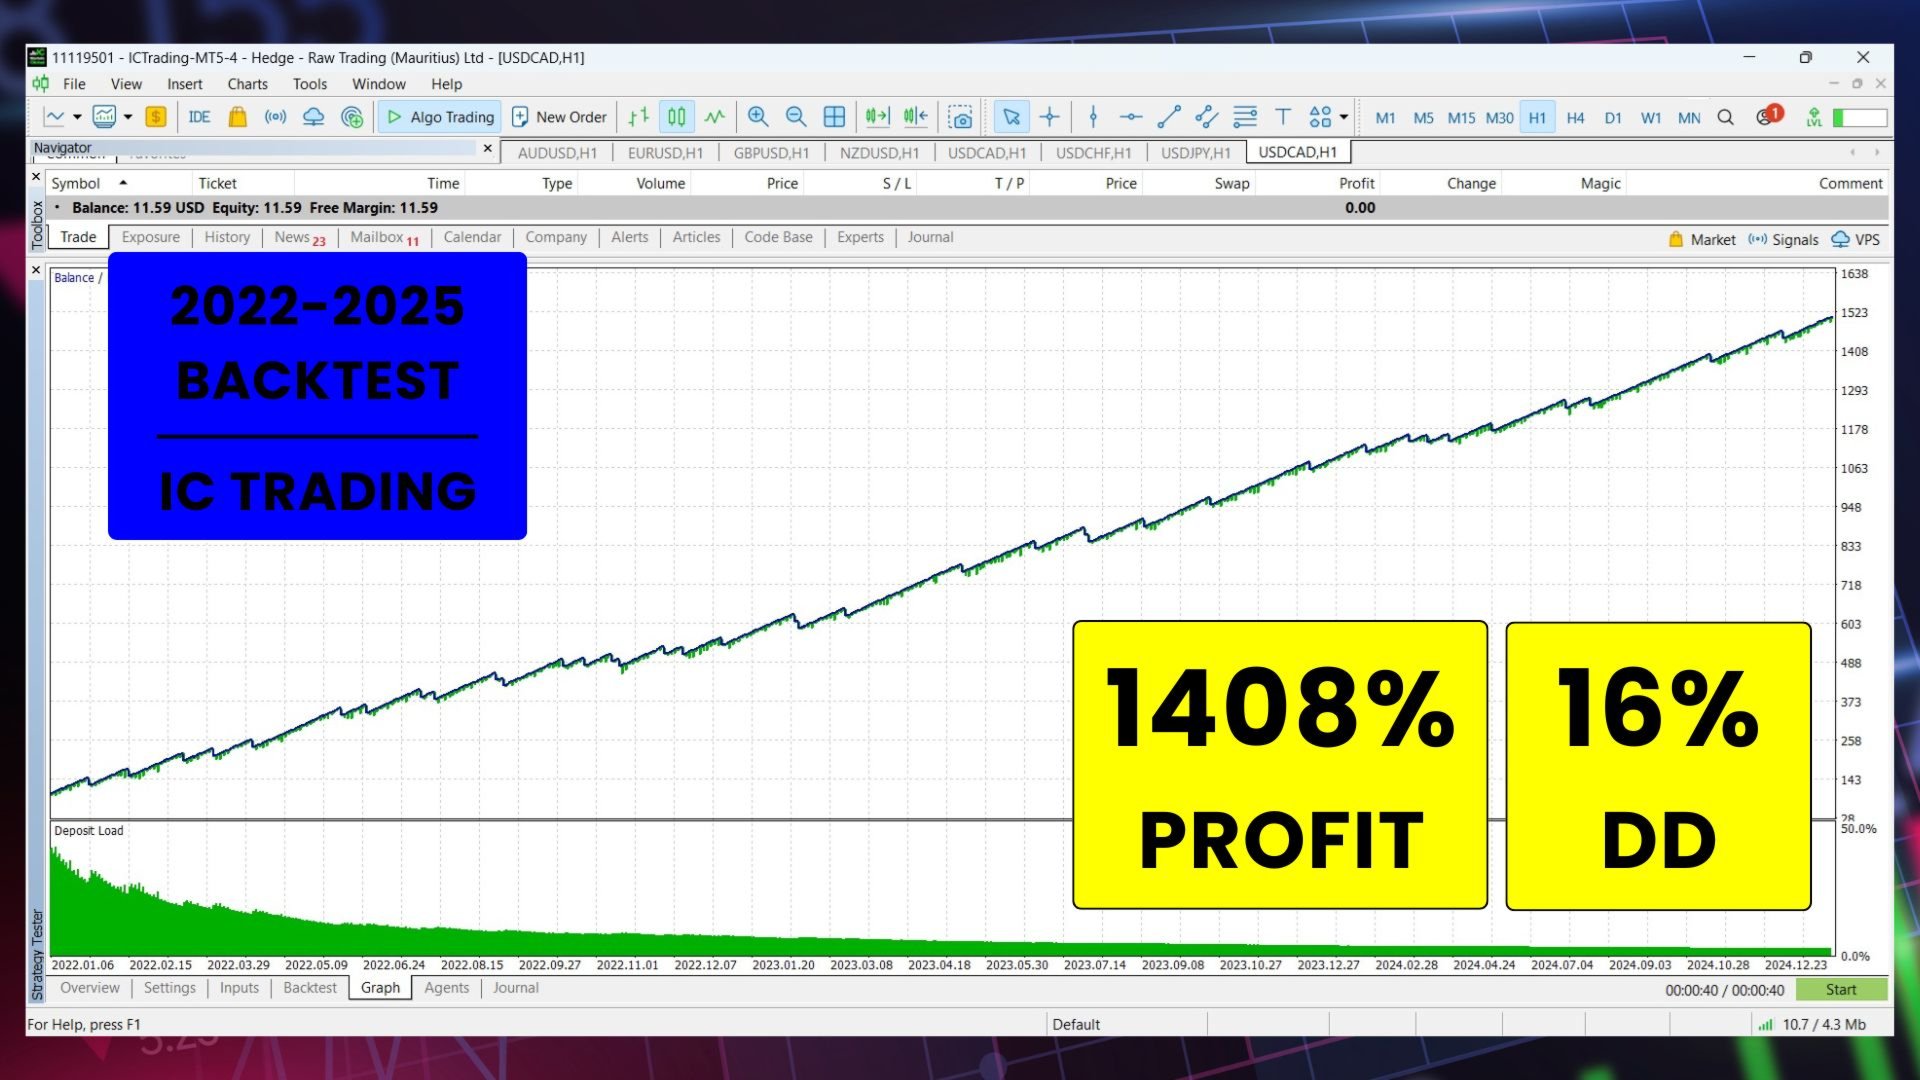
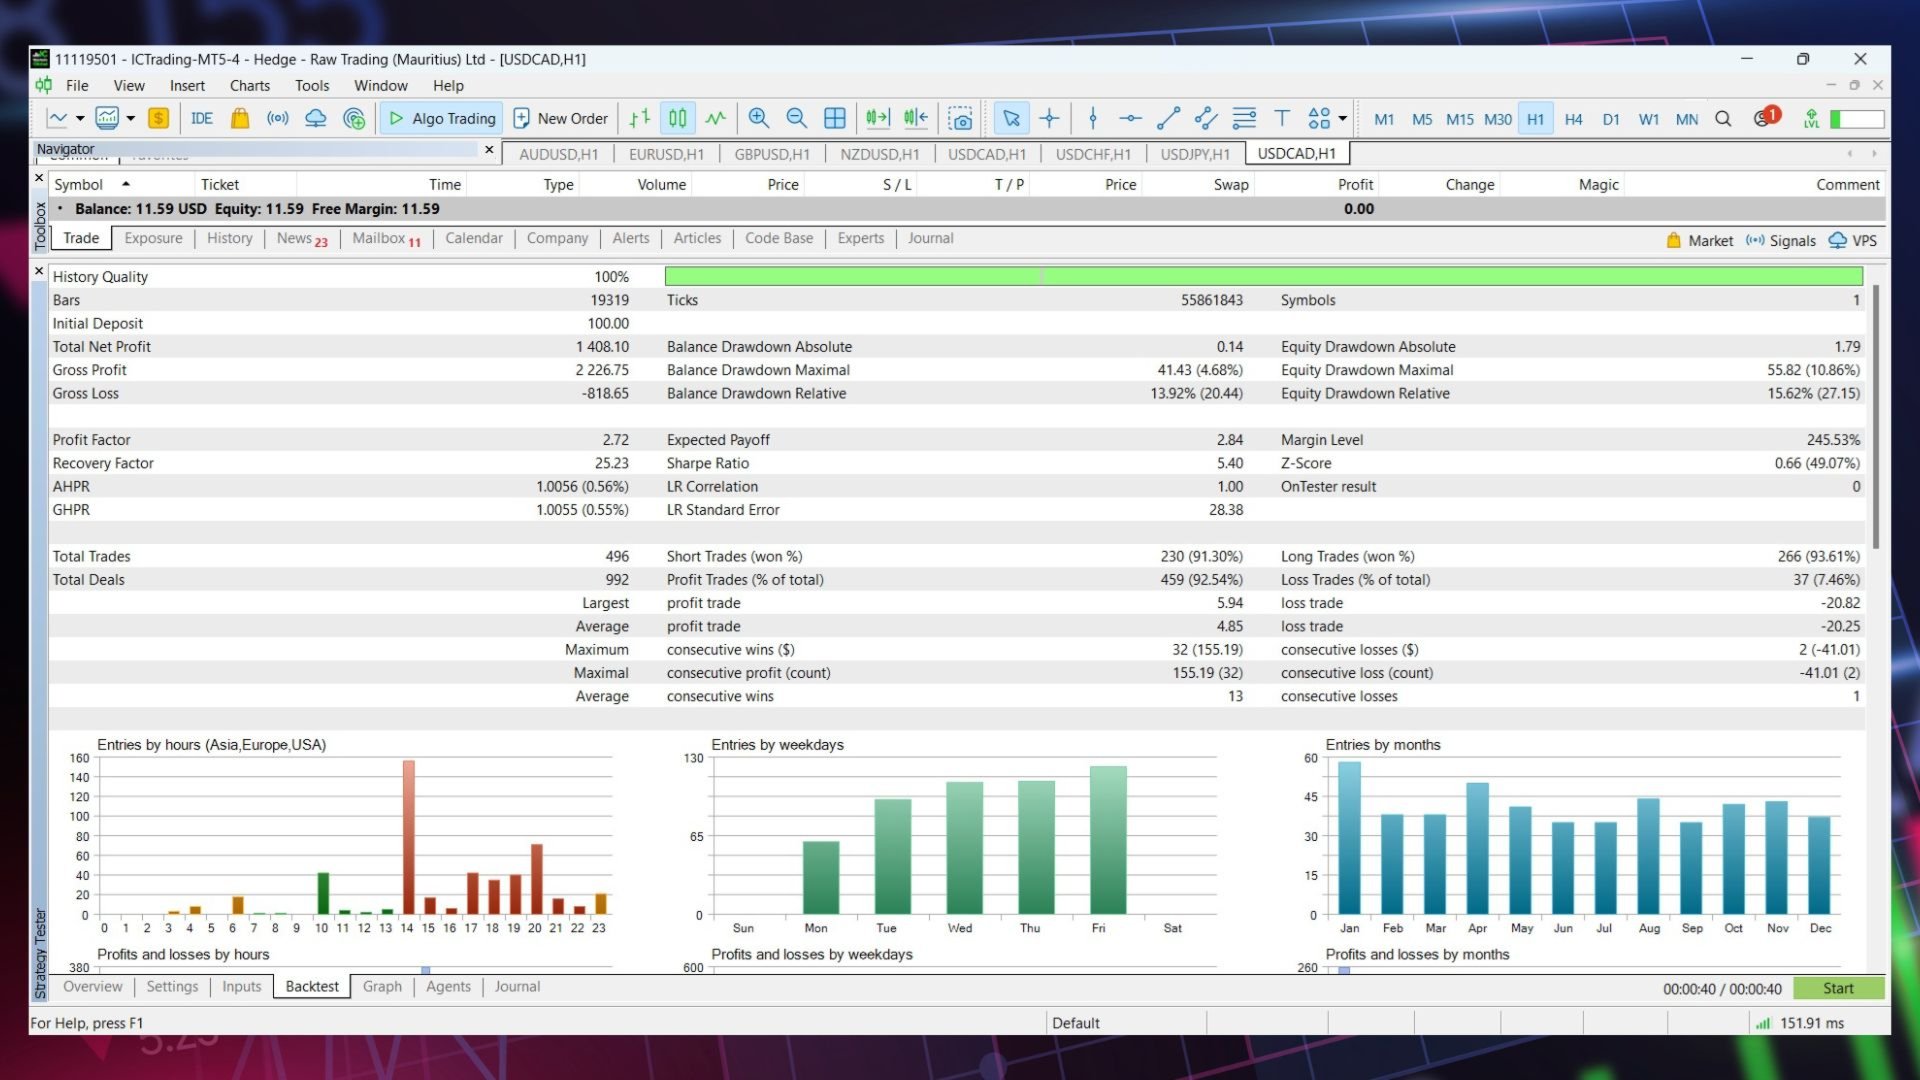
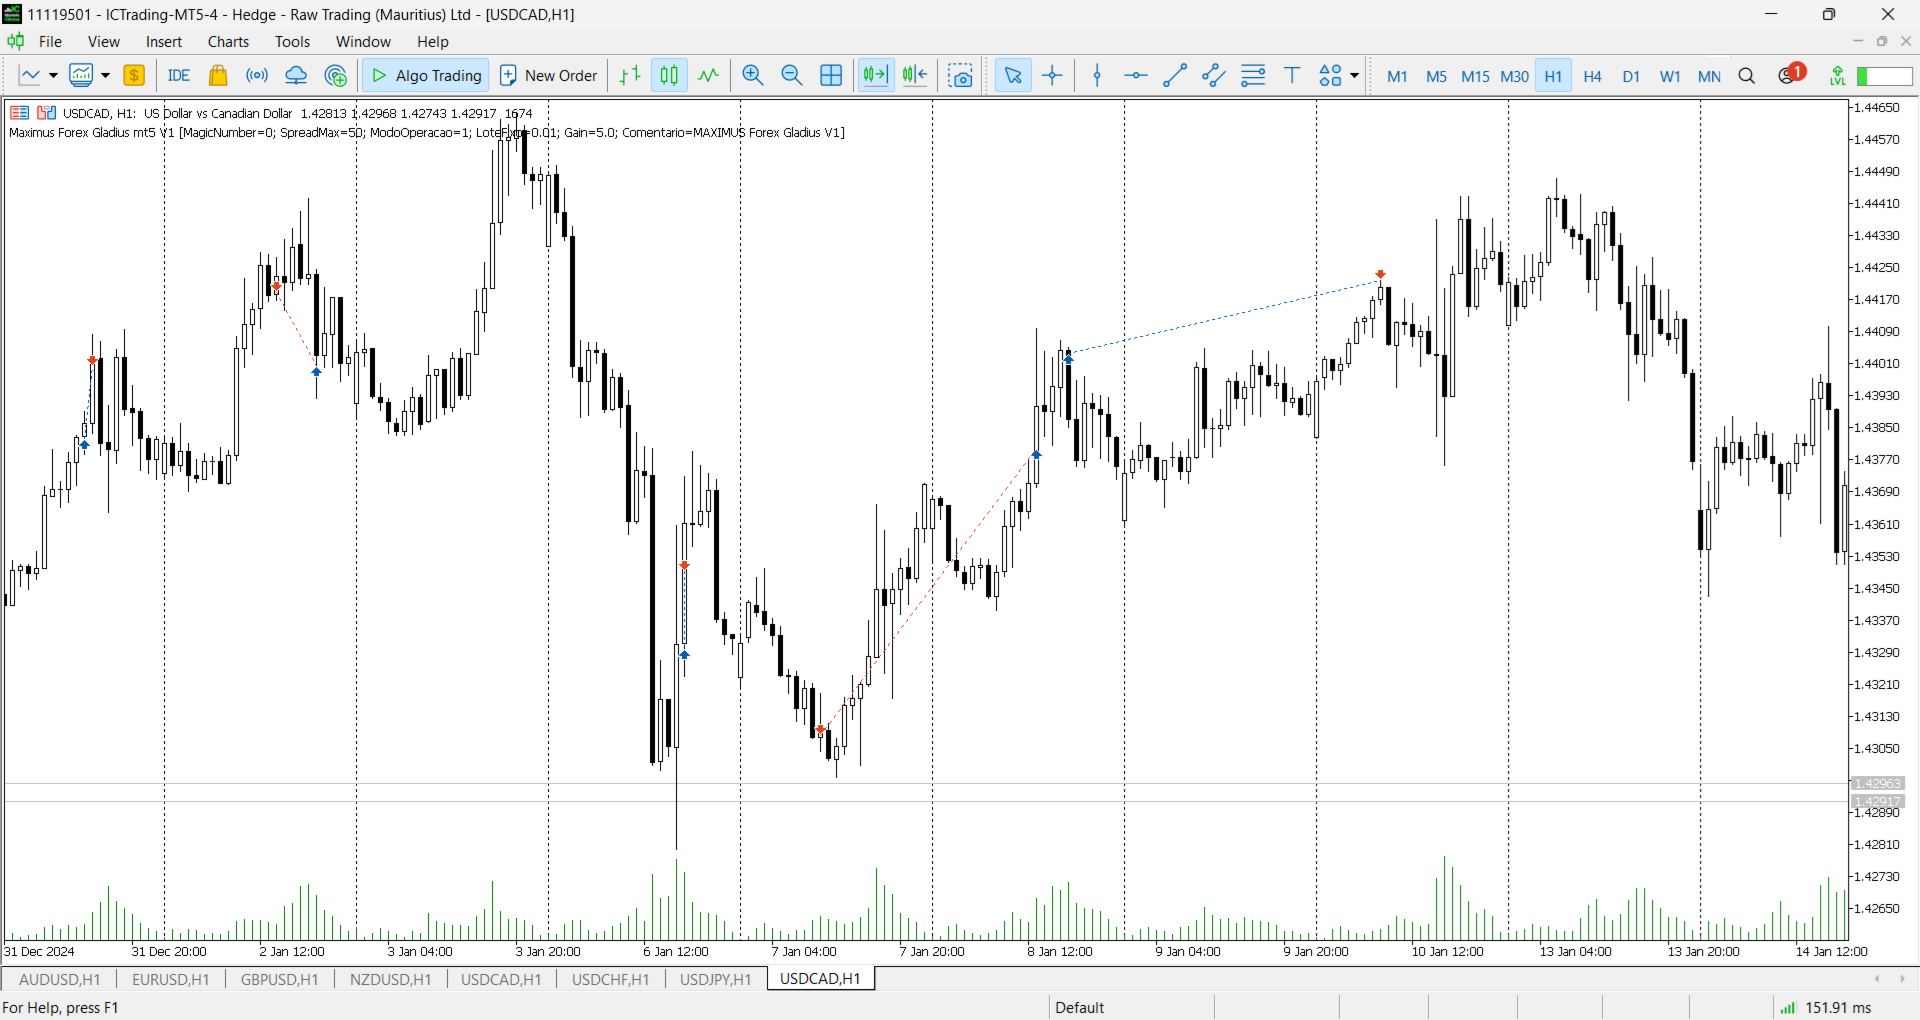
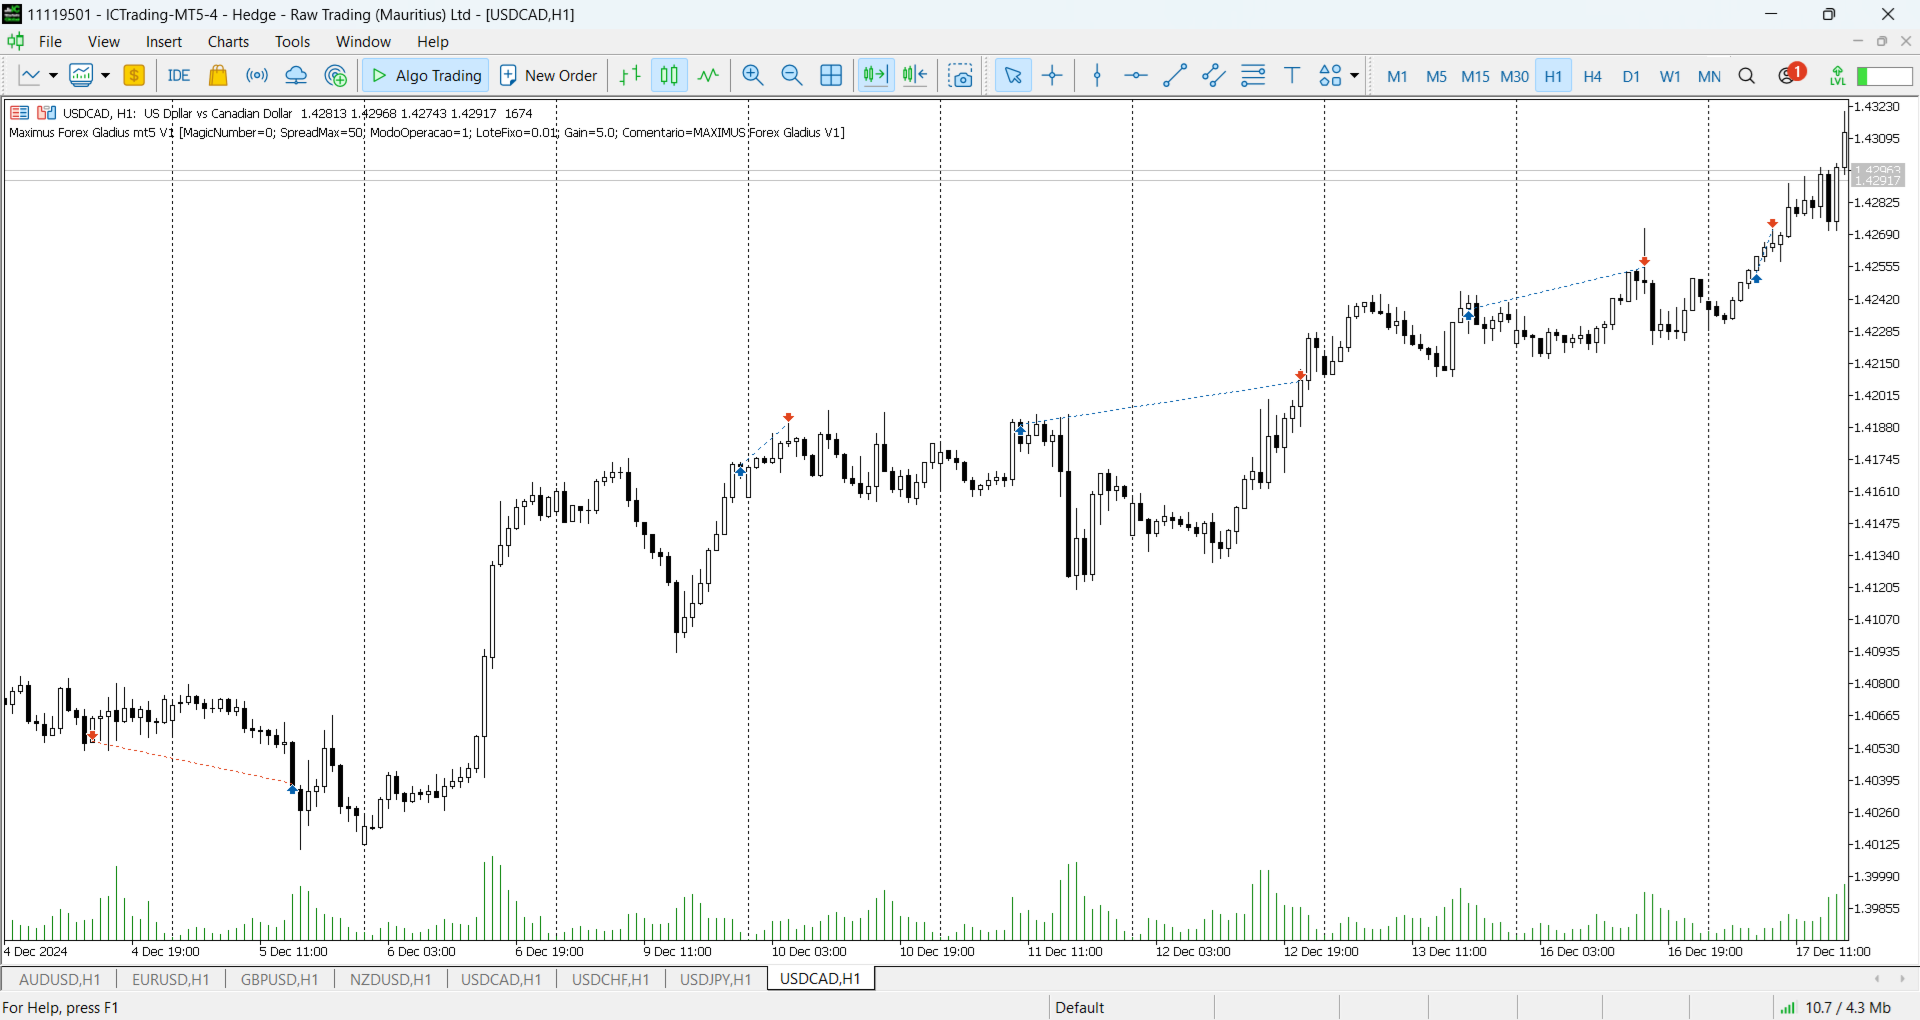
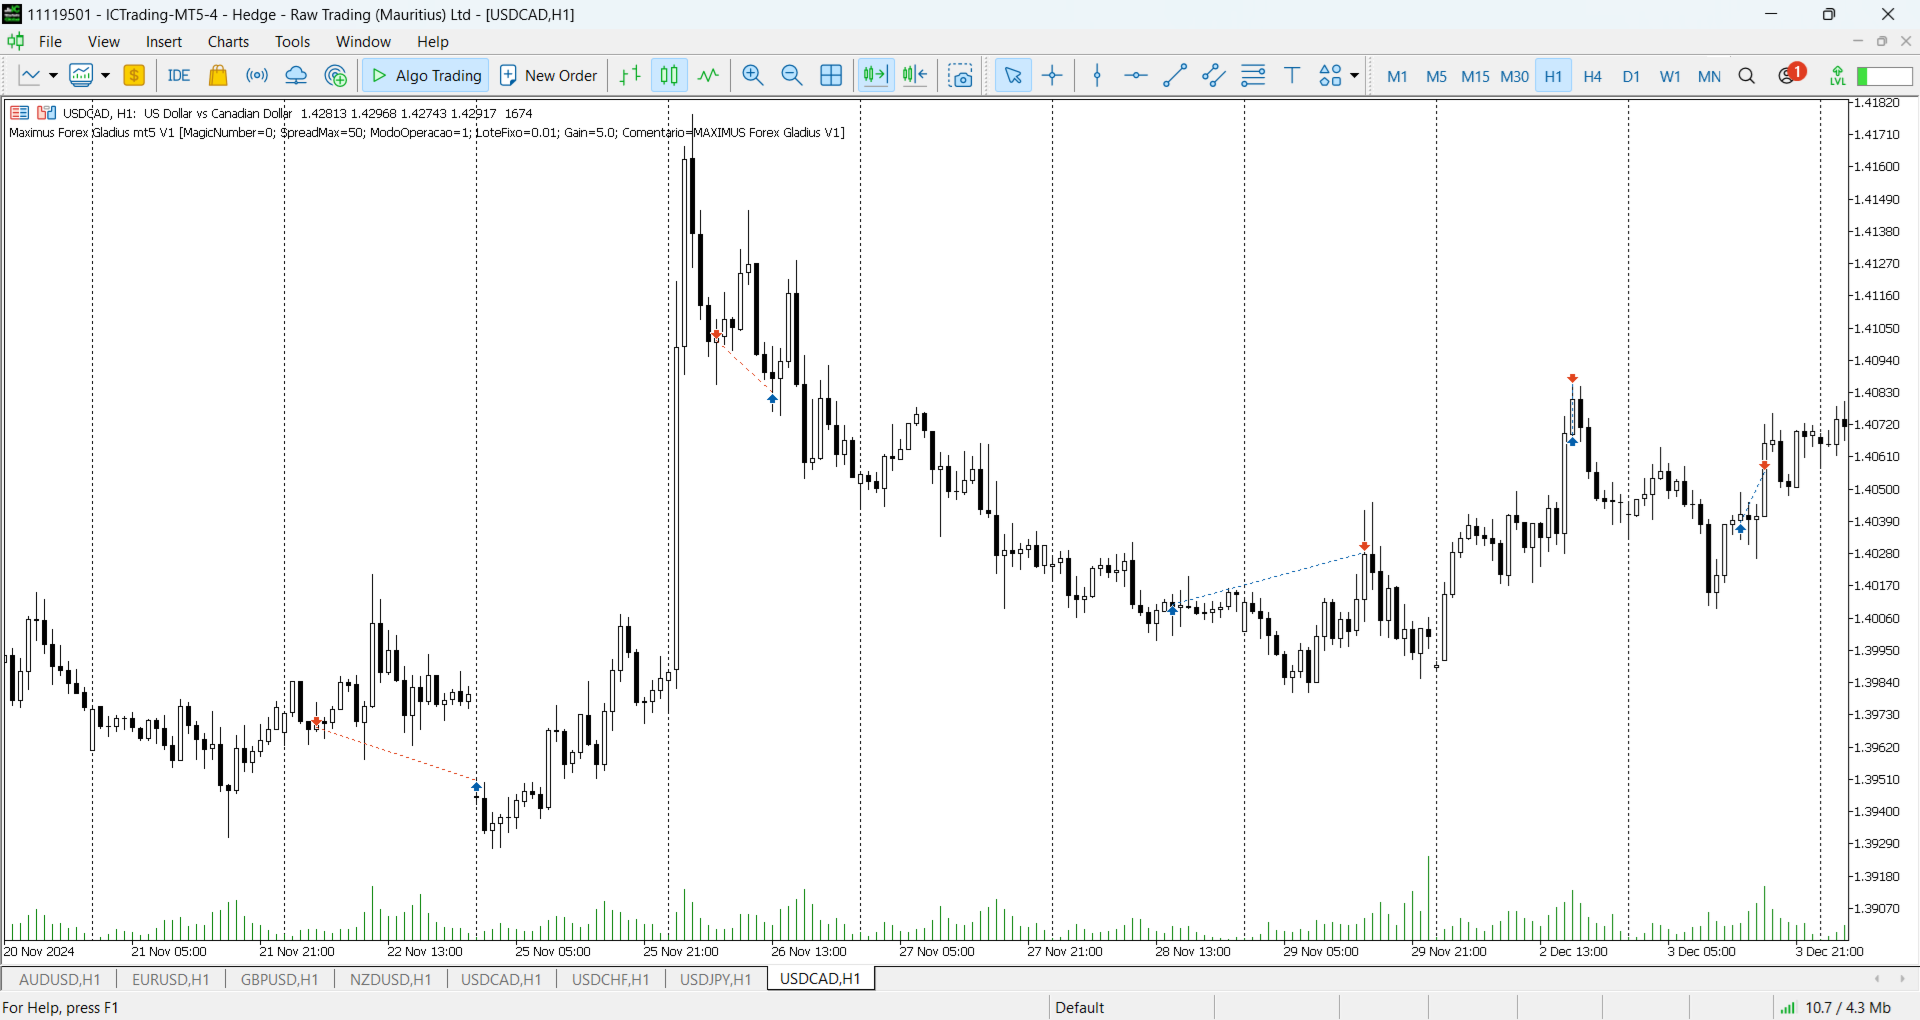
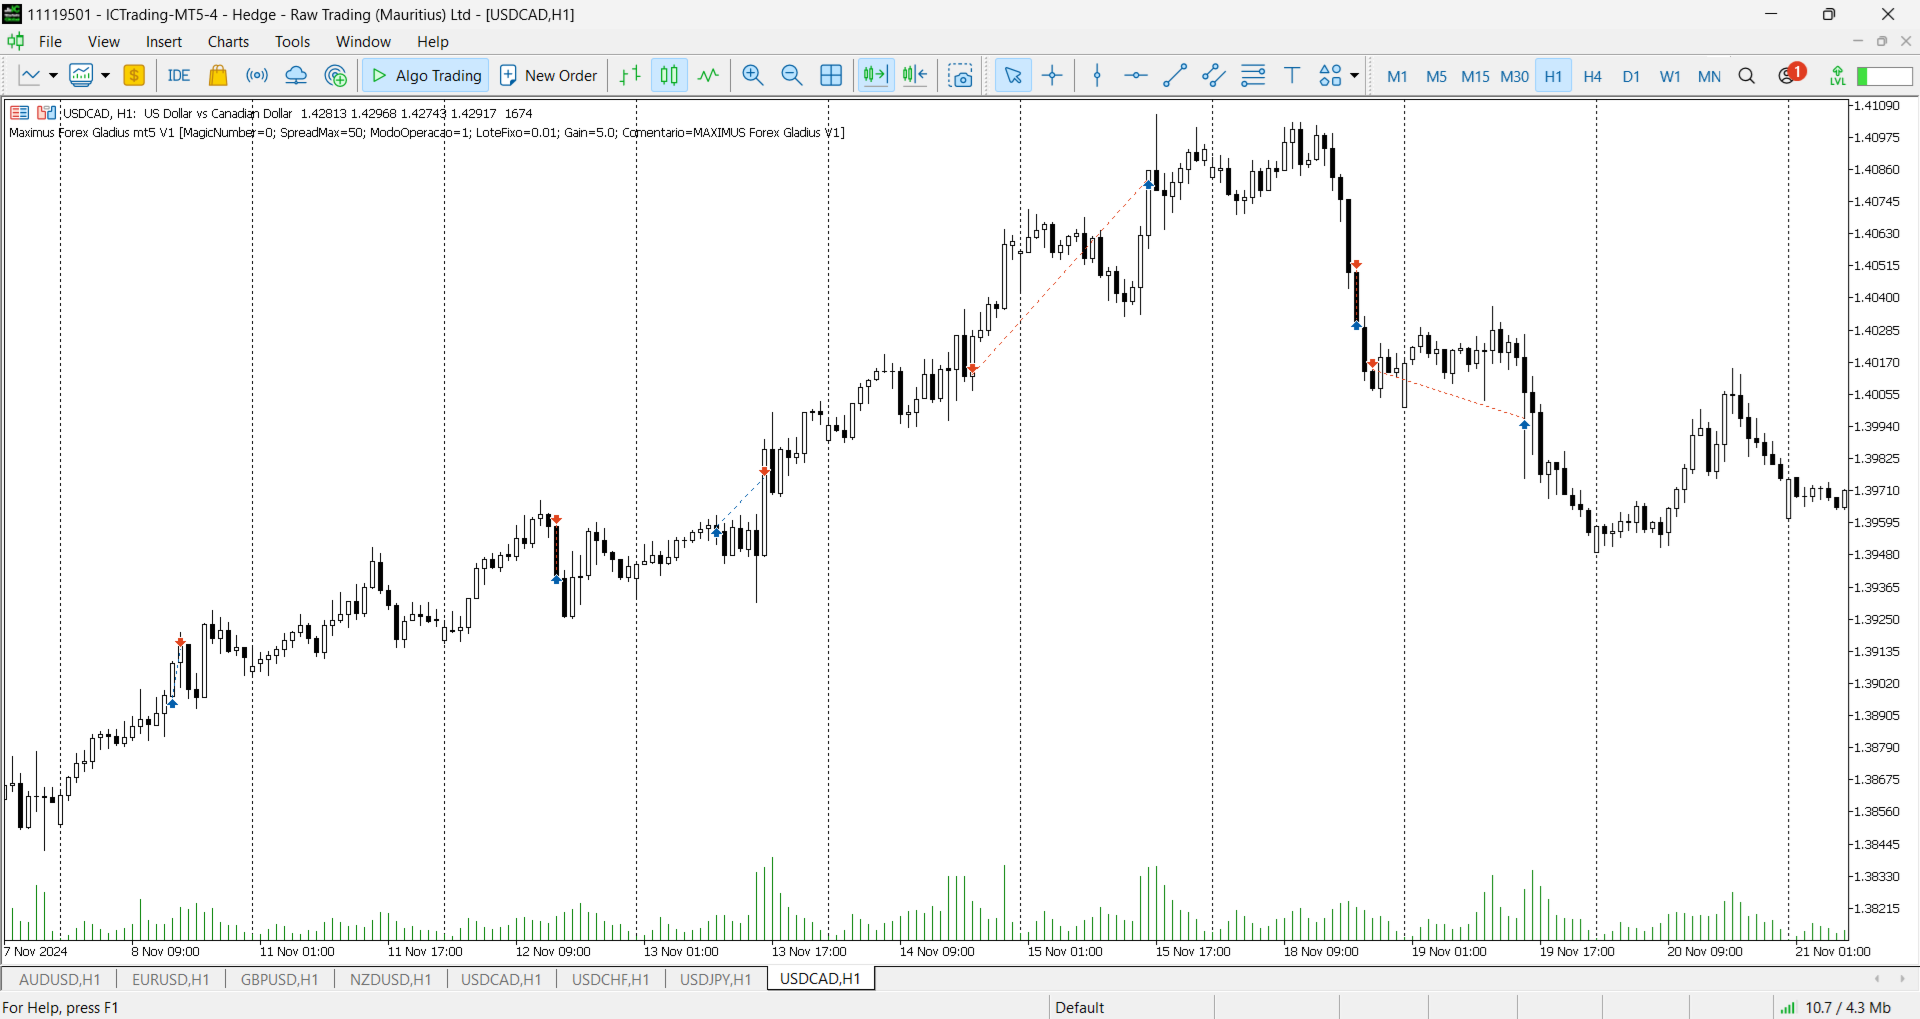
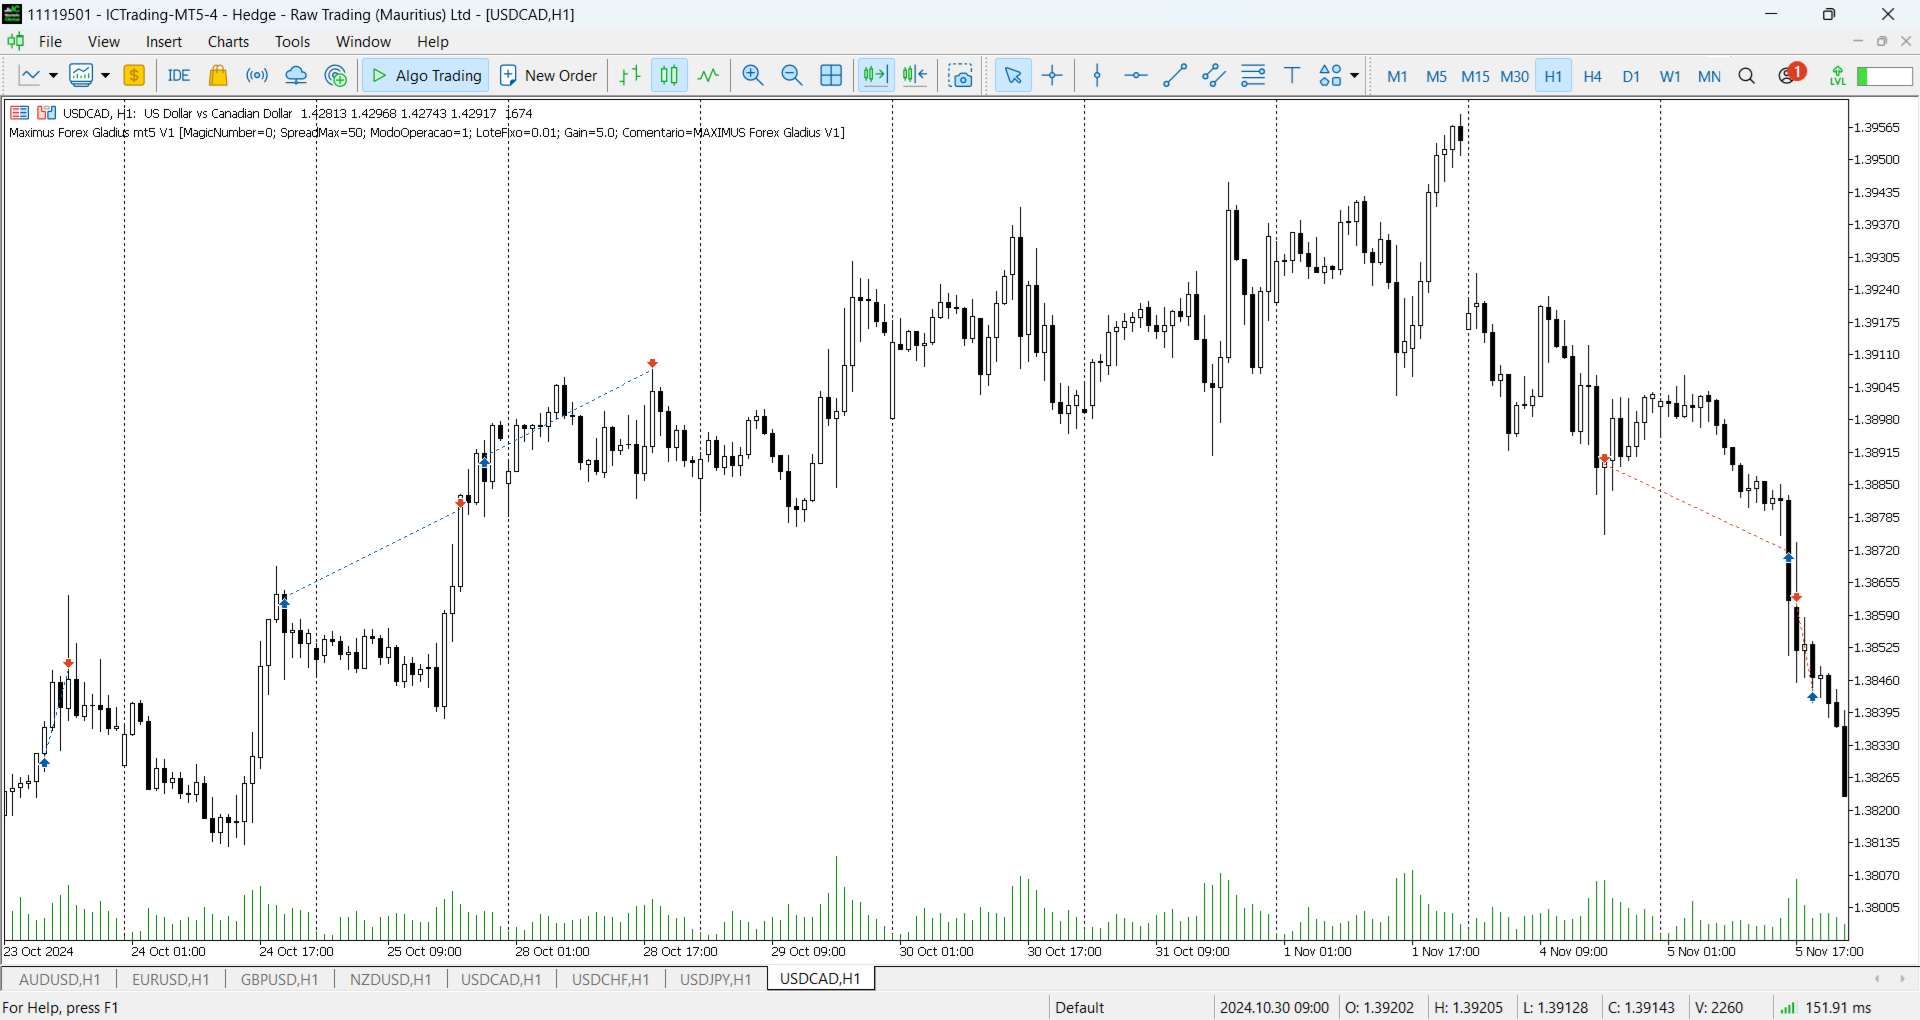
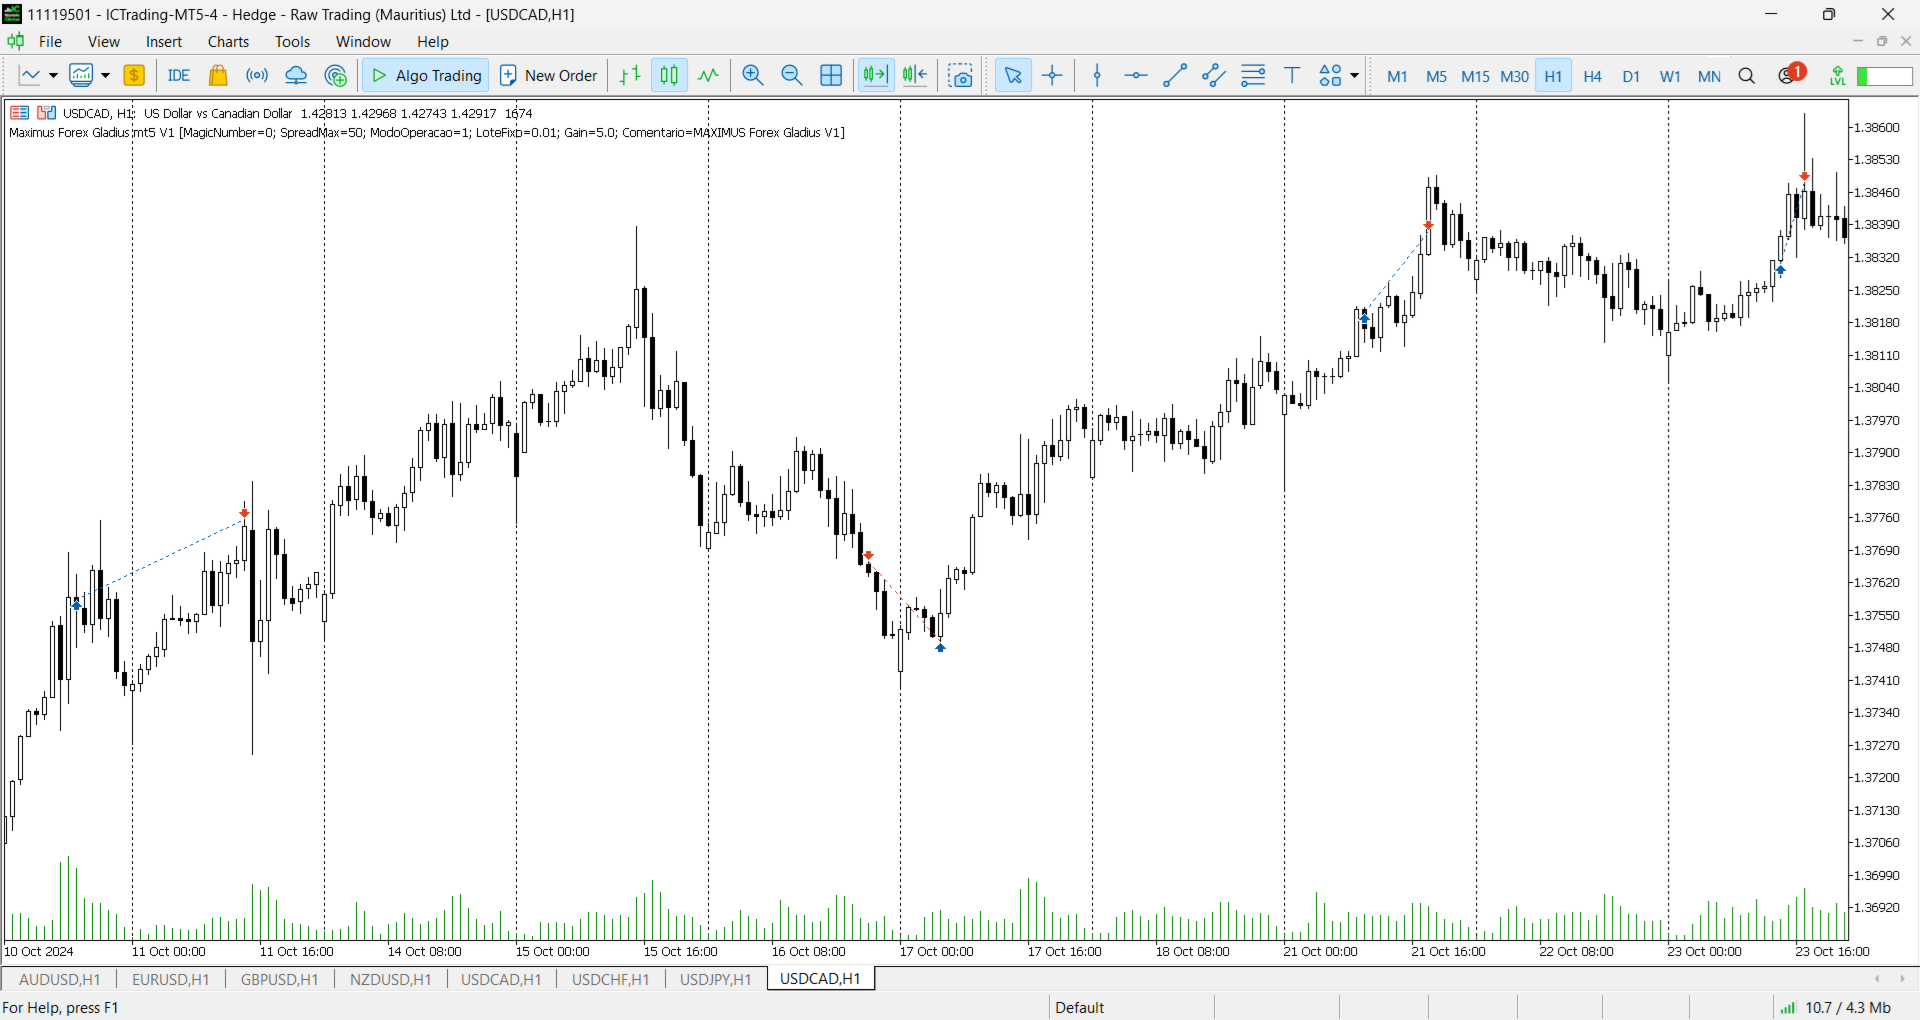
This is a powerful Expert Advisor (EA) for taking advantage of the best and biggest opportunities in the USDCAD symbol, in all phases of the trend, from start to finish, on the H1 timeframe and on the MT5 platform.
Impressive accuracy, performance and consistency in backtests over the last 3 years.
The EA works like a hunter, a sniper, analyzing the price movement, its strength and trend, patiently waiting for the best opportunities to do its job with extreme precision.
The EA is based on the DIVERGENCE PATTERNS strategies and uses many native and proprietary indicators as well.
Key features:
This EA continuously analyzes the price movement and when it identifies the best opportunities, it sends a single limited order, thus opening a position.
Every position has a fixed Target and a fixed Stop Loss set from the beginning.
The lot is also calculated and determined automatically from the inputs.
Security Always: This EA is very SAFE, it does NOT use Grid, Martingale or Hedge strategies. All trades have only one entry per trade and are protected by a hard stop loss.
This EA is its very strong RESILIENT to high-impact NEWS (FOMC, FED, Payroll, ECB, BOE, SNB, BOC, BOJ, RBA or RBNZ) or any other abrupt price movements. You don't need to do anything, the EA protects itself.
How to install:
- Download this EA,
- Make sure that all pairs (USDCAD) are in the Market Watch (Ctrl+M),
- Have the (USDCAD) chart on the H1 timeframe,
- Place this EA on the (USDCAD) chart,
- Check and adjust the parameters as shown below,
- Click OK to activate,
- Done!
INPUTS for YOUR OWN ACCOUNT - If you want to customize, there are these parameters:
- [#01] Magic Number,
- [#02] Spread Max,
- [#03] Operation Mode (Fixed Lot or Target),
- [#04] Fixed Lot,
- [#05] Target (USD),
- [#06] Comment.
I am committed to continuously optimize and improve all my EAs to give you and me the best possible trading experience. You will receive all UPDATES for FREE and I will also add new features to the EA based on customer suggestions.
The main strategy of this expert is - DIVERGENCE PATTERNS - by Charles Dow
Divergence happens when the price of an asset moves in one direction, but an indicator, like RSI or MACD, moves in the opposite direction. This difference between price and indicator can signal that the current trend might change soon. Experts use divergence patterns to spot potential reversals or continuations in the market.
For example:
-
In a bullish divergence, the price makes lower lows, but the indicator makes higher lows. This means that even though the price is dropping, the selling pressure is getting weaker, and an upward move might be coming.
-
In a bearish divergence, the price makes higher highs, but the indicator makes lower highs. This suggests that the buying strength is decreasing, and the price might drop soon.
- In trending markets: Hidden divergence patterns help confirm that the trend will continue. For instance, in an uptrend, a bullish divergence might indicate that the trend is still strong.
- In sideways markets: Regular divergence is useful for spotting reversals when the price is moving within a range without a clear direction.
REGULAR BULLISH DIVERGENCE
The formation of lower lows in the price and higher lows in the oscillator is called bullish divergence. This type of divergence of the oscillator will reverse the price from a bearish trend into a bullish trend. Bullish divergence is an indication of a trend reversal.
REGULAR BEARISH DIVERGENCE
The formation of higher highs in the price and lower highs in the oscillator is called bearish divergence. It means that buyers are weakening, and sellers are preparing to enter the market. It will cause the price to reverse trend from bullish into bearish. Bearish divergence is a sign of trend reversal
HIDDEN BULLISH DIVERGENCE
If the oscillator forms a lower low but the price forms a higher low on the chart, then this type of divergence is called hidden bullish divergence. It indicates buyers are becoming stronger and the previous bullish trend will continue. Hidden bullish divergence is a sign of trend continuation.
HIDDEN BEARISH DIVERGENCE
If the oscillator forms a higher high and the price forms a lower high, then this type of divergence is called hidden bearish divergence. It will cause the bearish trend to continue because of more sellers returning to the market. Hidden bearish divergence is an indication of trend continuation.
This expert also uses a basket of indicators as a basis, the main one being a unique and exclusive indicator, created and optimized by the developer.