ATR Power Levels Smart Support Resistance
- Indicators
- Ahmad Kazbar
- Version: 1.6
- Updated: 10 February 2025
- Activations: 5
🚀 ATR Power Levels Smart Support Resistance Indicator!
🔍 What makes this indicator unique?
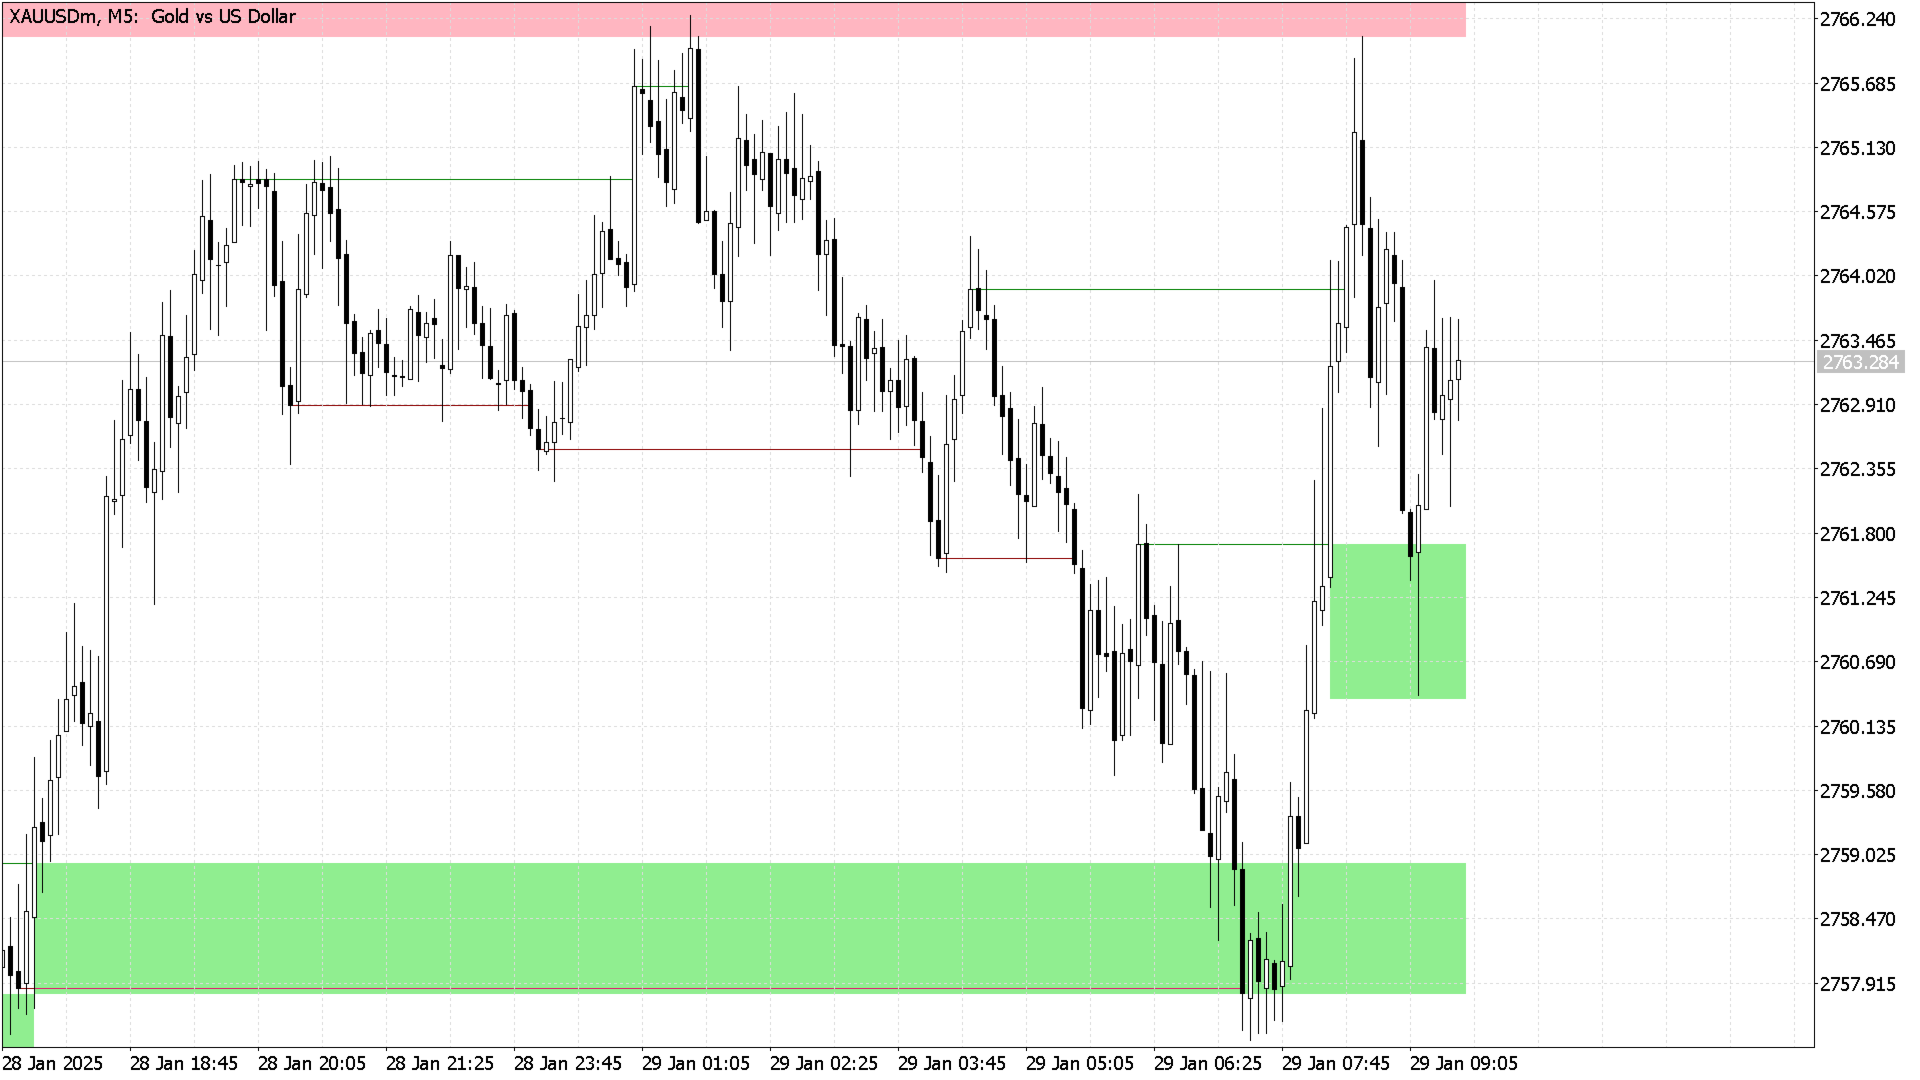
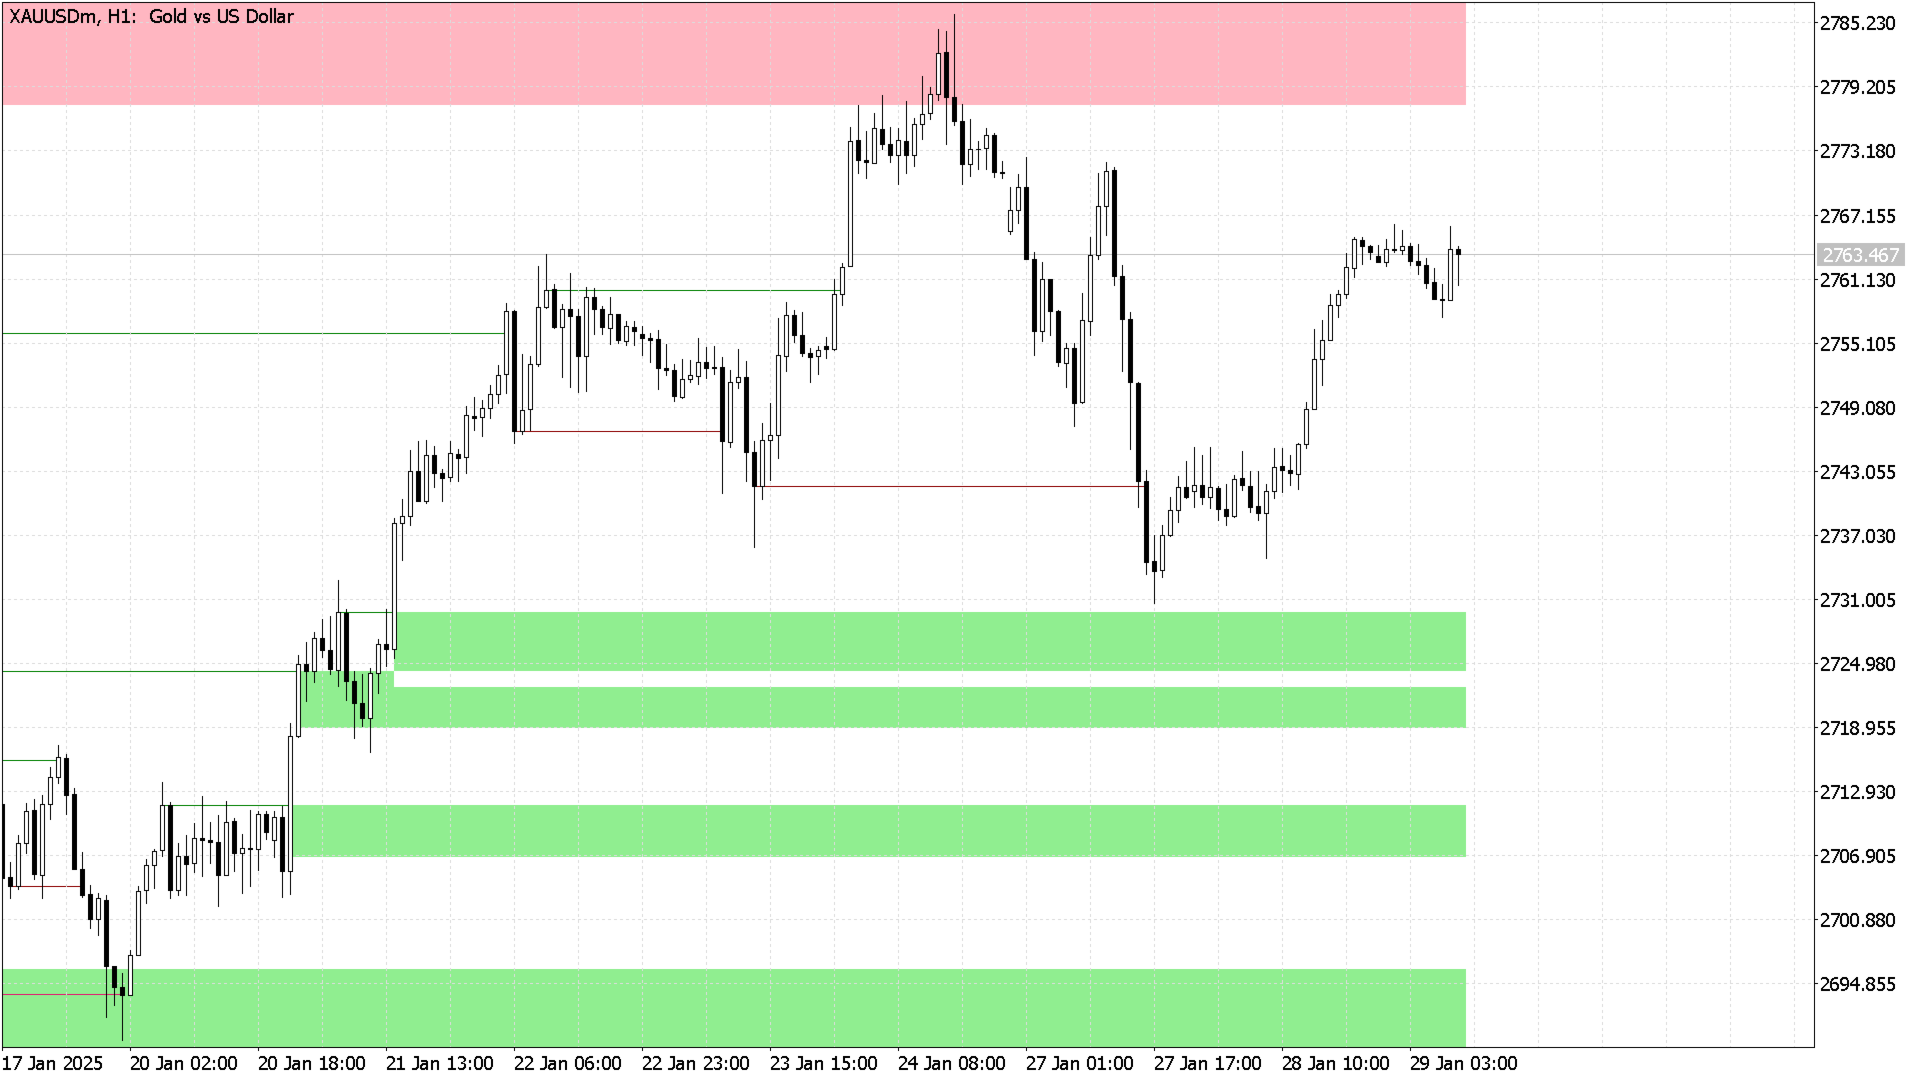
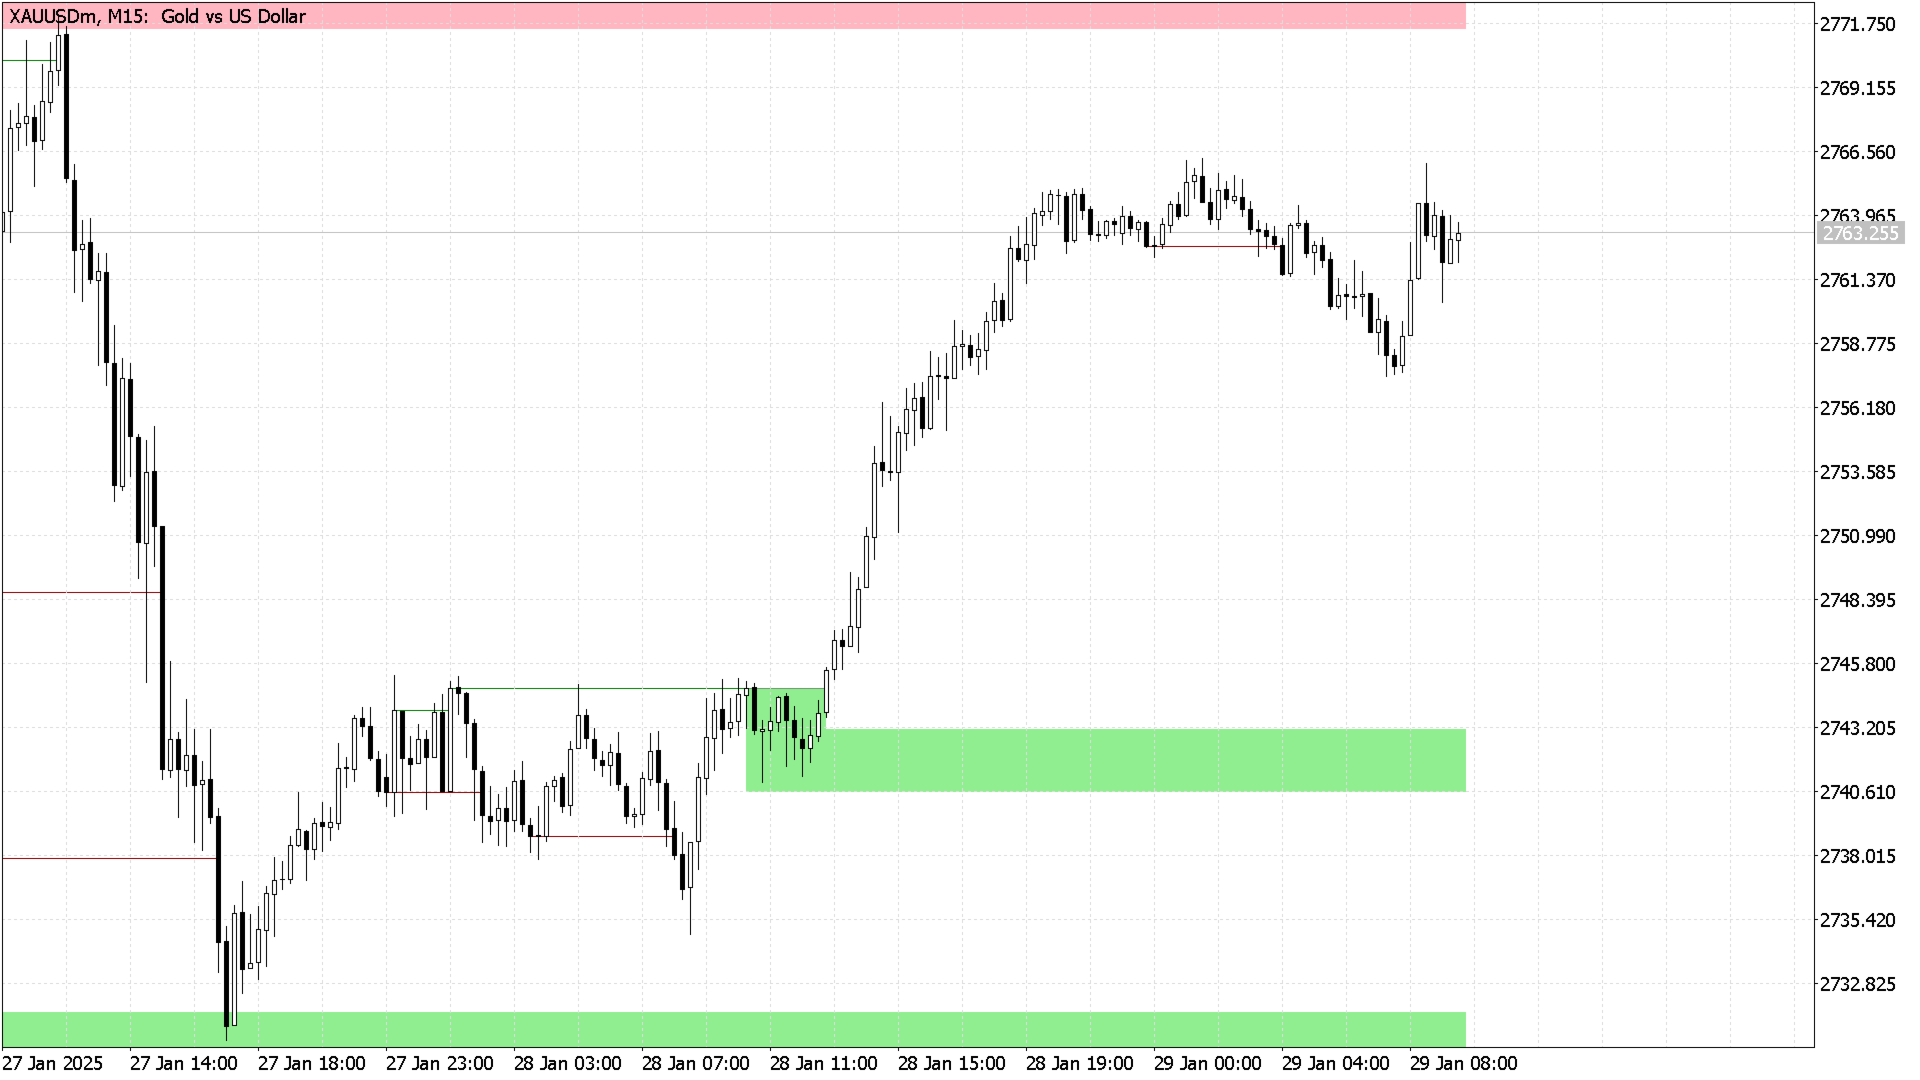
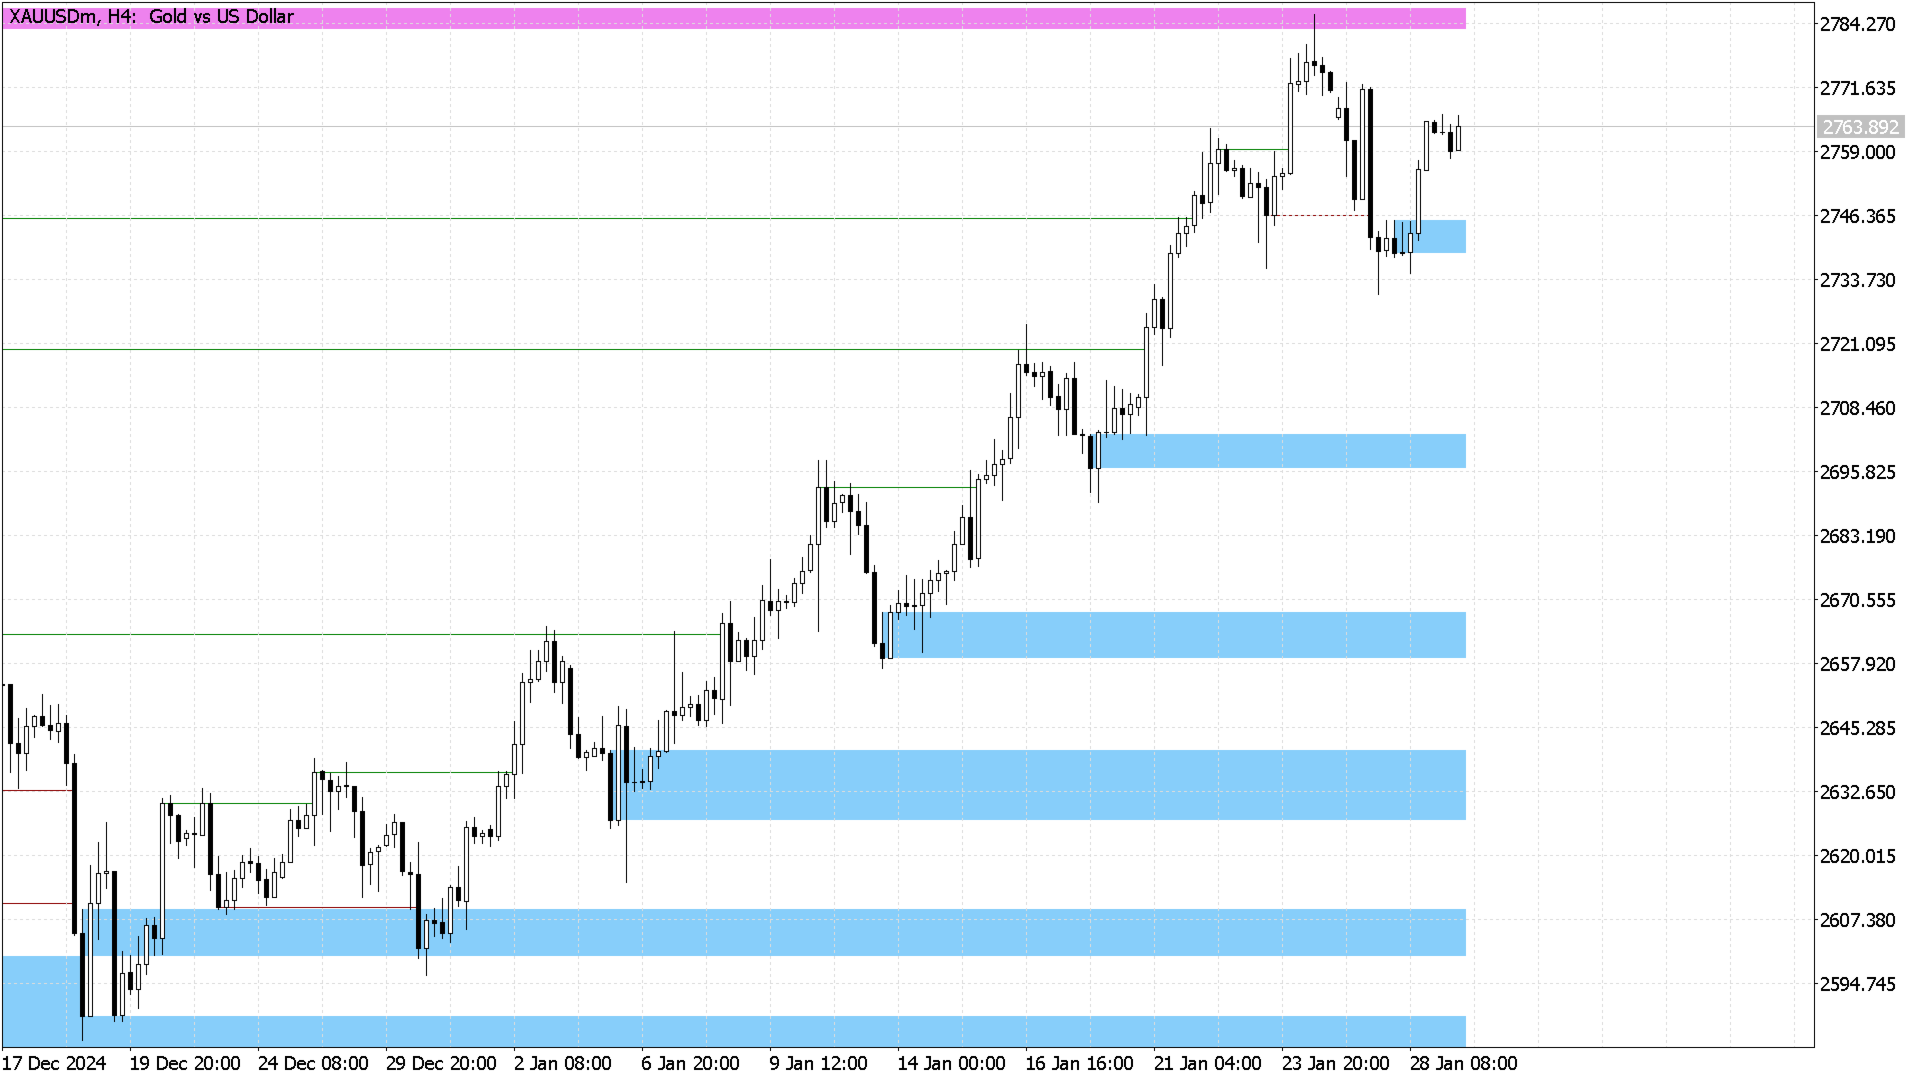
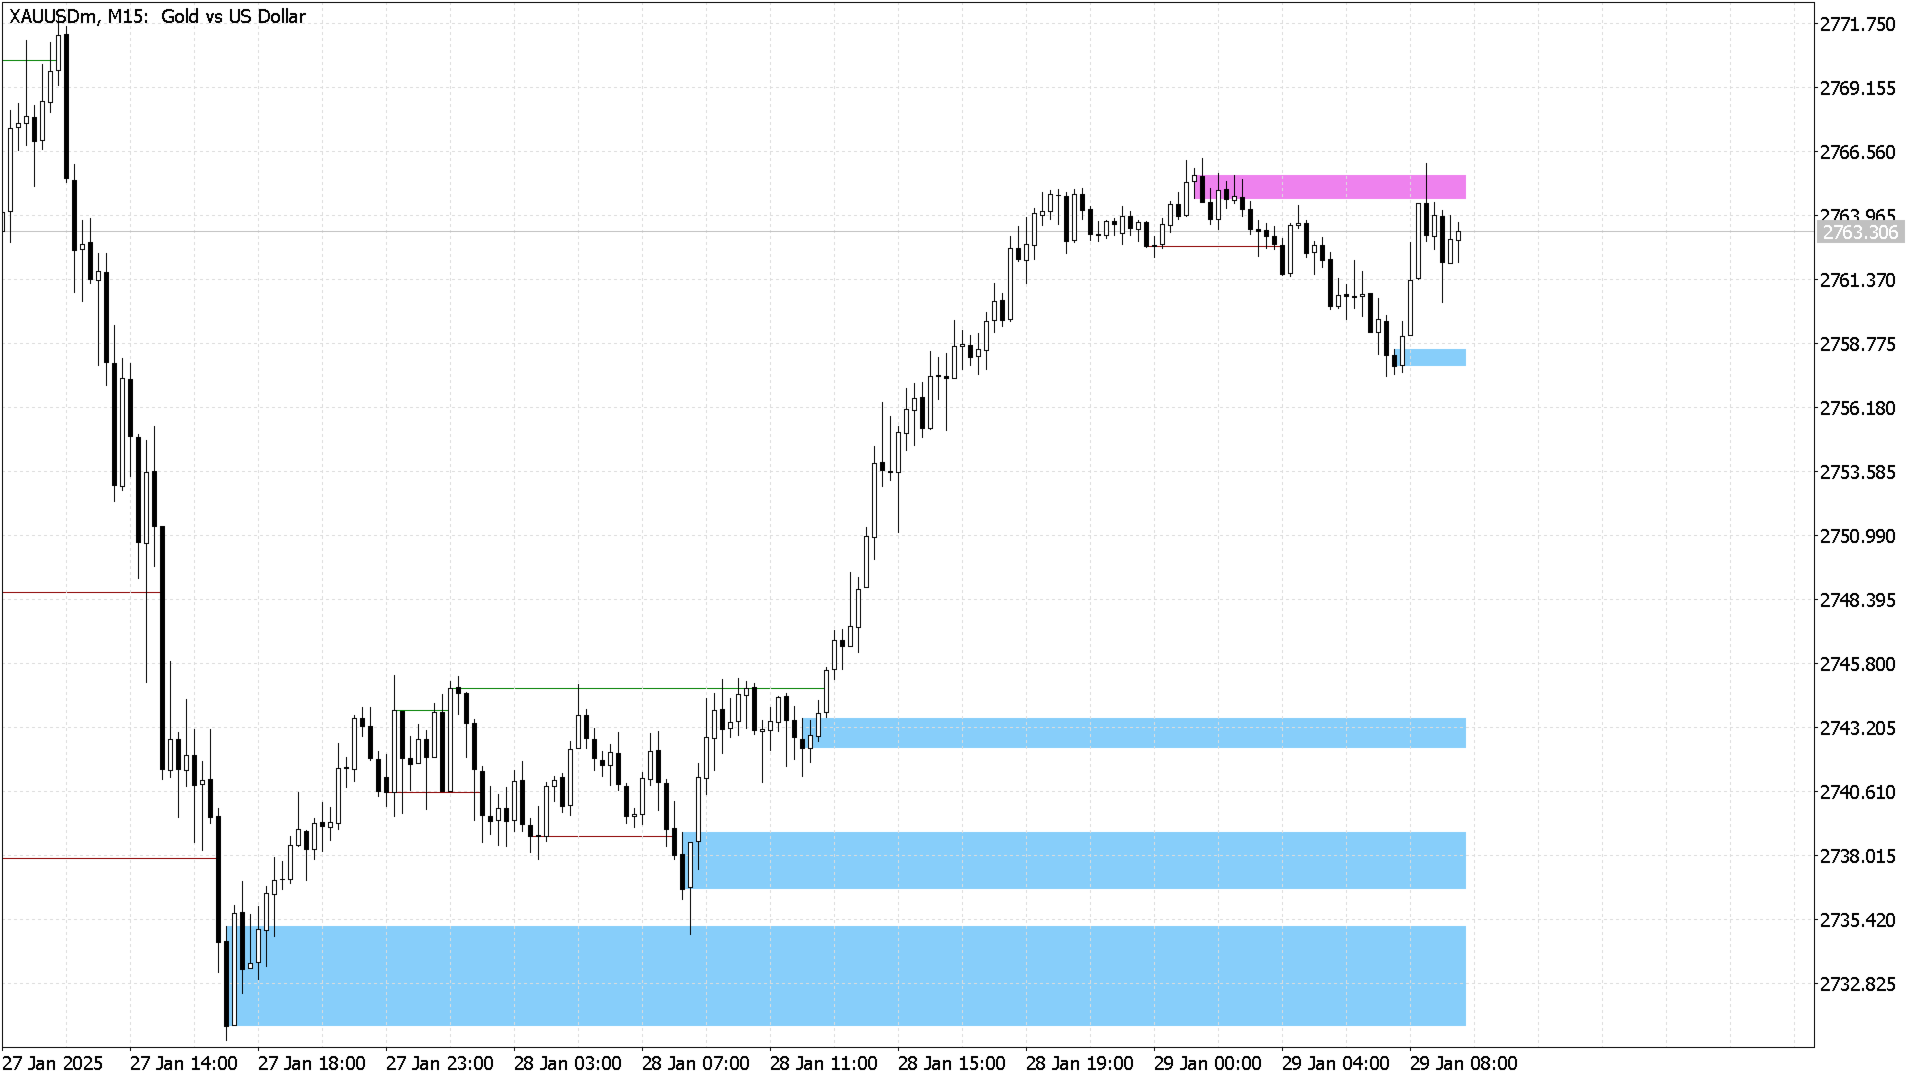
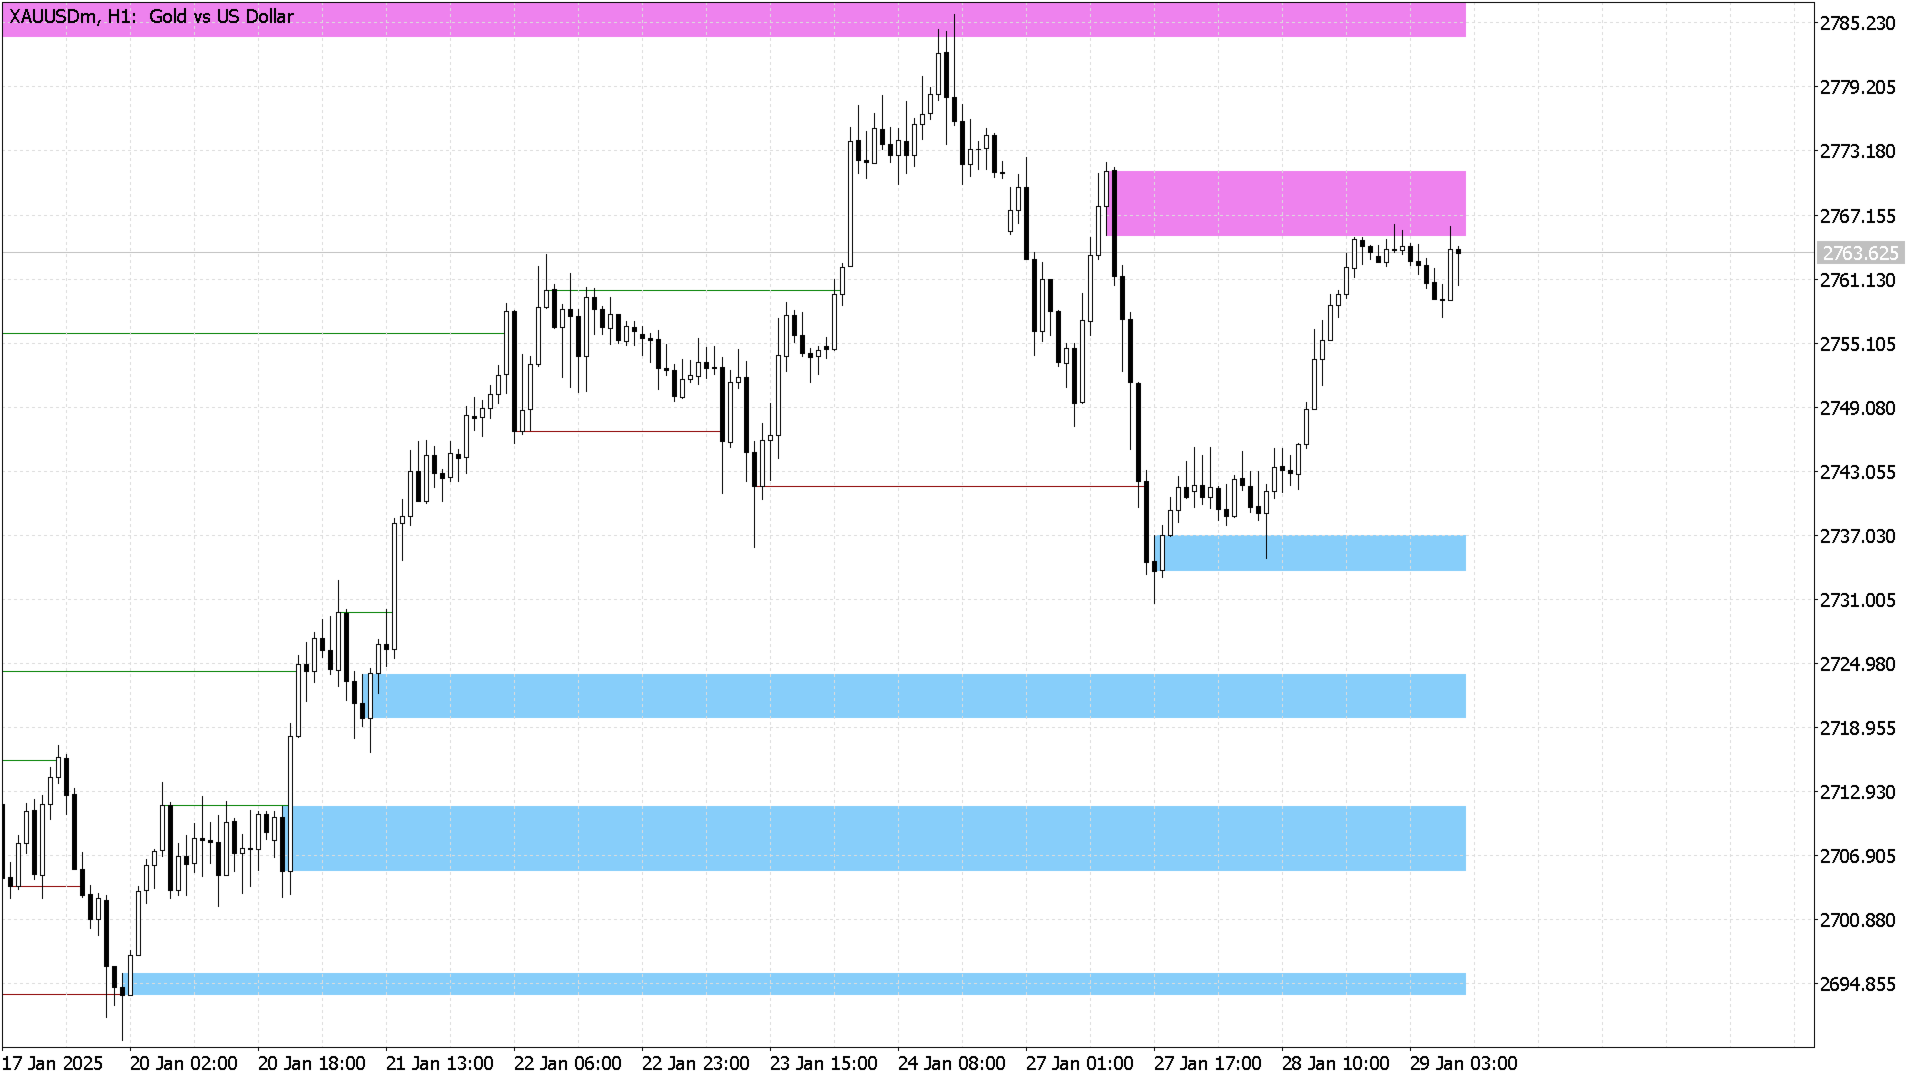
Unlike traditional support & resistance tools, ATR Dynamic Zones uses Adaptive ATR calculations to detect peaks & valleys with extreme accuracy. Once price breaks above or below a key level, the zone is automatically converted into a buy or sell area, giving traders a clear roadmap for smart entries & exits.
💡 How It Works:
✅ Detects peaks & valleys dynamically using ATR-based price movement
✅ Highlights breakout & retest zones for high-probability trades
✅ Adjustable candle range – analyze historical price action up to all candles back
✅ No repainting! Keeps all historical zones visible
✅ Works on all markets: Forex, Crypto, Stocks & Indices
🔔 Perfect for traders who:
✔ Need a dynamic support & resistance system
✔ Want to track breakout & retest levels automatically
✔ Prefer an ATR-based adaptive trading strategy
🔥 Turn price action into profit – Trade smarter with ATR Dynamic Zones!