Quarterly K Box
- Indicators
- Ying Liang Yao
- Version: 1.6
- Updated: 4 February 2025
- Activations: 5
Quarter K Box Indicator Description
Product Name
Quarter K Box Indicator
Product Overview
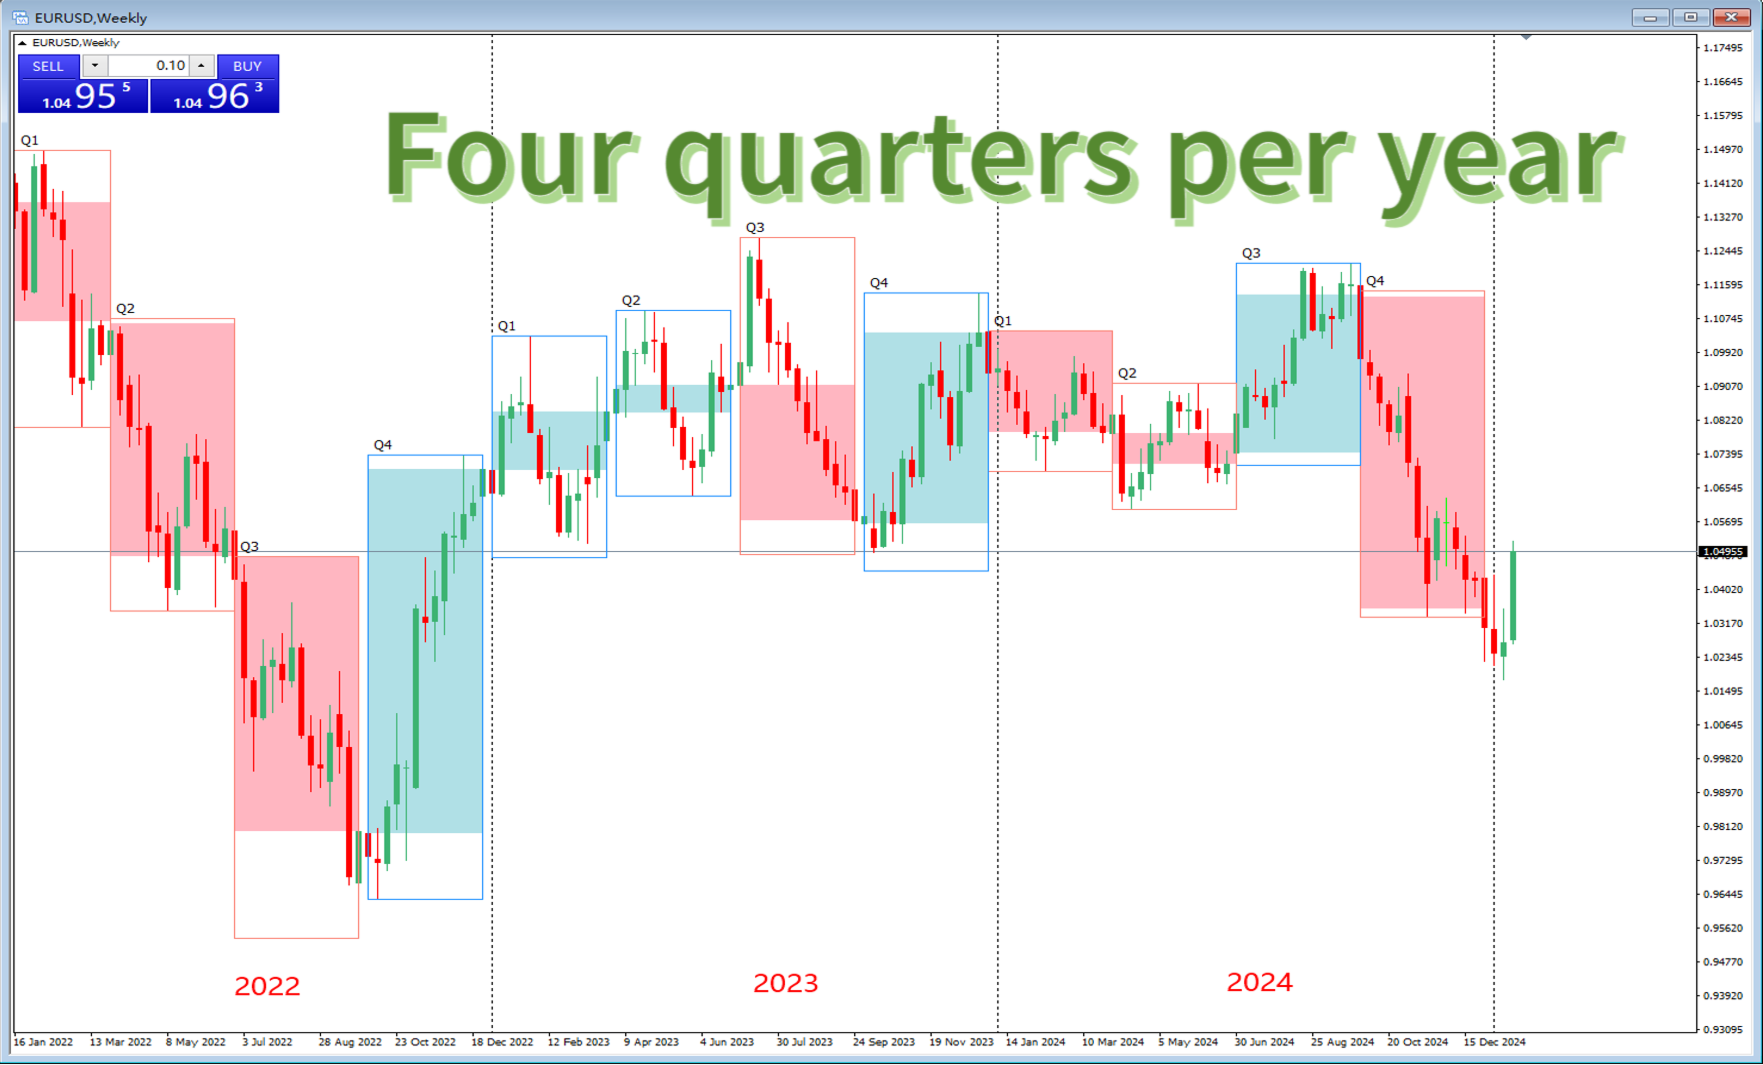
The Quarter K Box Indicator is a technical analysis tool specifically designed for forex, stock, and futures traders. It displays the range of quarterly candlesticks (high, low, open, and close) on monthly, weekly, daily, and smaller timeframe charts. By drawing clear background boxes, this indicator helps traders quickly identify quarterly trends and key support/resistance zones in the market.
Whether you are a trend follower or a short-term trader, this indicator provides a higher timeframe market structure perspective, enabling you to better understand market movements and develop precise trading strategies.
Key Features
-
Quarterly Background Box Display
- Clearly marks each quarter's open, high, low, and close prices on charts with timeframes lower than the quarterly timeframe (e.g., monthly, weekly, daily).
- Customizable background box colors, with automatic color differentiation for different quarters, allowing for quick visual identification.
-
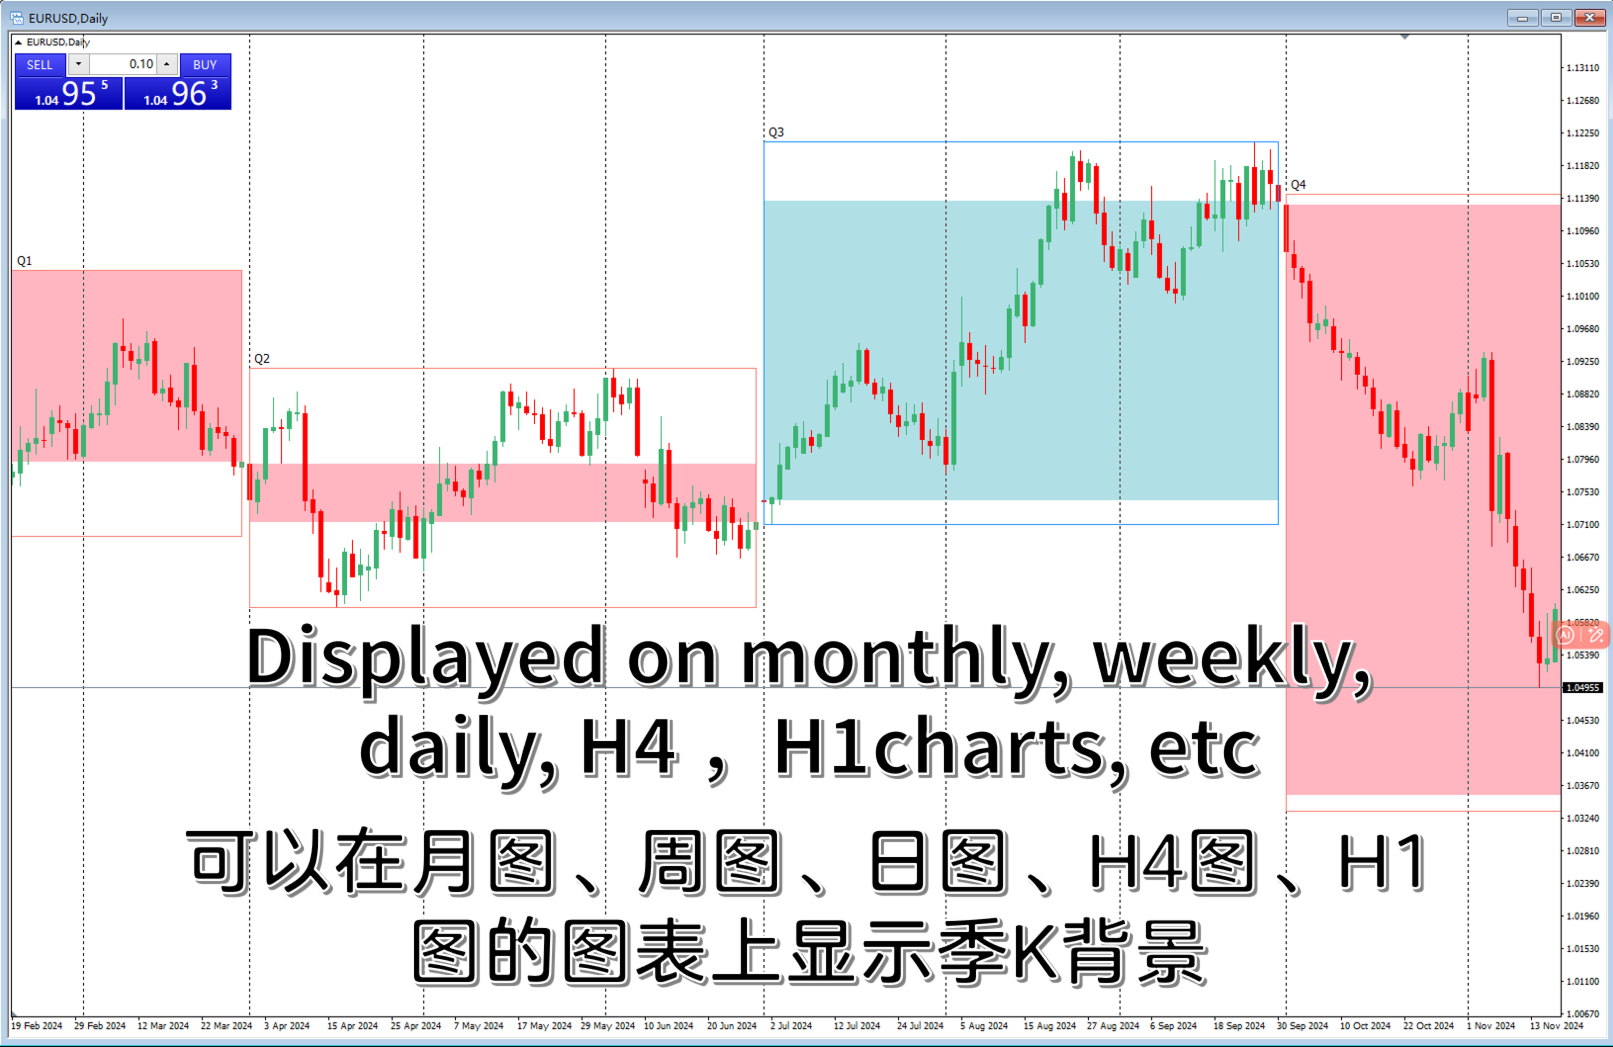
Multi-Timeframe Support
- Usable on monthly, weekly, daily, 4-hour charts, and any timeframe below the quarterly level.
- Compatible with all major trading instruments, including forex, stocks, indices, and futures.
-
Trend Analysis Tool
- Easily identifies the direction of quarterly trends (upward, downward, or ranging).
- Highlights key quarterly support and resistance levels, helping to avoid misjudgments in critical areas.
-
Customizable Parameters
- Allows users to personalize box colors, the number of displayed quarters, and other settings to suit individual trading styles.
- Options to display quarterly open prices, high/low levels, and other key price points.
-
Lightweight Design
- Runs efficiently with minimal impact on system resources.
- Suitable for all trading platforms and account types, whether for personal traders or professional institutions.