Supply Demand levels
- Indicators
- Jan Flodin
- Version: 1.1
- Updated: 31 January 2025
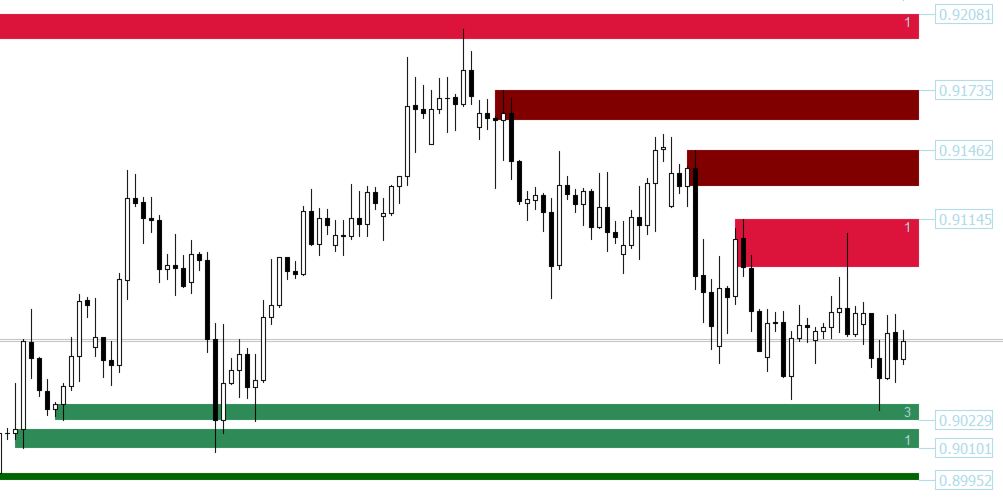
This indicator draws supply and demand zones on the chart. Combined with your own rules and techniques, this indicator will allow you to create (or enhance) your own powerful system. Please also check out the paid version which offers much more. My recommendation is to look for trading opportunities where the first zone test occurs after at least 25 bars.
Features
- The zones have 3 colors (adjustable by input). Dark color for untested zone, medium for tested zone and light for broken zone.
- The price of the zone outer border as well as the amount of zone test are written at each zone.
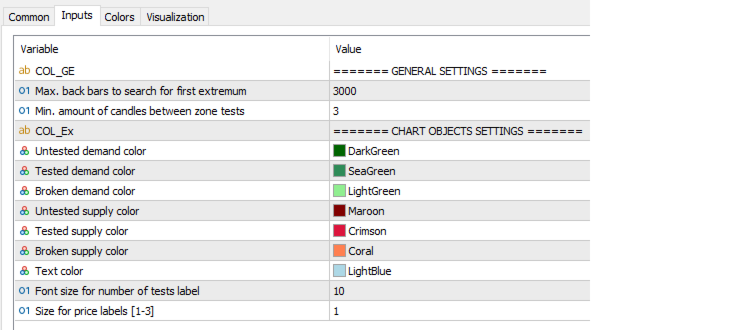
Input parameters
- Max. back bars to search for first extremum - Default is 3000. Will search for the first extremum xx bars back in time. The higher the value the more system resources will be needed. For slower computers a value of 500-1000 can be more suitable.
- Min. amount of candles between zone tests
- Untested demand color
- Tested demand color
- Broken demand color
- Untested supply color
- Tested supply color
- Broken supply color
- Text color
- Font size for number of tests label
- Size for price labels [1-3]