Cornucopia
- Indicators
- Wen Huang
- Version: 1.0
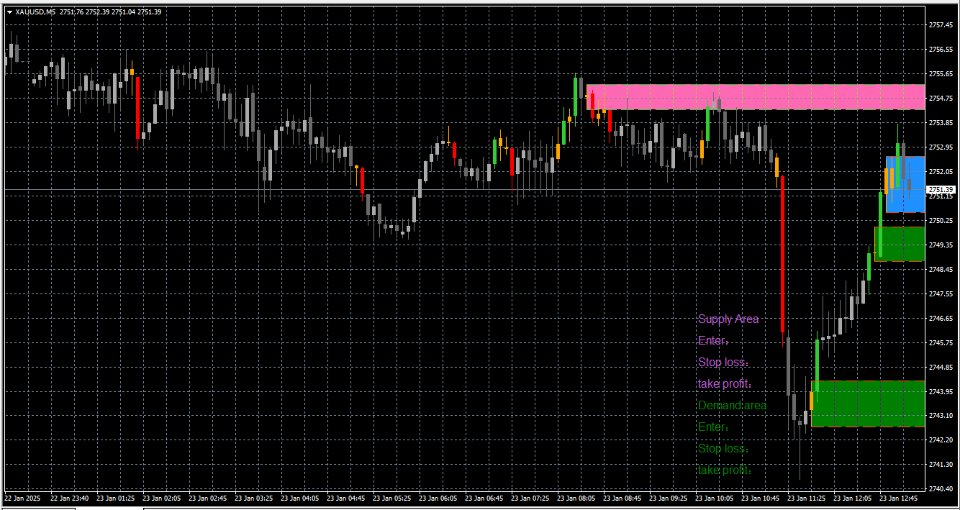
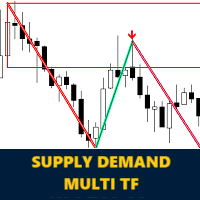
1.Supply and demand are one of the core strategies used in trading. It focuses on the ancient laws of supply and demand, as well as the trends of prices in a free flowing market. The basis of this strategy is that the quantity of available tools and the demand for tools from buyers determine the price. It marks on the chart the areas where demand overwhelms supply (demand regions), driving prices up, or where supply overwhelms demand (supply regions), driving prices down. Most supply and demand traders wait for prices to enter the areas where major buying and selling activities occur before entering long or short positions.
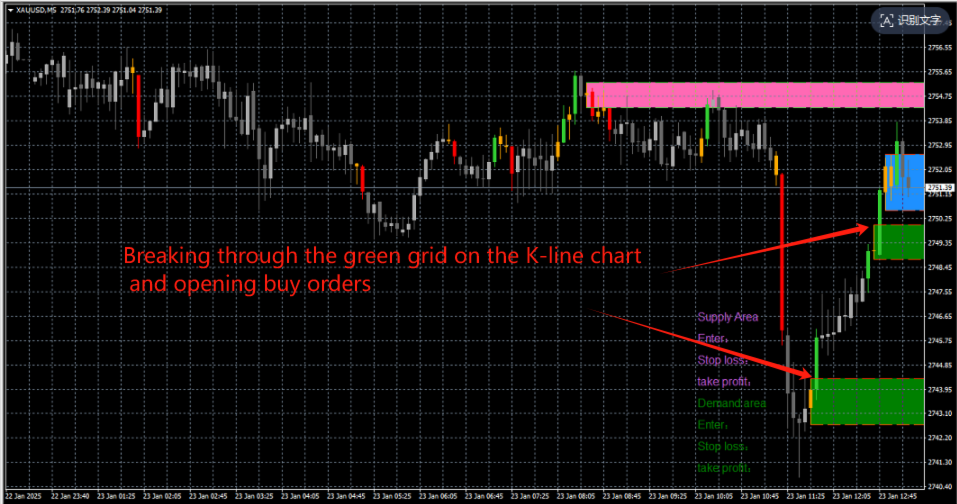
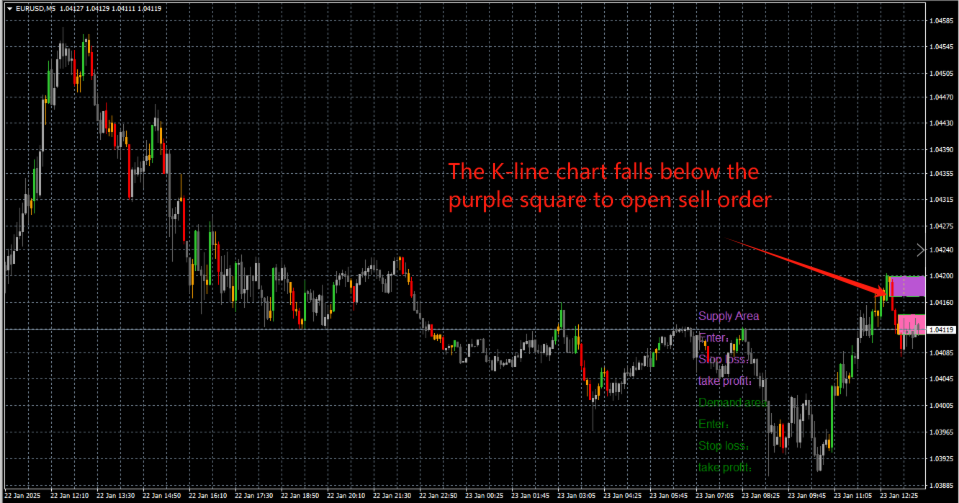
2. It makes sense to purchase in the demand area and sell in the supply area, but please remember that fresh areas are more effective than retested areas. They can be used as entry zones for sustained trends or reversal zones for changing trends. You can trade boldly or conservatively, each with its own entry and exit rules. Draw chart tools according to these rules, allowing users to visually identify these levels on the chart.
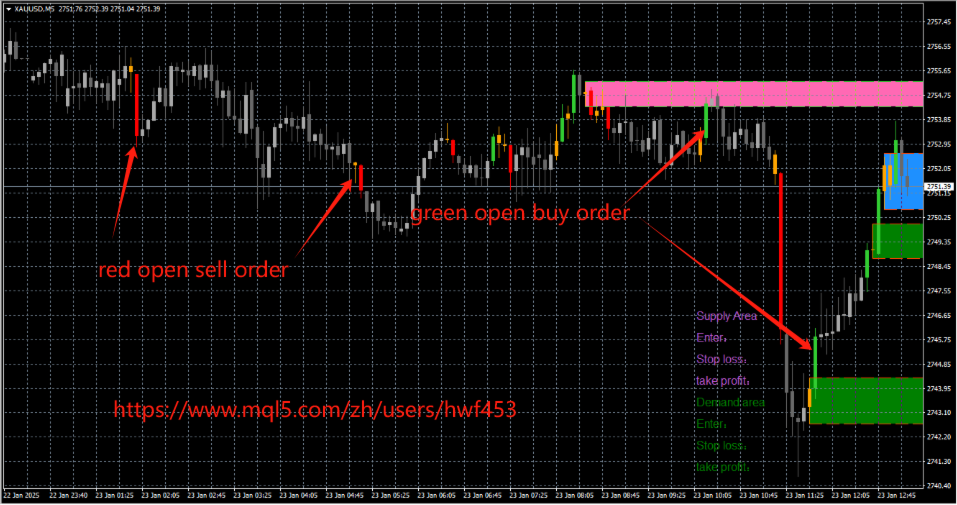
3.When the K-line on the chart turns yellow, the price is about to break through. If the color of the next candlestick is red, open a sell order. If it is green, open a buy order.
4. This is an indicator of supply and demand, which can provide traders with reference to the supply and demand situation. After TV has supported drawing rectangles through indicators, many indicators have appeared in the market,But I think our supply and demand indicators are one of the few in the market.
5. Automatically draw support and resistance zones for high probability counter trend trading, including automatic Fibonacci plotting options.















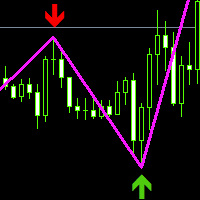







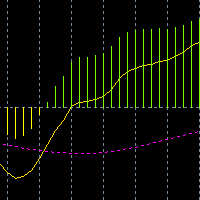
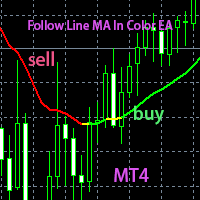
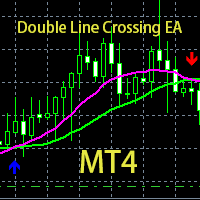





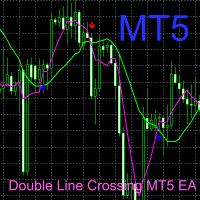
already tested, amazing, 9/10. complete chart i use this indicator with HA, MA cross. it's simple, no need greedy. thanks author.