• Overview
  • Reviews
  • Comments

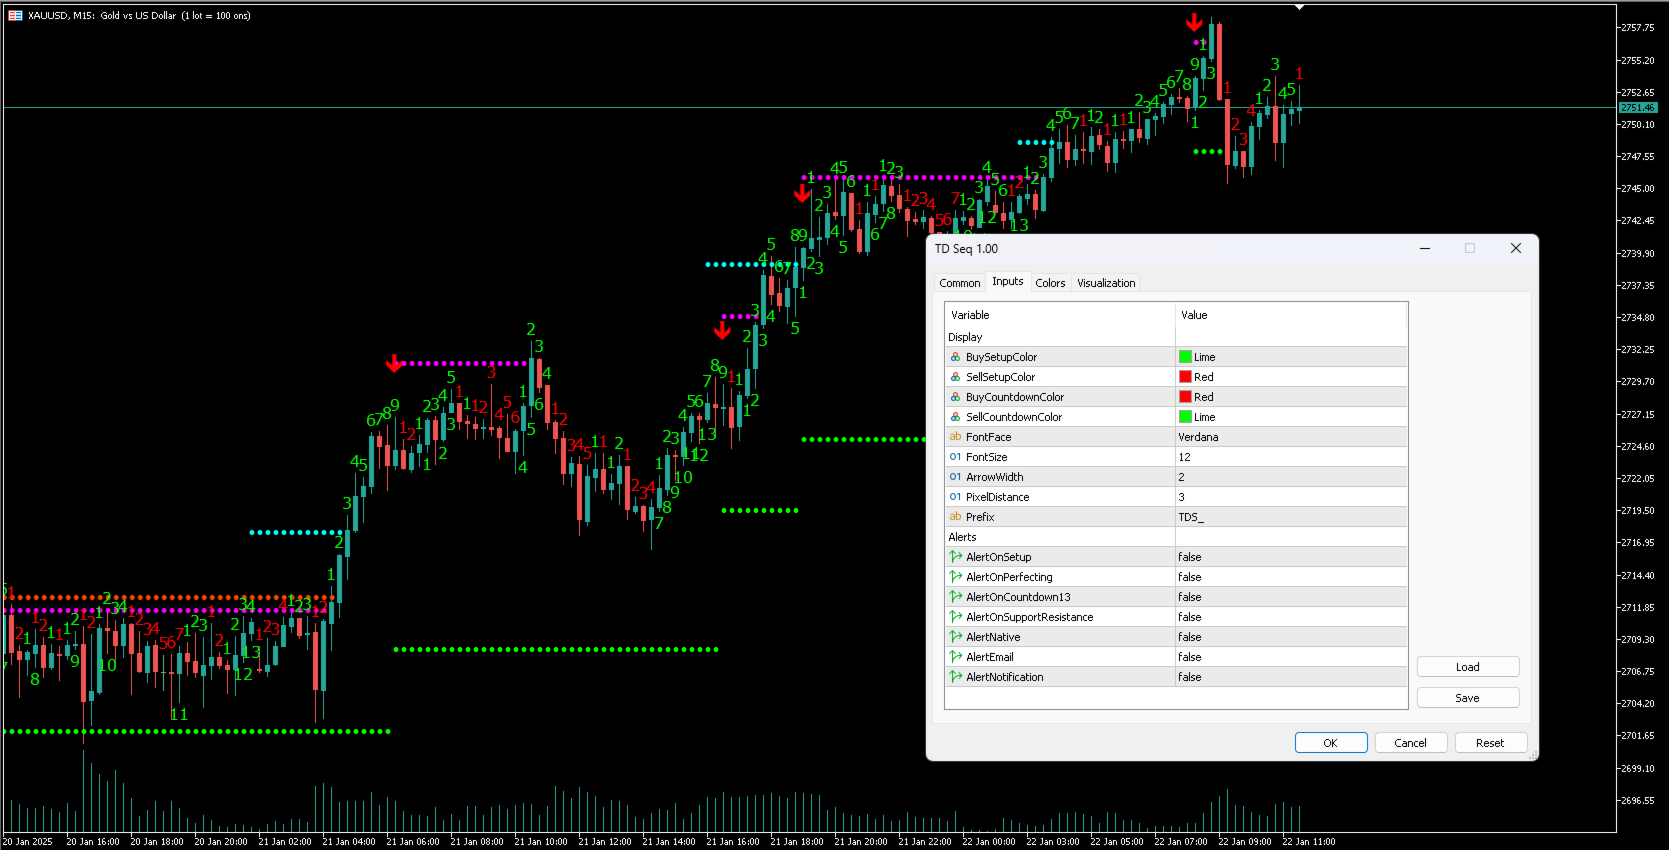
TD Sequential for MT5

Indicator
Sequential®

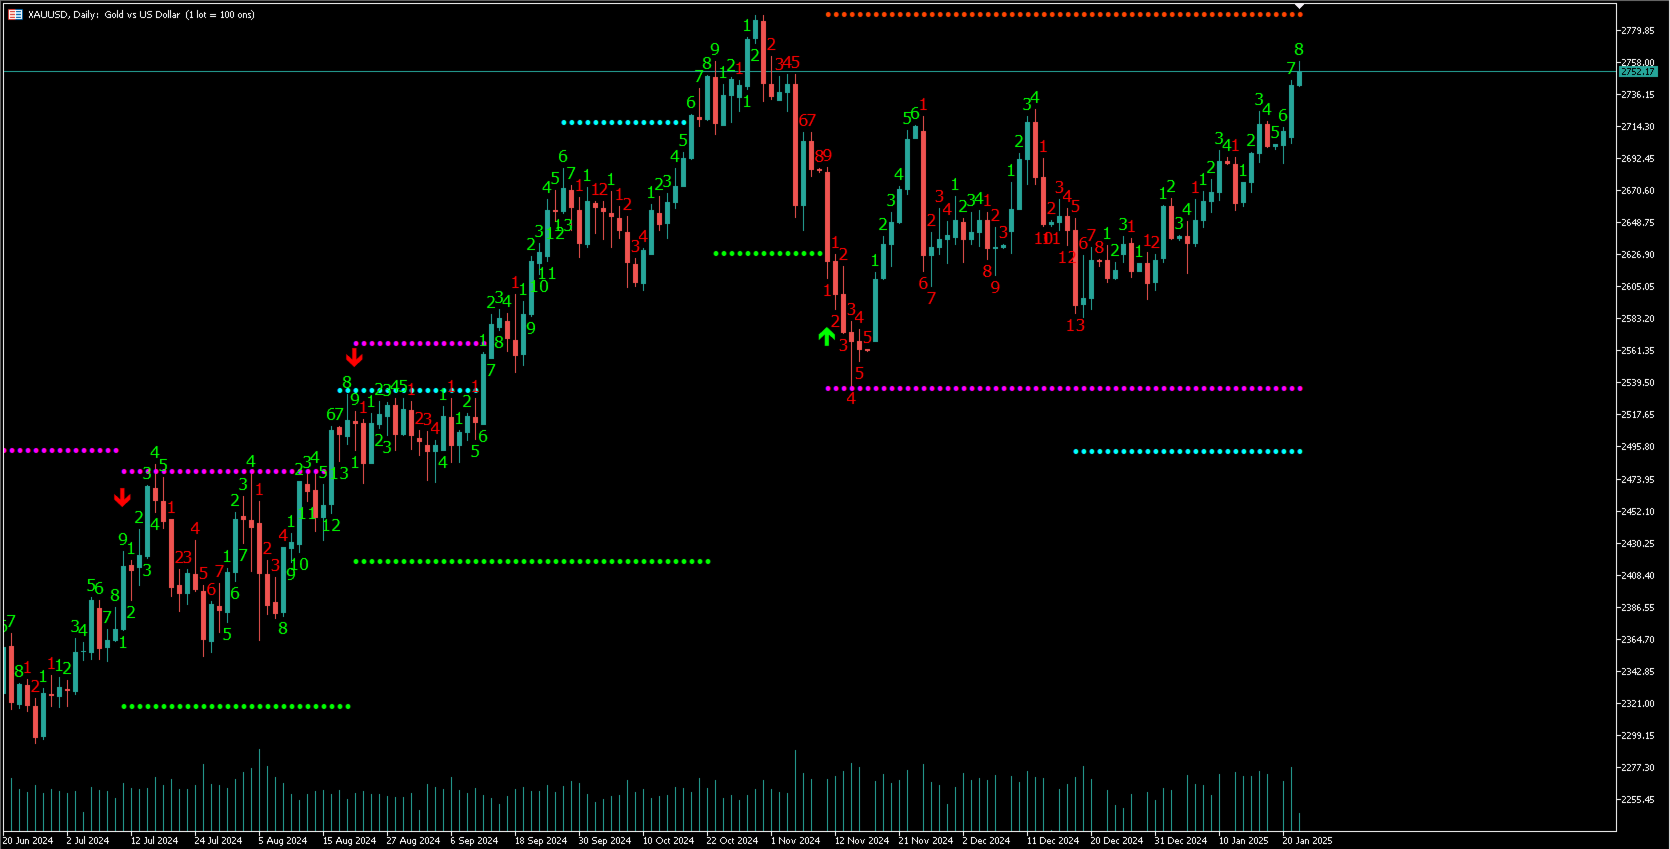
Through a multi-phase price comparative process consisting of the Setup and Countdown indicators, the Sequential indicator analyzes otherwise incongruent price data to provide insight into the strength or weakness of the market’s trend and its likelihood of reversing

The Mechanics of Sequential

We have the market's number

The majority of the DeMARK Indicators are designed to anticipate price exhaustion as opposed to following the trend. Identifying likely inflection points provides an ideal opportunity to buy into weakness and sell into strength, ensuring an improved cost basis and the ability to gradually build a position.

Figuratively speaking, markets top not because of smart sellers, but because the last buyer has bought. Conversely, markets bottom not because of smart buyers, but because the last seller has sold.

Market tops and bottoms are typically associated with an overwhelming belief that the trend will continue. While many espouse the long-held expression that, “the trend is your friend,” we believe it’s important to add the corollary, “unless the trend is about to end.”

Identifying probable points of inflection improves your cost basis, decreases your risk and allows you to participate in a greater portion of the market’s subsequent trend.

Sequential intro­duces precision and objectivity into market timing by identify­ing areas at which market tops and bottoms are likely.


Recommended products
Holiday Sales Zones Indicator The Zones Indicator is your everyday Trading tool that  leverages advanced algorithms, including ICT institutional concepts like order blocks , engulfing candle patterns , and Level interactions , to identify critical levels of supply and demand (Resistance & Support). Visual signals are generated and clearly marked on the chart, providing a straightforward guide for traders to spot key opportunities. Key Features Advanced Algorithmic Analysis : Identifies supply
Range Directional Force Indicator – Designed for You to Optimize! The Range Directional Force Indicator is a cutting-edge tool designed to empower traders by visualizing market dynamics and directional strength. Built to offer insights into market trends and reversals, this indicator is an invaluable asset for traders seeking precision in their strategies. However, it is important to note that this indicator is not optimized, leaving room for you to tailor it to your unique trading preferences.
Manyal trading system, CovEchoTrend Robot, focuses on reliability and flexibility. By employing statistical analysis methods to study the relationships between the base indicator and market patterns, the system enables a deeper understanding of market processes. Intelligent pattern analysis: The application of statistical data processing helps identify key trend reversal points more accurately, signaling significant market shifts. Informed decision-making is based on the intersection of indicato
DTFX Algo Zones are auto-generated Fibonacci Retracements based on market structure shifts. These retracement levels are intended to be used as support and resistance levels to look for price to bounce off of to confirm direction.   USAGE Figure 1 Due to the retracement levels only being generated from identified market structure shifts, the retracements are confined to only draw from areas considered more important due to the technical Break of Structure (BOS) or Change of Character (CHo
Smart Engulfing MT5
Ashkan Hazegh Nikrou
We are in charismas sale , so until 2025 all products are available by minimum price 30$ Introduction to Smart Engulfing MT5: Step into the realm of refined trading with Smart Engulfing MT5 – your go-to professional indicator for identifying top-tier engulf patterns. Designed with precision and ease of use in mind, this tool is crafted exclusively for MetaTrader 5 users. Uncover lucrative trading opportunities effortlessly as Smart Engulfing MT5 guides you with alerts, arrows, and three distinc
Price action is among the most popular trading concepts. A trader who knows how to use price action the right way can often improve his performance and his way of looking at charts significantly. However, there are still a lot of misunderstandings and half-truths circulating that confuse traders and set them up for failure. Using PA Trend Reversal will be possible to identify high probability exhaustion moves of a trend. Features The indicator gives alerts in real-time when the conditions are me
Liquidity Oscillator
Paolo Scopazzo
5 (1)
A powerful oscillator that provide Buy and Sell signals by calculating the investor liquidity. The more liquidity the more buy possibilities. The less liquidity the more sell possibilities. Please download the demo and run a backtest! HOW IT WORKS: The oscillator will put buy and sell arrow on the chart in runtime only . Top value is 95 to 100 -> Investors are ready to buy and you should follow. Bottom value is 5 to 0 -> Investors are ready to sell and you should follow. Alert + sound will appe
The Plasma Trend indicator is a simple technical indication that is used to determine the current trend direction in the market. The Plasma Trend indicator is a powerful tool for determining the direction of the trend in the Forex market. It is based on both standard technical indicators and proprietary mathematical calculations, which provides a more accurate and reliable trend determination. Its implementation in the form of lines of two colors simplifies the visual determination of a change
Limitless MT5
Dmitriy Kashevich
Limitless MT5 is a universal indicator suitable for every beginner and experienced trader. works on all currency pairs, cryptocurrencies, raw stocks Limitless MT5 - already configured and does not require additional configuration And now the main thing Why Limitless MT5? 1 complete lack of redrawing 2 two years of testing by the best specialists in trading 3 the accuracy of correct signals exceeds 80% 4 performed well in trading during news releases Trading rules 1 buy signal - the ap
The indicator monitors the Dinapoli MACD trend in multiple timeframes for the all markets filtered and shows the results on Dashboard. Key Features Indicator can be used for all markets Monitors every timeframe, from 1 Min to Monthly Parameters UseMarketWatch: Set true to copy all symbols available in market watch MarketWatchCount : Set the number of symbols that you want to copy from the market watch list. CustomSymbols: Enter the custom symbols that you want to be available in dashboard. Ti
Fibrillar
Vitalii Zakharuk
It is very easy to use the Fibrillar indicator, since the simplest is to look at the chart and act according to the indications of the colored arrows. The algorithm takes into account the measurement of prices, and this method also focuses on measuring each of the price drops (H / C, H / O, LC, LO) - which gives more detailed information, but also more averaged. When calculating this indicator, logarithmic gains are first calculated at the closing price, which allows you to filter out the tren
Market Session Pro
Kambiz Shahriarynasab
The  Market Sessions Indicator for MT5 helps you  predict market turnarounds  by detecting major supply and demand areas. These pivot points tend to occur after a new session has started and the previous one is still open. It is also used to gauge how many points or pips the market moves on average during a session. This helps us to place better our take profits and stop losses. The indicator works on all forex pairs, gold, silver, commodities, stocks, indices and any other instrument that your
The  Entry Signal Analyzer is a sophisticated MetaTrader 5 indicator designed to analyze and identify optimal trading hours based on price movement patterns. The indicator analyzes gold currency only  a updated version is currently being developed for other symbol  the indicator in the strategy tester is non-functional works on the real chart Statistical Analysis: Analyzes historical price movements for each hour of the trading day Tracks success rates and consistency of movements Calculates poi
To download MT4 version please click here . This is the exact conversion from TradingView indicator: "ADX and DI" By " BeikabuOyaji". This is probably the most popular implementation of Average Directional Index available. This indicator lets you read the buffers as below: index 0: DIPlusBuffer ==> Green Line by default index 1: DIMinusBuffer ==> Red Line by default index 2: ADXBuffer ==> Navy Line by default - You can message in private chat for further changes you need. Note: This is a non-rep
Market Session Visual
Kambiz Shahriarynasab
The  Market Sessions Indicator for MT5 helps you  predict market turnarounds  by detecting major supply and demand areas. These pivot points tend to occur after a new session has started and the previous one is still open. It is also used to gauge how many points or pips the market moves on average during a session. This helps us to place better our take profits and stop losses. The indicator works on all forex pairs, gold, silver, commodities, stocks, indices and any other instrument that you
Rocket Trend
Andriy Sydoruk
The Rocket Trend indicator is trending. The indicator draws two-color points connected by lines along the chart. This is a trend indicator, it is an algorithmic indicator. It is easy to work and understand when a blue circle appears, you need to buy, when a red one appears, sell. The indicator is used for scalping and pipsing, and has proven itself well. Rocket Trend is available for analyzing the direction of the trend for a specific period of time. Ideal for novice traders learning the laws o
Mean Reversal Heikin Ashi Indicator calculates special trade reversal points based on Heikin Ashi candlesticks patterns. This indicator can be used on all symbols, even in Forex or B3 Brazillian Markets. You can configure just the position of each arrow. Then, after include the indicator on the graphic, pay attention on each arrow that indicates a long or short trade.
ATrend
Zaha Feiz
4.77 (13)
ATREND: How It Works and How to Use It How It Works The " ATREND " indicator for the MT5 platform is designed to provide traders with robust buy and sell signals by utilizing a combination of technical analysis methodologies. This indicator primarily leverages the Average True Range (ATR) for volatility measurement, alongside trend detection algorithms to identify potential market movements. Leave a massage after purchase and receive a special bonus gift. Key Features: ⦁ Dynamic Trend Detect
Surf Board
Mohammadal Alizadehmadani
Benefits of the Surfboard indicator : Entry signals without repainting If a signal appears and is confirmed, it does NOT disappear anymore, unlike indicators with repainting, which lead to major financial losses because they can show a signal and then remove it. perfect opening of trades The indicator algorithms allow you to find the Peak and floor position to enter a deal (buy or sell an asset), which increases the success rate for each and every trader using it. Surfboard works with any asset
This indicator has a unique support and resistance calculation program, which is a unique trading system. Index characteristics Imagine if you can accurately determine the important trading support and resistance areas and points in advance, how will your trading improve? Based on a unique calculation method, the indicator analyzes the trend, analyzes the current support and resistance, and obtains the current important support resistance and single direction, the calculated stop profit and sto
The SyntheticaFX Boom & Crash Multi Indicator for MetaTrader 5 is an advanced trading tool designed to enhance your trading strategy by detecting potential spikes and analyzing market trends across various timeframes. This indicator is specifically tailored for the Crash and Boom indices, providing timely alerts and essential trend information to help you make informed trading decisions. Key Features: 1. Spike Detection:     - Identifies potential spikes on the following indices and timeframe
KT Momentum Arrows MT5
KEENBASE SOFTWARE SOLUTIONS
5 (2)
KT Momentum Arrows Indicator is based on a momentary breakout which is calculated using the bands deviation and emerging volatility in a certain direction. A buy signal is generated when the price closes above the upper band and a sell signal is generated when the price closes below the lower band. A magnitude coefficient is used as the input which affects the band deviation and volatility at the same time. The coefficient value should be carefully selected and analyzed based on the instrument a
The indicator determines the state of the market: trend or flat. The state of the market is determined by taking into account volatility. The flat (trading corridor)is displayed in yellow. The green color shows the upward trend. The red color shows the downward trend. The height of the label corresponds to the volatility in the market. The indicator does not redraw . Settings History_Size   - the amount of history for calculation. Period_Candles  - the number of candles to calculate the indicat
Super Trend eu
Emin Ulucanli
4.75 (4)
SUPERTREND; It is a trend following indicator based on the SuperTrend ATR created by Olivier Seban. It can be used to detect changes in trend direction and locate stops. When the price falls below the indicator curve, it turns red and indicates a downtrend. Conversely, when the price moves above the curve, the indicator turns green, indicating an uptrend. Like other indicators, it works well on SuperTrend when used in conjunction with other indicators such as MACD, parabolik SAR, Bollinger Band
FREE
MarketMagnet
Kelly Adediran Raymond
Are you ready to take your trading journey to new heights? Look no further than MarketMagnet, this groundbreaking indicator designed to propel your trading success with excitement and accuracy. Powered by the convergence of Momentum and CCI (Commodity Channel Index), MarketMagnet equips traders with the ultimate tool to determine direction and entry prices for a wide range of recommended currency pairs and instruments. It is designed for traders seeking to scalp for a few pips on lower timeframe
- This is the exact conversion from TradingView: "Support/Resistance" By "BarsStallone". - This indicator lets you read the buffers for R/S values. - This is a non-repaint and light processing load indicator. - This is not a multi time frame indicator If you want the multi time frame version you should create a personal order and I deliver two files that you need them both to have the multi time frame indicator running on your system. - The MT4 version of the indicator is not light load from pr
The volatility scanner indicator is a tool that helps traders identify and analyze  volatility in all the market timeframes for the current chart. This way you can find potentially profitable trades on every timeframe for the current symbol. What It Does? Scan all timeframes to find a volatility contraction. Color the button yellow if there is a volatility squeeze at that timeframe. Clicking on the button instantly changes timeframe. How To Use It? Just put it on the chart and click on the yel
Elevate Your Trading Experience with Wamek Trend Consult!   Unlock the power of precise market entry with our advanced trading tool designed to identify early and continuation trends. Wamek Trend Consult empowers traders to enter the market at the perfect moment, utilizing potent filters that reduce fake signals, enhancing trade accuracy, and ultimately increasing profitability.   Key Features: 1. Accurate Trend Identification: The Trend Consult indicator employs advanced algorithms and unparall
Candle Trend Bars
Muhammed Emin Ugur
Unlock the power of trend analysis with the Candle Trend Bars Indicator – your go-to tool for identifying and understanding market trends like never before. This innovative indicator transforms traditional candlestick charts into a dynamic and visually intuitive representation of market trends. Key Features: Trend Clarity: Gain a clear and concise view of market trends with color-coded bars that instantly convey the direction of price movements. User-Friendly Design: The indicator is designed wi
FREE
Hello There, Today I want to show you my new researchable fore BUY SELL indicator, it work all asset, and also work Derive Volatility asset! it work all time frame, but i recommend start 5 minute to H1 when you receive a signal just take trade and stay wait for your take profit asset All Major Pair And minor IT WORK ALSO XAUUSD Fantastic results,  for more info,,, message us thank you   
Buyers of this product also purchase
RelicusRoad Pro MT5
Relicus LLC
4.78 (18)
How many times have you bought a trading indicator with great back-tests, live account performance proof with fantastic numbers and stats all over the place but after using it, you end up blowing your account? You shouldn't trust a signal by itself, you need to know why it appeared in the first place, and that's what RelicusRoad Pro does best! User Manual + Strategies + Training Videos + Private Group with VIP Access + Mobile Version Available A New Way To Look At The Market RelicusRoad is th
FxaccurateLS
Shiv Raj Kumawat
WHY IS OUR FXACCCURATE LS MT5 THE PROFITABLE ? PROTECT YOUR CAPITAL WITH RISK MANAGEMENT Gives entry, stop and target levels from time to time. It finds Trading opportunities by analyzing what the price is doing during established trends. POWERFUL INDICATOR FOR A RELIABLE STRATEGIES We have made these indicators with a lot of years of hard work. It is made at a very advanced level. Established trends provide dozens of trading opportunities, but most trend indicators completely ignore them! The
[ MT4 Version ]  [ Order Blocks ]  [ Kill Zones ]  [ SMT Divergences ] How to trade using Order Blocks :  Click here User Interface Performance:  During testing in the strategy tester, the UI may experience lag. Rest assured, this issue is specific to the testing environment and does not affect the indicator's performance in live trading. Elevate your trading strategy with the  Order Blocks ICT Multi TF  indicator, a cutting-edge tool designed to enhance your trading decisions through advanced o
[ MT4 Version ]  [ Kill Zones ]  [ SMT Divergences ] How to trade using Order Blocks:  Click here User Interface Performance:  During testing in the strategy tester, the UI may experience lag. Rest assured, this issue is specific to the testing environment and does not affect the indicator's performance in live trading. Elevate your trading strategy with the  Order Blocks ICT Multi TF  indicator, a cutting-edge tool designed to enhance your trading decisions through advanced order block analysis
IQ Gold Gann Levels a non-repainting, precision tool designed exclusively for XAUUSD/Gold intraday trading. It uses W.D. Gann’s square root method to plot real-time support and resistance levels, helping traders spot high-probability entries with confidence and clarity. William Delbert Gann (W.D. Gann) was an exceptional market analyst, whose trading technique was based on a complex blend of mathematics, geometry, astrology, and ancient mathematics which proved to be extremely accurate. Download
AT Forex Indicator MT5
Marzena Maria Szmit
5 (5)
The AT Forex Indicator MT5 is a sophisticated trading tool designed to provide traders with a comprehensive analysis of multiple currency pairs. This powerful indicator simplifies the complex nature of the forex market, making it accessible for both novice and experienced traders. AT Forex Indicator uses advanced algorithms to detect trends, patterns and is an essential tool for traders aiming to enhance their forex trading performance. With its robust features, ease of use, and reliable signal
The Naveen Dynamic Square  MT5  is one of the best known  technical analysis tools  inspired  by WD Gann along with the Gann Fan and Gann Box. It is considered a cornerstone of his trading technique that is based on time and price symmetry. The Naveen Dynamic Square MT5   is a powerful tool in finance for determining support and resistance levels based on a stock's extreme price points. It works by extrapolating probable price levels from a central value, typically an all-time or cyclical high o
Trade smarter, not harder: Empower your trading with Harmonacci Patterns This is arguably the most complete harmonic price formation auto-recognition indicator you can find for the MetaTrader Platform. It detects 19 different patterns, takes fibonacci projections as seriously as you do, displays the Potential Reversal Zone (PRZ) and finds suitable stop-loss and take-profit levels. [ Installation Guide | Update Guide | Troubleshooting | FAQ | All Products ] It detects 19 different harmonic pri
CBT Quantum Maverick High-Efficiency Binary Trading System CBT Quantum Maverick is a finely tuned, high-performance binary options trading system designed for traders seeking precision, simplicity, and disciplined trading. No customization is required—this system is optimized for effective results right out of the box. Simply follow the signals, which can be mastered with a bit of practice. Key Features: Signal Precision: New-bar-based trading signals—targeting the next candle based on curren
MetaForecast M5
Vahidreza Heidar Gholami
5 (3)
MetaForecast predicts and visualizes the future of any market using different powerful methods. While financial markets are not always predictable, if there are patterns in the past data, MetaForecast can learn and predict the future as accurately as possible. It features a complete implementation of neural networks embedded directly into the indicator, enabling traders to create and train AI models using data from multiple symbols to learn complex patterns. MetaForecast leverages your computer'
The Precision Index Oscillator (Pi-Osc) for MT5 by Roger Medcalf of Precision Trading Systems First of all, if you have any questions please contact me via my website which you can find by searching the above title. Version 2 has been carefully recoded to be super fast to load up on your chart and some other technical improvements have been incorporated to enhance experience. Pi-Osc was created to provide accurate trade timing signals designed to find   extreme     exhaustion points, the points
PZ Mean Reversion MT5
PZ TRADING SLU
3 (2)
Outperform traditional strategies: effective mean reversion for savvy traders Unique indicator that implements a professional and quantitative approach to mean reversion trading. It capitalizes on the fact that the price diverts and returns to the mean in a predictable and measurable fashion, which allows for clear entry and exit rules that vastly outperform non-quantitative trading strategies. [ Installation Guide | Update Guide | Troubleshooting | FAQ | All Products ] Clear trading signals Am
The   Time_Price_SQ9_Degree   indicator is based on the 9 Gann square. Using this indicator, you can identify strong time and price zones. The indicator displays the levels as a degree value. The degrees can be set in the settings. After launching, the MENU button appears. If it is highlighted, it can be moved to any point on the graph, and after double-clicking on it, it stops being highlighted and menu buttons appear. To hide the menu, just double-click on the button, it will become highlight
DESCRIPTION ICSM (Impulse-Correction SCOB Mapper) is the indicator that analyzes the price movement and identifies valid impulses, corrections and SCOBs (Single Canndle Ordere Block). It is a powerful tool that can be used with any type of technical analysis because it's flexible, informative, easy to use and it does substantially improve trader's awareness of the most liquid zones of interest. SETTINGS General | Visuals Colour theme — defines the colour theme of the ICSM. SCOB | Visuals Show
TPA True Price Action indicator reveals the true price action of the market makers through 100% non-repainting signals strictly at the close of a candle! TPA shows entries and re-entries, every time the bulls are definitely stronger than the bears and vice versa. Not to confuse with red/green candles. The shift of power gets confirmed at the earliest stage and is ONE exit strategy of several. There are available now two free parts of the TPA User Guide for our customers. The first "The Basics"
Visual Heatmap Book Analyzer
Alexandre Moraes De Souza Lima
Visual Heatmap Book Analyser This indicator monitors the market liquidity and generates colors based on order patterns, quantities, and renewal activities in the book. This allows you to visualize the order flow and identify areas of high and low liquidity and activity. The indicator uses machine learning techniques to analyze the order behavior in the book, enabling it to detect patterns and trends in orders, allowing you to make informed decisions about your trading operations. The color pale
SMT Divergences MT5
Diego Arribas Lopez
MT4 Version SMT Divergences MT5 SMT Divergences is one of the most innovative indicators in the market. It offers the possibility of analyzing price divergences between 2 pairs. These divergences highlight and help to foresee what banks and institutions are planning to do. SMT divergences also provides you with a kill zones indicator and the possibility of filtering divergences occurring during these kill zones.  This indicator is specially powerful if applied in 2 highly correlated pairs. A pri
Pro Thunder V10 Neural Network Indicator for MT5 | Binary Options & OTC Trading Signals Elevate your binary options trading with   Pro Thunder V10 , the ultimate AI-powered indicator engineered for MetaTrader 5. Leveraging cutting-edge Neural Networks and years of market expertise, this non-repaint tool delivers unmatched accuracy across all market conditions—including volatile news events, OTC markets, Deriv indices (Boom 300, Crash 500), and more. Join thousands of traders worldwide who trust
Reversal ALGO
Muhammad Abdullah Bhatti
Reversal Algo – Technical Indicator for Market Reversal Analysis Overview Reversal Algo is a sophisticated technical indicator meticulously engineered to help traders identify potential turning points in market trends. By thoroughly analyzing historical price data, it detects significant highs and lows that may signal an impending shift in market momentum. This indicator provides clear and distinct visual signals on your charts, allowing you to pinpoint key areas where trends might reverse. Des
Offer 249 down from 350 for the next 1 copies. then back to 350 $ Are you tired of using outdated indicators that leave you guessing where to set your profit targets? Look no further than the AK CAP Opening Range Breakout Indicator. This powerful tool is backed by a US patent and has already helped countless traders pass funded challenges like FTMO. We use it daily on our prop traders and internal funds, and now it's available to you as well. The calculation behind the indicator is incredibly a
IQ FX Gann Levels a precision trading indicator based on W.D. Gann’s square root methods. It plots real-time, non-repainting support and resistance levels to help traders confidently spot intraday and scalping opportunities with high accuracy. William Delbert Gann (W.D. Gann) was an exceptional market analyst, whose trading technique was based on a complex blend of mathematics, geometry, astrology, and ancient mathematics which proved to be extremely accurate. Download the Metatrader 4 Version M
Introduction Excessive Momentum Indicator is the momentum indicator to measure the excessive momentum directly from raw price series. Hence, this is an extended price action and pattern trading. Excessive Momentum Indicator was originally developed by Young Ho Seo. This indicator demonstrates the concept of Equilibrium Fractal Wave and Practical Application at the same time. Excessive Momentum detects the market anomaly. Excessive momentum will give us a lot of clue about potential reversal and
PZ Trend Trading MT5
PZ TRADING SLU
3.8 (5)
Capture every opportunity: your go-to indicator for profitable trend trading Trend Trading is an indicator designed to profit as much as possible from trends taking place in the market, by timing pullbacks and breakouts. It finds trading opportunities by analyzing what the price is doing during established trends. [ Installation Guide | Update Guide | Troubleshooting | FAQ | All Products ] Trade financial markets with confidence and efficiency Profit from established trends without getting whip
Super Zone indicator
Dmitriy Sotnikov
5 (1)
Super Zone   For several years of observing the principles of the market, Super Zone worked, both then and now, because the indicator  allows you to see the trading range of the  week and even the month that major market participants use. It’s very easy to use, we work on H4 in the weekly range (  in the tester it doesn’t work in the demo mode  ) - we sell from the upper zones, we buy from the lower ones. It marks the zones from the beginning of the week (month) that are  not redrawn  , works on
Introduction! to the Indicator that Connects Trend , Pattern , and Candlestick Trigger  3 Steps in Under 30 Seconds ️ Trade effortlessly — no analysis required, Your smart assistant is ready to simplify your workflow No more chart overload Trade with confidence using smart bias detection Compatible with all currencies, crypto, stocks, metals, indices, and any timeframe Just click and execute — it’s that simple Ideal for busy traders who want speed and clarity. TPTSyncX is a powerfu
TrendMaestro5
Stefano Frisetti
note: this indicator is for METATRADER4, if you want the version for METATRADER5 this is the link:  https://www.mql5.com/it/market/product/108106 TRENDMAESTRO ver 2.4 TRENDMAESTRO recognizes a new TREND in the bud, he never makes mistakes. The certainty of identifying a new TREND is priceless. DESCRIPTION TRENDMAESTRO identifies a new TREND in the bud, this indicator examines the volatility, volumes and momentum to identify the moment in which there is an explosion of one or more of these data a
This indicator is based on the mathematics of the great trader W.D. Ganna. With its help, you can easily find strong levels by analyzing swings to find the optimal entry point. The indicator works on all instruments and all timeframes. The indicator is fully manual and has control buttons. All you need to do is press the NEW button, a segment will appear, which you can place on any movement, swing or even 1 candle that you want to analyze. By placing the segment, press the OK button. A grid (th
PZ Swing Trading MT5
PZ TRADING SLU
5 (5)
Protect against whipsaws: revolutionize your swing trading approach Swing Trading is the first indicator designed to detect swings in the direction of the trend and possible reversal swings. It uses the baseline swing trading approach, widely described in trading literature. The indicator studies several price and time vectors to track the aggregate trend direction and detects situations in which the market is oversold or overbought and ready to correct. [ Installation Guide | Update Guide | Tro
This indicator identifies and displays zones, as it were areas of strength, where the price will unfold. The indicator can work on any chart, any instrument, at any timeframe. The indicator has two modes. The indicator is equipped with a control panel with buttons for convenience and split into two modes. Manual mode: To work with manual mode, you need to press the NEW button, a segment will appear. This segment is stretched over the movement and the LVL button is pressed. The level is displayed
Introduction to X3 Chart Pattern Scanner X3 Cherart Pattern Scanner is the non-repainting and non-lagging indicator detecting X3 chart patterns including Harmonic pattern, Elliott Wave pattern, X3 patterns, and Japanese Candlestick patterns. Historical patterns match with signal patterns. Hence, you can readily develop the solid trading strategy in your chart. More importantly, this superb pattern scanner can detect the optimal pattern of its kind. In addition, you can switch on and off individu
More from author
An oscillator that shows price changes and identifies areas of overbought and oversold. It can also show trend reversal points. WaveTrend Oscillator is a port of a famous TS /MT indicator. When the oscillator is above the overbought band (red lines) and crosses down the signal (solid line), it is usually a good SELL signal. Similarly, when the oscillator crosses above the signal when below the Oversold band (green lines), it is a good BUY signal. Good luck.
Optimized Trend Tracker OTT is an indicator that provides traders to find an existing trend or in another words to ser which side of the current trend we are on. We are under the effect of the uptrend in cases where the prices are above OTT , under the influence of a downward trend, when prices are below OTT it is possible to say that we are. The first parameter in the OTT indicator set by the two parameters is the period/length. OTT will be much sensitive to trend movements if it is sma
Murrey Math Lines The concept of this technical analysis system was developed by T. Henning Murrey in 1995 and described in The Murrey Math Trading System; For All Markets. The main concept here is that all markets behave in the same manner based upon the observations made by W.D. Gann. To date, the Murrey Math Line X it is one the most popular methods of Forex analysis and trading. Formula The Murrey Math Line X is calculated with the help of price movement segment, which, in accordance to Gan
Filter:
No reviews
Reply to review