• Overview
  • Reviews
  • Comments

Candle Perspective Structure Indicator MT5

Candle Perspective Structure Indicator

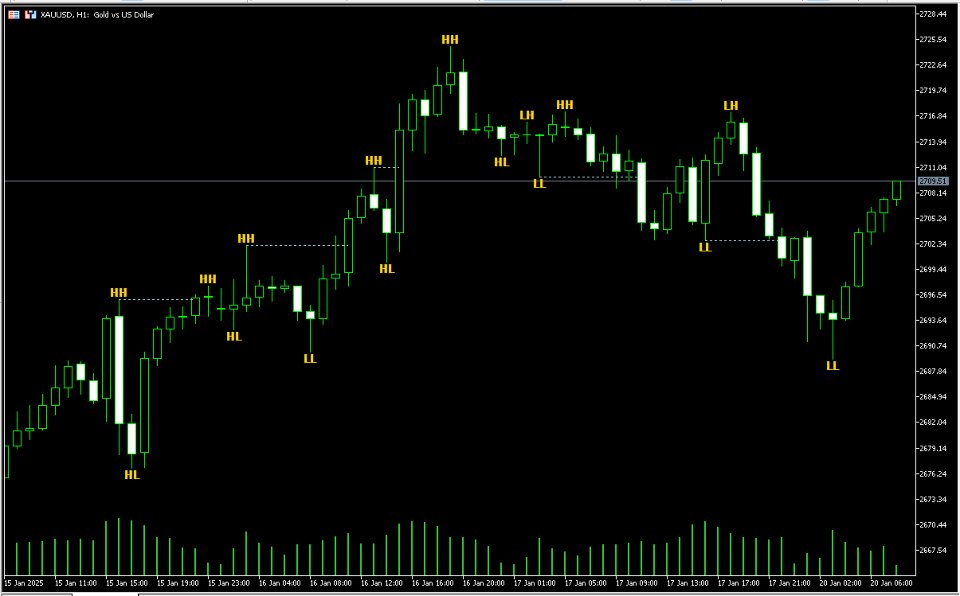
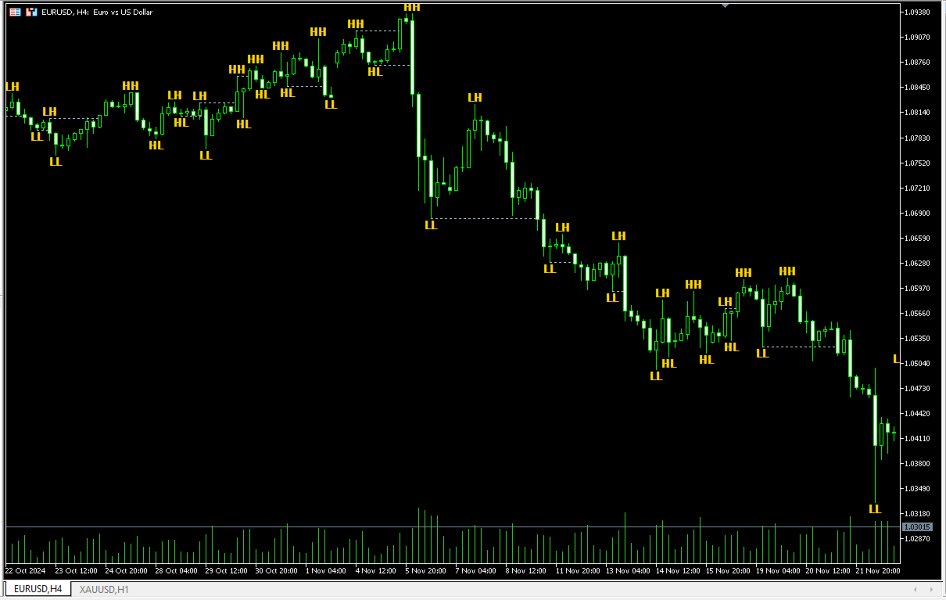
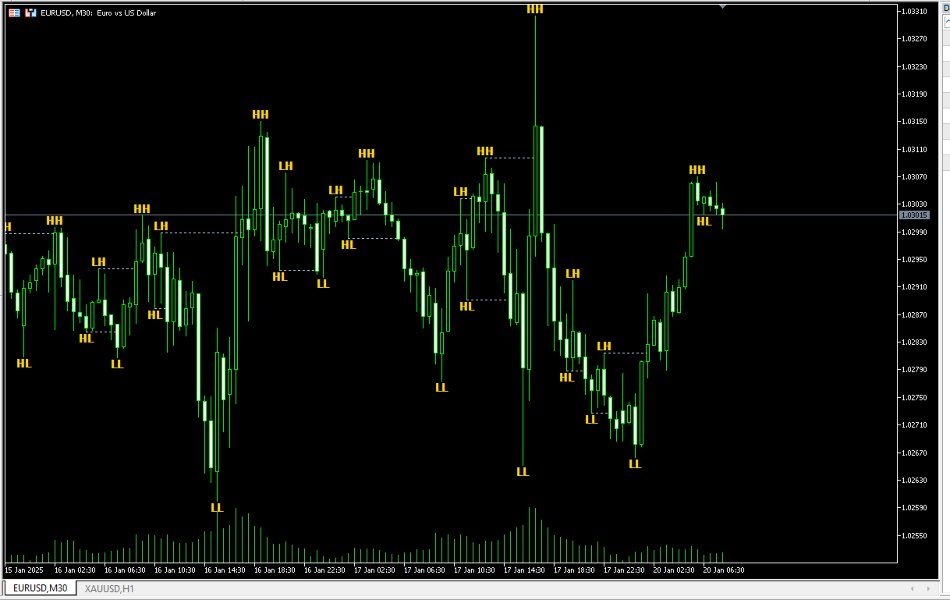
The Candle Perspective Structure indicator is a powerful tool designed for traders who analyze market structure using swing points and breakout levels. This indicator automatically identifies swing highs, swing lows, and break-of-structure (BOS) levels, displaying them visually on the chart for easier interpretation.

Key Features:

  1. Swing Highs and Lows Detection:

    • Identifies major turning points (swing highs and swing lows) based on candlestick patterns.
    • Categorizes swings into specific subtypes:
      • HH (Higher High)
      • LH (Lower High)
      • LL (Lower Low)
      • HL (Higher Low)
      • DB (Double Bottom or Top)
  2. Break-of-Structure (BOS) Visualization:

    • Plots BOS lines to indicate where price breaks key swing levels.
    • Customizable line styles, colors, and widths for better chart readability.
  3. Customizable Visual Elements:

    • Adjustable label sizes, colors, and visibility for swing points.
    • Fully configurable BOS line appearance.

Input Parameters:

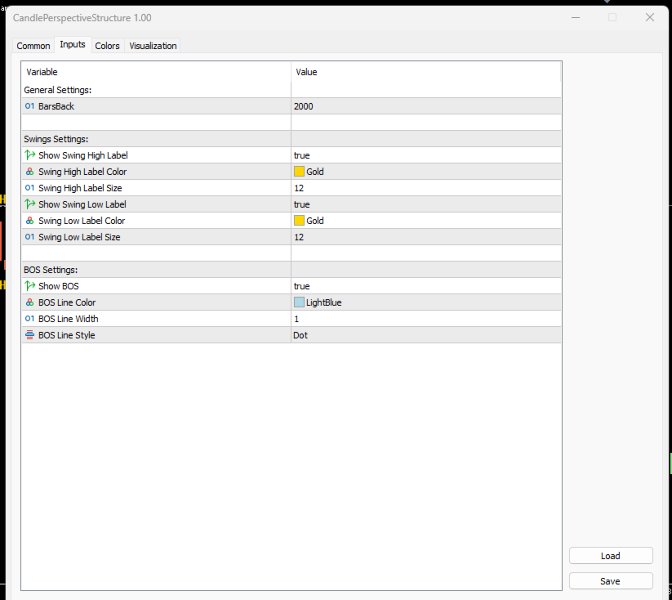
  1. General Settings:

    • BarsBack: Define how many past candles the indicator should analyze (default: 1000).
  2. Swing Settings:

    • ShowSwingHigh: Toggle the visibility of swing high labels.
    • SwingHighColor: Choose the color of swing high labels.
    • SwingHighSize: Adjust the font size of swing high labels.
    • ShowSwingLow: Toggle the visibility of swing low labels.
    • SwingLowColor: Choose the color of swing low labels.
    • SwingLowSize: Adjust the font size of swing low labels.
  3. BOS Settings:

    • ShowBOS: Enable or disable BOS line plotting.
    • BOSColor: Set the color of BOS lines.
    • BOSWidth: Define the thickness of BOS lines.
    • BOSStyle: Choose the BOS line style (solid, dashed, or dotted).

How It Works:

  1. The indicator scans historical price data for swing highs and lows.
  2. Once a swing point is detected, it categorizes the type (HH, LH, LL, HL) based on its relation to previous swings.
  3. If the price breaks a previous swing point, the indicator draws a BOS line to mark the breakout.
  4. All elements are dynamically updated as new bars form, ensuring the chart remains current.

Use Cases:

  • Market Structure Analysis: Gain a clear perspective on price dynamics by identifying key swing points and structural breakouts.
  • Trend Identification: Determine whether the market is in an uptrend, downtrend, or consolidating based on swing subtypes.
  • Entry/Exit Signals: Use BOS levels as potential breakout or reversal zones for trade execution.

Why Choose Candle Perspective Structure?

The indicator provides a robust framework for visualizing market structure, helping traders make informed decisions. Its intuitive design and flexibility allow traders to customize it to fit their trading style.

Compatible with all timeframes and instruments, this tool is suitable for both beginners and experienced traders aiming to improve their technical analysis precision.


More from author
MACD ADX Oscillator for MT5 Elevate your trading strategy with the MACD ADX Oscillator – a powerful indicator that combines the best of the Moving Average Convergence Divergence (MACD) and the Average Directional Index (ADX) to provide unparalleled insights into market momentum and trend strength. Key Features: Dual Momentum Analysis : This indicator merges MACD's ability to detect changes in market momentum with ADX's strength measurement, giving you a comprehensive view of the market's directi
Zero Lag SMA for MT5 The Zero Lag SMA (ZLSMA) indicator for MT5 provides a variation of the Simple Moving Average (SMA) designed to minimize lag, offering traders a more responsive moving average that adjusts more quickly to price changes. This makes it useful for identifying potential trend reversals and key price levels in a timely manner. Key Features: Zero Lag Calculation : The core of this indicator uses a double smoothing technique to reduce lag, providing faster responses to price movemen
FREE
ATR Bands with Take-Profit Zones for MT5 Optimize your risk management and trading strategy with the ATR Bands indicator for MT5 – a powerful tool designed to help you navigate market volatility, identify key price levels, and set realistic stop-loss and take-profit targets. Key Features: ATR-Based Bands : The core of this indicator relies on the Average True Range (ATR) to calculate dynamic upper and lower bands that adapt to market volatility. The bands provide a clear indication of potential
FREE
ATR Bands with Take-Profit Zones for MT4 The ATR Bands indicator for MT4 is designed to assist traders in managing risk and navigating market volatility. By using the Average True Range (ATR), it helps identify key price levels and set realistic stop-loss and take-profit zones. Key Features: ATR-Based Bands : The indicator calculates dynamic upper and lower bands using ATR. These bands adjust based on price volatility, helping to indicate potential support and resistance levels. Customizable Par
FREE
Heiken Ashi CE Filtered – Premium Buy/Sell Indicator with Advanced Filtering Introducing the "Heiken Ashi CE Filtered" – a high-quality custom indicator designed for traders seeking precision and clarity in their trading signals. This premium indicator combines the smooth visual simplicity of Heiken Ashi candles with the power of an ATR-based chandelier exit strategy and a zero-lag LSMA filter for highly reliable buy and sell signals. Key Features: Reliable Buy/Sell Signals: The indicator genera
Chandelier Exit for MT5 The Chandelier Exit indicator is designed to dynamically set stop-loss levels based on market volatility, measured through the Average True Range (ATR). It helps traders secure positions during trend changes by using price extremes and dynamic stop-losses for both long and short positions. Key Features: ATR-Based Stops : The indicator calculates stop-loss levels for long and short positions using a moving average of the True Range (ATR), adapting to market volatility chan
Percentage Price Oscillator (PPO) for MT5 Unlock deeper market insights with the Percentage Price Oscillator (PPO) for MT5 – a dynamic tool designed to measure price momentum and trend direction with precision. Core Features: Flexible Configuration : Customize the PPO to match your trading approach by adjusting the Fast Length, Slow Length, and Signal Length. The indicator is also versatile enough to adapt to any market condition with various source inputs. Intuitive Histogram Display : Choose t
Introducing the Triple EMA Trend Following + Signals Indicator – the perfect tool for traders seeking precise trend identification and actionable buy/sell signals! Key Features: Triple EMA Trend Analysis : This indicator uses two Triple Exponential Moving Averages (TEMA1 and TEMA2) to capture short-term and long-term trends effectively. TEMA1 reacts to rapid price changes, while TEMA2 filters out market noise, helping you stay on the right side of the trend. RSI and ATR Filters : It incorporates
Title: Advanced Trend Lines   Supports and Resistances Levels Overview: Enhance your trading decisions with this powerful Trend Lines Supports and Resistances Levels Indicator . This tool identifies key market structures such as trend lines, pivot points, and support/resistance zones, providing traders with actionable insights to spot potential breakout or reversal opportunities. Tailored for technical analysts, this indicator offers customizability and real-time alerts to match any trading str
Trend Levels Indicator Elevate your trading strategy with the Trend Levels Indicator , a sophisticated tool designed to detect market trends and highlight critical price levels. This cutting-edge indicator is packed with features to simplify trend analysis and empower your decision-making process. Key Features: Dynamic Trend Levels : Accurately plots high, mid, and low levels based on market dynamics. Custom Alerts & Notifications : Get real-time alerts and notifications when trends change, ensu
Filter:
No reviews
Reply to review