Candle Pips MT5
- Indicators
- Miguel Antonio Rojas Martinez
- Version: 2.5
- Updated: 16 November 2021
- Activations: 20
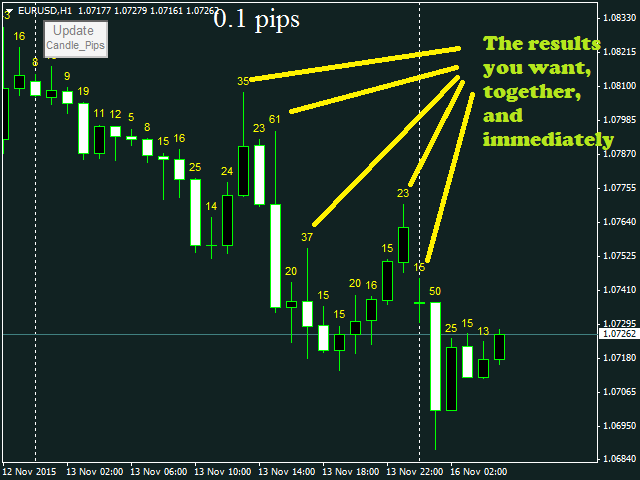
The "Candle Pips MT5" indicator is a tool that helps us a quick way to see the size of the candles on our platform; this is not only of great help to any trader who wants to study the market thoroughly, it is helpful in various strategies that are based on size of the candles.
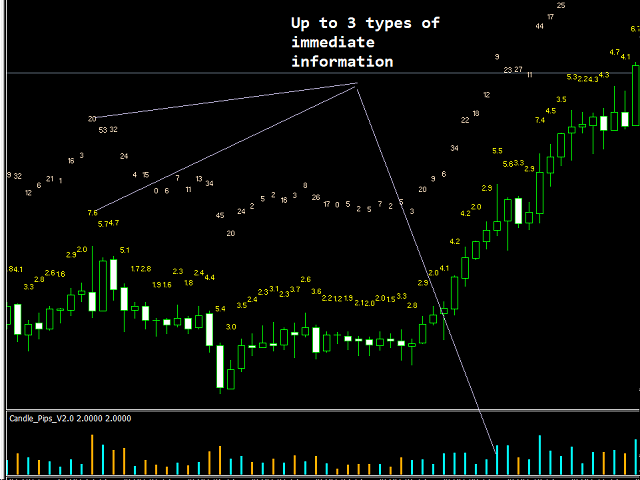
The indicator shows the value in Pips of each candle to our current graph, rounded to an integer.
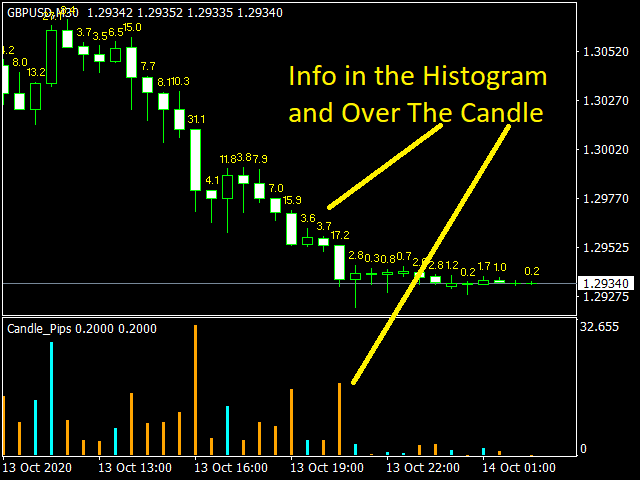
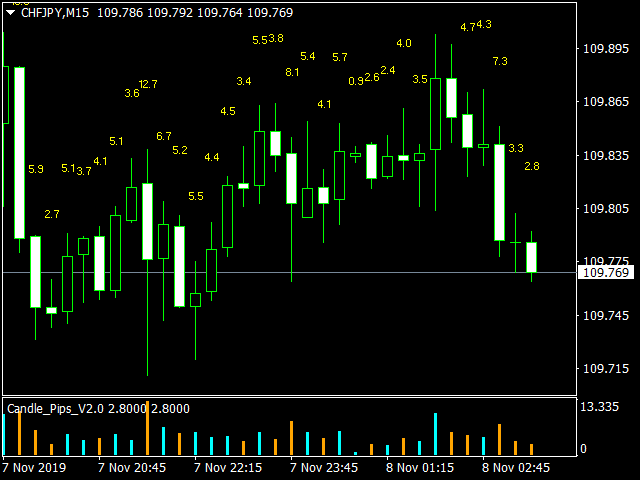
The indicator also shows the information as a histogram, at the bottom of the graph.
It has simple inputs:
- Candle Type: this entry allows you to select which part of the Candle we want to measure. If you select "High__Low" will give us the full value of the candle, the distance between the maximum and minimum of each of the candles. If you select "Open__Close" We give only the value of the candle body, excluding the Wicks.
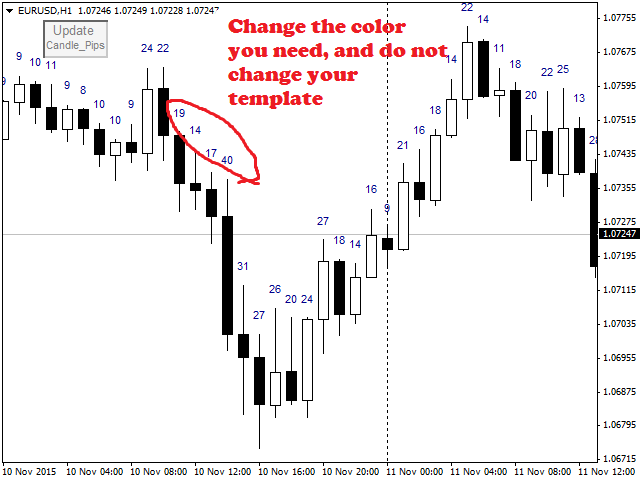
- Color_Values: in this entry, change the color with which the measurement result of each candle will be shown, in this way do not have to change your template.
- Distance_of_Price: from here you can configure the distance of the result that shows the size of the Candle, with respect to the high of the same.
- Decimal: This option select whether or not to (True, False), see the measurement result to an integer digit, approximate, or see the most actual result, with the decimal digit.
- Pos: With this option we allow the setting of a second indicator "Candle Pips" in the same graph, and thus see the 2 options price "High__Low" and "Open__Close", the default is 0, the setting of a new indicator it should have as value 1.
- Measure: It allows us to choose if the information shown is in pips or points
- Font_Size: It allows to adjust the size of the letter, of the information shown
- Minimum Points: Allows you to adjust the size of the displayed candles, 0 is the same as showing all the candles
- Alerts ?: With this option we alert that the current candle has reached the minimum pips
- Button Show/Hide: with this option we select IF we want or NOT (True, False), show the numerical information above the candles


very, very useful. Thanks!