• Overview
  • Reviews
  • Comments
  • What's new

Simple Smart Mney Concepts

This Simple Smart Money Concepts indicator displays real-time market structure (internal & swing BOS / CHoCH), order blocks, premium & discount zones, equal highs & lows, and much more...allowing traders to automatically mark up their charts with widely used price action methodologies.

"Smart Money Concepts" (SMC) is used term amongst price action traders looking to more accurately navigate liquidity & find more optimal points of interest in the market. Trying to determine where institutional market participants have orders placed can be a very reasonable approach to finding more practical entries & exits based on price action.

Key Features

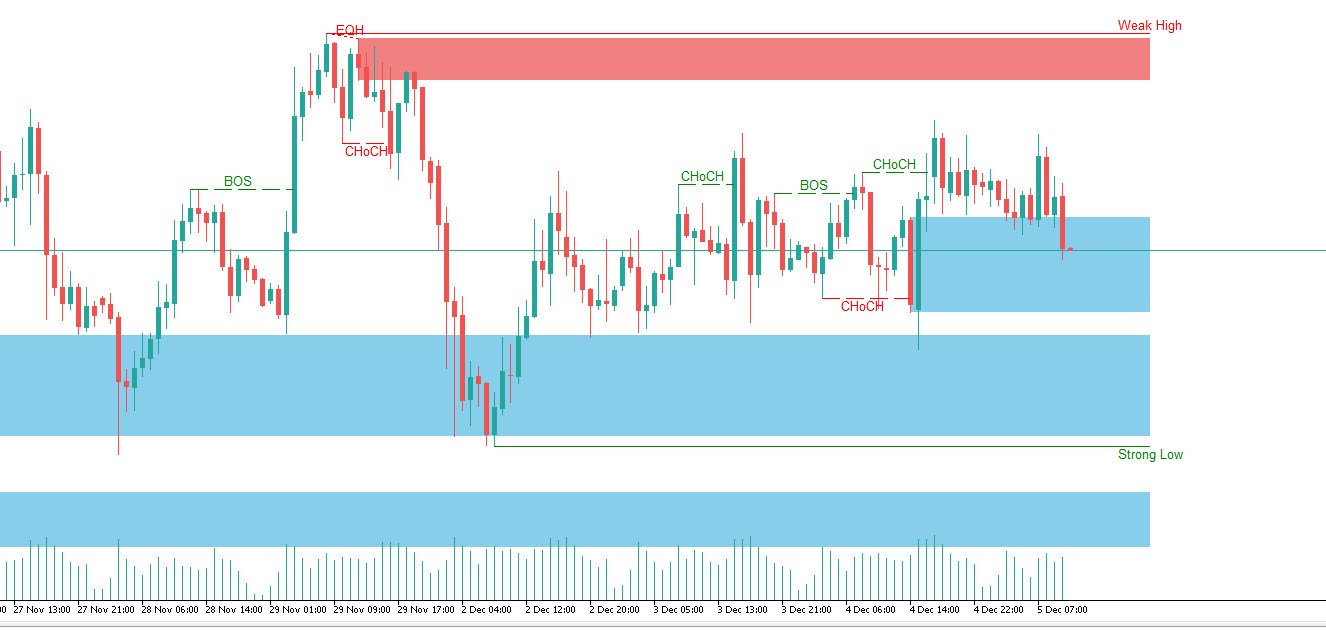
  1. Internal and Swing market structure in real-time:

    • Internal Structures: These elements refer to the price formations and patterns that occur within a smaller scope or a specific trading session. The suite can detect intricate details like minor support/resistance levels or short-term trend reversals.

    • External Structures: These involve larger, more significant market patterns and trends spanning multiple sessions or time frames. This capability helps traders understand overarching market directions.

  2. HH/LH/LL/LH Areas:
    • Identifying Higher Highs (HH), Lower Highs (LH), Lower Lows (LL), and Lower Highs (LH) helps in understanding the trend and market structure, aiding in predictive analysis.

  3. Break of Structure (BOS):
    • This feature identifies points where the price breaks a significant structure, potentially indicating a new trend or a trend reversal.

  4. Change of Character (CHoCH):
    • Detects subtle shifts in the market's behavior, which could suggest the early stages of a trend change before they become apparent to the broader market.

  5. Order Blocks:
    • These are essentially price levels or zones where significant trading activities previously occurred, likely pointing to the positions of smart money.

  6. Equal Highs and Lows
    • Displays EQH/EQL labels on chart for detecting equal highs & lows.
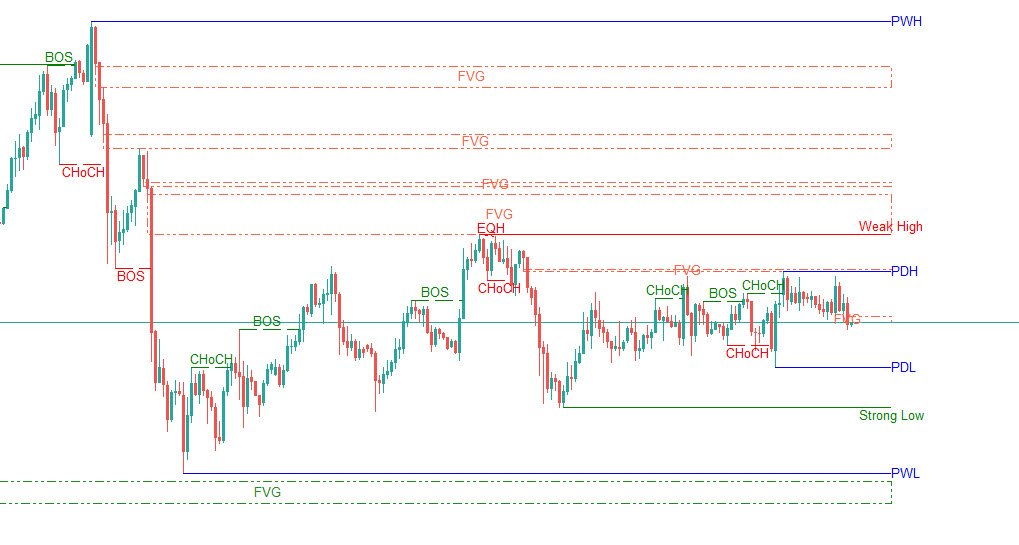
  7. Fair Value Gaps:
    • Fair Value Gaps: A three candle formation where the candle shadows adjacent to the central candle do not overlap, this highlights a gap area.

  8. Previous Highs & Lows:
    • Allows the user to display previous highs & lows from daily, weekly, & monthly timeframes as significant levels.

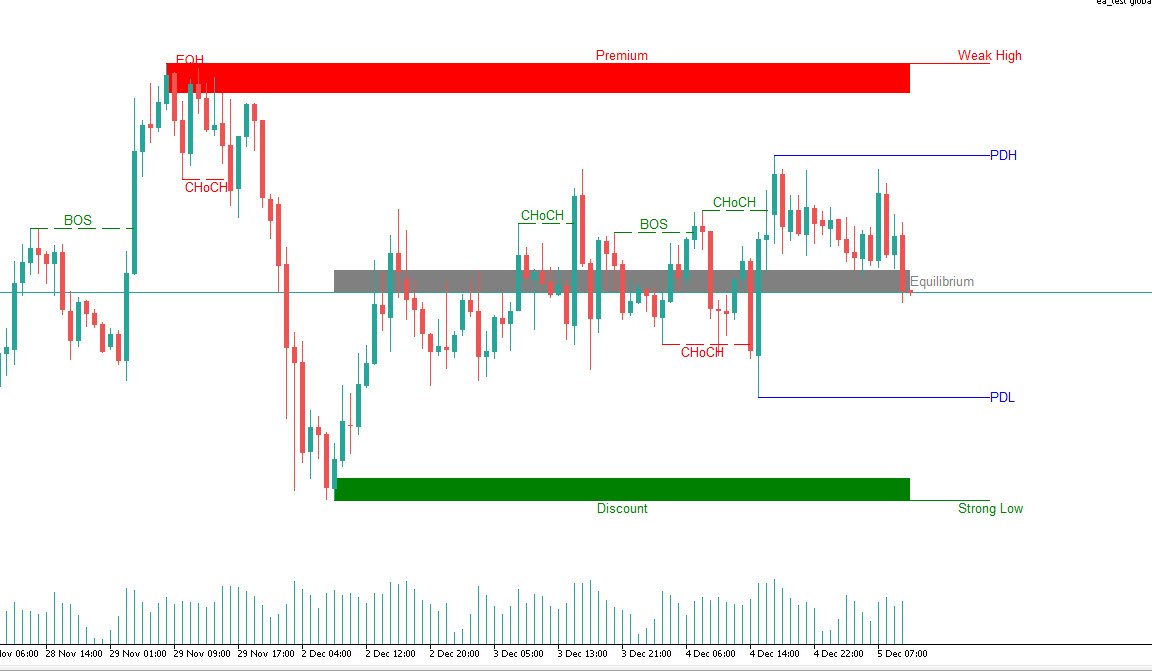
  9. Premium & Discount Zones as a range:
    • Allows the user to display Premium, Discount, and Equilibrium zones on the chart
  10. EA Integration:
    • Using Global Variables.
    • Update the global variables on every bar close.
    • Always add the lastest price value of the elements as following struct:
      • Order Block Internal Structures 
        • (Symbol)_(Period)_(Prefix Global input)_(BULL or BEAR)_IS_OB_TOP (Lastest Internal OB Top price. Ex: XAUUSD_16385_CMQ_SMC_IS_BULL_OB_TOP )
        • (Symbol)_(Period)_(Prefix Global input)_(BULL or BEAR)_IS_OB_BOTTOM  (Lastest Internal OB Bottom price. Ex: XAUUSD_16385_CMQ_SMC_IS_BULL_OB_BOTTOM )
        • (Symbol)_(Period)_(Prefix Global input)_(BULL or BEAR)_IS_OB_TIME  (Lastest Internal OB Time Created. Ex: XAUUSD_16385_CMQ_SMC_IS_BULL_OB_TIME )
        • (Symbol)_(Period)_(Prefix Global input)_(BULL or BEAR)_IS_OB_TOUCHED_TIME  (Lastest Internal OB First touched time. Ex: XAUUSD_16385_CMQ_SMC_IS_BULL_OB_TOUCHED_TIME)
      • Order Block Swing Structures 
        • (Symbol)_(Period)_(Prefix Global input)_(BULL or BEAR)_SW_OB_TOP (Lastest Swing OB Top price. Ex: XAUUSD_16385_CMQ_SMC_SW_BULL_OB_TOP )
        • (Symbol)_(Period)_(Prefix Global input)_(BULL or BEAR)_SW_OB_BOTTOM  (Lastest Swing OB Bottom price. Ex: XAUUSD_16385_CMQ_SMC_SW_BULL_OB_BOTTOM )
        • (Symbol)_(Period)_(Prefix Global input)_(BULL or BEAR)_SW_OB_TIME  (Lastest Swing OB Time Created. Ex: XAUUSD_16385_CMQ_SMC_SW_BULL_OB_TIME )
        • (Symbol)_(Period)_(Prefix Global input)_(BULL or BEAR)_SW_OB_TOUCHED_TIME  (Lastest Swing OB First touched time. Ex: XAUUSD_16385_CMQ_SMC_SW_BULL_OB_TOUCHED_TIME)
      • Fair value gaps
        • (Symbol)_(Period)_(Prefix Global input)_(BULL or BEAR)_FVG_TOP   (Lastest  FVG Top price. Ex: XAUUSD_16385_CMQ_SMC_BULL_FVG_TOP )
        • (Symbol)_(Period)_(Prefix Global input)_(BULL or BEAR)_FVG_BOTTOM   (Lastest  FVG  Bottom price. Ex: XAUUSD_16385_CMQ_SMC_BULL_FVG_ BOTTOM  )
        • (Symbol)_(Period)_(Prefix Global input)_(BULL or BEAR)_FVG_MID   (Lastest  FVG  Middle price. Ex: XAUUSD_16385_CMQ_SMC_BULL_FVG_MID )
        • (Symbol)_(Period)_(Prefix Global input)_(BULL or BEAR)_FVG_TIME   (Lastest  FVG Time  Created. Ex: XAUUSD_16385_CMQ_SMC_BULL_FVG_TIME )
        • (Symbol)_(Period)_(Prefix Global input)_(BULL or BEAR)_FVG_TOUCHED_TIME  (Lastest  FVG First touched time. Ex: XAUUSD_16385_CMQ_SMC_BULL_FVG_TOUCHED_TIME)
      • BOS/CHOCH  Internal Structures 
        • (Symbol)_(Period)_(Prefix Global input)_(BULL or BEAR)_CHOCH (Lastest CHOCH price. Ex: XAUUSD_16385_CMQ_SMC_BULL_CHOCH)
        • (Symbol)_(Period)_(Prefix Global input)_(BULL or BEAR)_CHOCH_TIME (Lastest CHOCH Time Created. Ex: XAUUSD_16385_CMQ_SMC_BULL_CHOCH_TIME)
        • (Symbol)_(Period)_(Prefix Global input)_(BULL or BEAR)_BOS  (Lastest BOS price. Ex: XAUUSD_16385_CMQ_SMC_BULL_BOS)
        • (Symbol)_(Period)_(Prefix Global input)_(BULL or BEAR)_BOS_TIME  (Lastest BOS Time Created. Ex: XAUUSD_16385_CMQ_SMC_BULL_BOS_TIME)
      • BOS/CHOCH  Swing Structures 
        • (Symbol)_(Period)_(Prefix Global input)_(BULL or BEAR)_SW_CHOCH (Lastest swing CHOCH price. Ex: XAUUSD_16385_CMQ_SMC_SW_BULL_CHOCH)
        • (Symbol)_(Period)_(Prefix Global input)_(BULL or BEAR)_SW_CHOCH_TIME (Lastest swing CHOCH Time Created. Ex: XAUUSD_16385_CMQ_SMC_SW_BULL_CHOCH_TIME)
        • (Symbol)_(Period)_(Prefix Global input)_(BULL or BEAR)_SW_BOS  (Lastest swing BOS price. Ex: XAUUSD_16385_CMQ_SMC_SW_BULL_BOS)
        • (Symbol)_(Period)_(Prefix Global input)_(BULL or BEAR)_SW_BOS_TIME  (Lastest swing BOS Time Created. Ex: XAUUSD_16385_CMQ_SMC_SW_BULL_BOS_TIME)
      • Swing point
        • (Symbol)_(Period)_(Prefix Global input)_HH (Lastest HH price. Ex: XAUUSD_16385_CMQ_SMC_HH)
        • (Symbol)_(Period)_(Prefix Global input)_LH  (Lastest LH price. Ex: XAUUSD_16385_CMQ_SMC_LH)
        • (Symbol)_(Period)_(Prefix Global input)_HL  (Lastest HL price. Ex: XAUUSD_16385_CMQ_SMC_HL)
        • (Symbol)_(Period)_(Prefix Global input)_LL  (Lastest LL price. Ex: XAUUSD_16385_CMQ_SMC_LL)
      • Swing High/Low
        • (Symbol)_(Period)_(Prefix Global input)_SWING_HIGH  (Swing high price. Ex: XAUUSD_16385_CMQ_SMC_SWING_HIGH )
        • (Symbol)_(Period)_(Prefix Global input)_SWING_HIGH_TIME (Swing  high time. Ex: XAUUSD_16385_CMQ_SMC_SWING_HIGH_TIME )
        • (Symbol)_(Period)_(Prefix Global input)_SWING_LOW (Swing low price. Ex: XAUUSD_16385_CMQ_SMC_SWING_LOW )
        • (Symbol)_(Period)_(Prefix Global input)_SWING_LOW_TIME  (Swing low time. Ex: XAUUSD_16385_CMQ_SMC_SWING_LOW_TIME )
      • Previous Highs and Lows
        • (Symbol)_(Period)_(Prefix Global input)_DAILY_HIGH (Daily high price. Ex: XAUUSD_16385_CMQ_SMC_DAILY_HIGH  )
        • (Symbol)_(Period)_(Prefix Global input)_DAILY_LOW (Daily low price. Ex: XAUUSD_16385_CMQ_SMC_DAILY_LOW  )
        • (Symbol)_(Period)_(Prefix Global input)_WEEKLY_HIGH (Weekly high price. Ex: XAUUSD_16385_CMQ_SMC_WEEKLY_HIGH  )
        • (Symbol)_(Period)_(Prefix Global input)_WEEKLY_LOW  (Weekly low price. Ex: XAUUSD_16385_CMQ_SMC_WEEKLY_LOW )
        • (Symbol)_(Period)_(Prefix Global input)_MONTHLY_HIGH  (Monthly high price. Ex: XAUUSD_16385_CMQ_SMC_MONTHLY_HIGH )
        • (Symbol)_(Period)_(Prefix Global input)_MONTHLY_LOW  ( Monthly low price. Ex: XAUUSD_16385_CMQ_SMC_MONTHLY_LOW )
      • Premium, Discount, and Equilibrium Zones
        • (Symbol)_(Period)_(Prefix Global input)_PREMIUM_HIGH (Premium top price. Ex: XAUUSD_16385_CMQ_SMC_PREMIUM_HIGH   )
        • (Symbol)_(Period)_(Prefix Global input)_PREMIUM_LOW (Premium bottom price. Ex: XAUUSD_16385_CMQ_SMC_PREMIUM_LOW  )
        • (Symbol)_(Period)_(Prefix Global input)_DISCOUNT_HIGH (Discount top price. Ex: XAUUSD_16385_CMQ_SMC_DISCOUNT_HIGH  )
        • (Symbol)_(Period)_(Prefix Global input)_DISCOUNT_LOW  (Discount bottom price. Ex: XAUUSD_16385_CMQ_SMC_DISCOUNT_LOW )
        • (Symbol)_(Period)_(Prefix Global input)_EQUILIBRIUM_HIGH  (Equilibrium top price. Ex: XAUUSD_16385_CMQ_SMC_EQUILIBRIUM_HIGH )
        • (Symbol)_(Period)_(Prefix Global input)_EQUILIBRIUM_LOW  (Equilibrium bottom price. Ex: XAUUSD_16385_CMQ_SMC_EQUILIBRIUM_LOW )
      • Equal Highs and Lows
        • (Symbol)_(Period)_(Prefix Global input)_EQH_FIRST (Equal high first price. Ex: XAUUSD_16385_CMQ_SMC_EQH_FIRST)
        • (Symbol)_(Period)_(Prefix Global input)_EQH_SECOND (Equal high second price. Ex: XAUUSD_16385_CMQ_SMC_EQH_SECOND)
        • (Symbol)_(Period)_(Prefix Global input)_EQH_TIME (Equal high time. Ex: XAUUSD_16385_CMQ_SMC_EQH_TIME)
        • (Symbol)_(Period)_(Prefix Global input)_EQL_FIRST  (Equal low first price. Ex: XAUUSD_16385_CMQ_SMC_EQL_FIRST)
        • (Symbol)_(Period)_(Prefix Global input)_EQL_SECOND ( Equal low second price. Ex: XAUUSD_16385_CMQ_SMC_EQL_SECOND)
        • (Symbol)_(Period)_(Prefix Global input)_EQL_TIME  (Equal low time . Ex: XAUUSD_16385_CMQ_SMC_EQL_TIME )

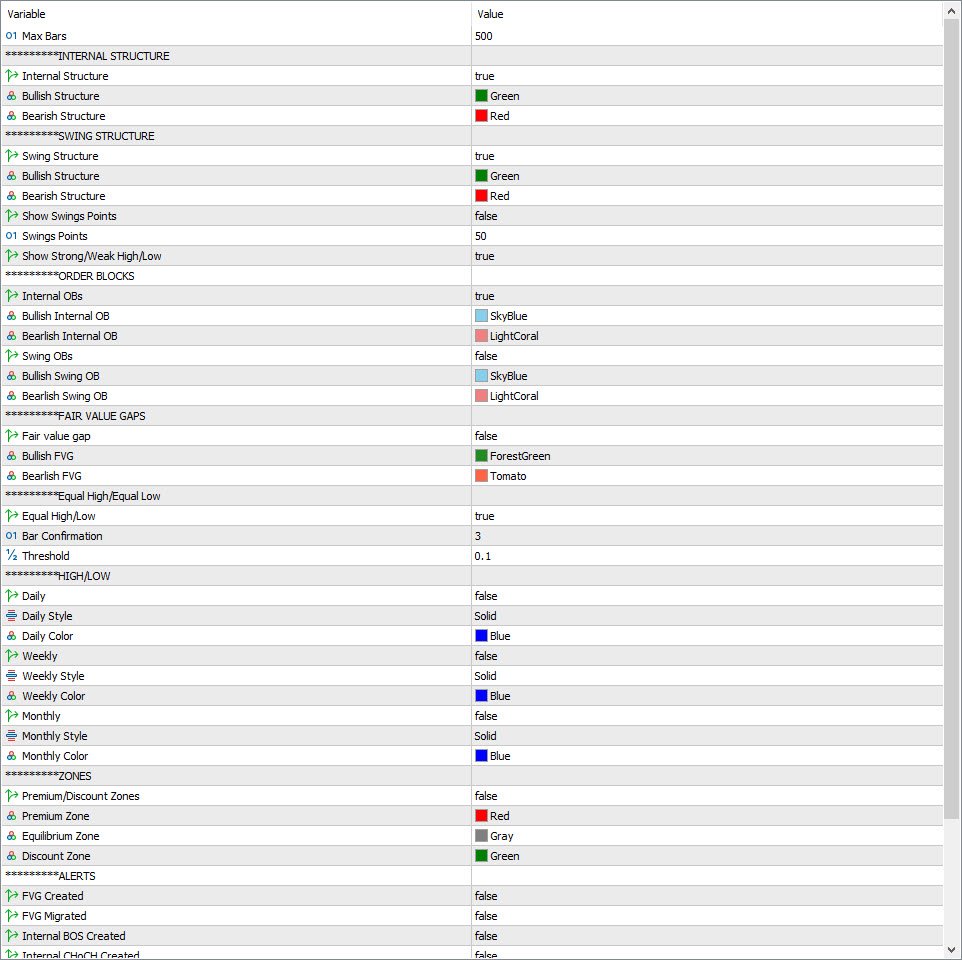
Customizable Features

  • Users can adjust settings like data length, colors, and display styles to match their trading preferences.

Benefits for Traders

  • Saves time on manual analysis, enhancing trading efficiency.
  • Helps make quick and informed decisions during volatile market conditions.
  • Easy to use for both beginners and experienced traders.

Conclusion


The Simple Smart Money Concepts Indicator is not just a tool but a comprehensive solution for traders looking to effectively implement ICT strategies. It’s a robust choice for enhancing market analysis and executing precise trades.


Recommended products
RAD CRITICAL LEVES RAD indicator tracks “Relevant Volume” in real time, identifying accumulation and distribution processes, projecting them in the chart as SUPPORT or RESISTANCE zones. Natural   support   and resistance levels are generated by Volume Accumulation and Distribution processes. As these processes evolve, levels at which the relevant volume in the market place is positioned, become difficult areas to cross upwards or downwards. By using this information, traders can identify very s
WAPV Box Effort x Result
Eduardo Da Costa Custodio Santos
WA_PV_BOX_EFFORT X RESULT for MT5 The WAPV Box Effort x Result Indicator is part of the Package Indicators group (Wyckoff Academy Wave Market). The WAPV Box Effort x Result Indicator for MT5 helps you in reading price and volume. Its reading consists of assisting in the identification of effort x result in waves created by the graph. The WAPV Box Effort x Result Indicator for MT5 when the box is green means that the volume is in favor of the demand and when the box is red volume is in favor of s
RSI back arrows
Smaylle Rafael Coelho Mariano
The   RSI Back Arrows   indicator is a powerful tool designed for traders who rely on the Relative Strength Index (RSI) to identify potential market reversals. This indicator specifically highlights when the RSI has exited the   oversold   or   overbought   zones, providing clear visual signals to inform trading decisions. Key Features: Visual Cues : The indicator marks arrows on the chart when the RSI crosses back into a neutral zone, making it easy to spot potential entry and exit points. Over
FREE
Weis Waves
Flavio Javier Jarabeck
2.83 (18)
The original author is David Weis, an expert in the Wyckoff Method. The Weis Wave is a modern adaptation of the 1930's Wyckoff Method, another expert in Tape Reading techniques and Chart Analysis. Weis Waves takes market volume and stacks it into waves according to price conditions giving the trader valuable insights about the market conditions. If you want to learn more about this subject you can find tons of videos in YouTube. Just look for "The Wickoff Method", "Weis Wave" and "Volume Spread
FREE
HiqIndi
Ratul Goswami
It is 1 Minute Strategy. When Indicator Gives Signal Then Put on Buy. It's Best Work on Crash 300 & Crash 500. If you want to know anything details please Contact Me on Telegram In this Link:  https://t.me/+mi_52VwFp3E4MGNl It is very nice for scalping & for who not gives enough time on market. N/B: Please be carefully it's only for scalping & not trade all the day. It's only 10 or maximum 15 trade per day. Thanks everyone.
Balance Aggression
Edson Cavalca Junior
The indicator measures the balance of aggression. The formula is as follows:   Aggression  = Purchase Volume - Sales Volume. Note : It is rec ommended to use the default configuration and VPS values. It does not work in Forex. Meet Our Products     Parameters : Numbers of days prior to the current one for calculation; Volume Divider e; Enables calculation of the current candle; Histogram Line style and; Size; Line Line style and; Size;  Follow us on our website to check the next news.
Are you tired of drawing trendlines every time you're analyzing charts? Or perhaps you would like more consistency in your technical analysis. Then this is for you. This indicator will draw trend lines automatically when dropped on a chart. How it works Works similar to standard deviation channel found on mt4 and mt5. It has 2 parameters: 1. Starting Bar 2. Number of bars for calculation The   starting bar   is the bar which drawing of the trend lines will begin, while the   number of bars for c
FREE
LT Donchian Channel
Thiago Duarte
4.83 (6)
Donchian Channel is an indicator created by Richard Donchian. It is formed by taking the highest high and the lowest low of the last specified period in candles. The area between high and low is the channel for the chosen period. Its configuration is simple. It is possible to have the average between the upper and lower lines, plus you have alerts when price hits one side. If you have any questions or find any bugs, please contact me. Enjoy!
FREE
Value Chart Candlesticks
Flavio Javier Jarabeck
4.73 (11)
The idea of a Value Chart indicator was presented in the very good book I read back in 2020 , " Dynamic Trading Indicators: Winning with Value Charts and Price Action Profile ", from the authors Mark Helweg and David Stendahl. The idea is simple and the result is pure genius: Present candlestick Price analysis in a detrended way! HOW TO READ THIS INDICATOR Look for Overbought and Oversold levels. Of course, you will need to test the settings a lot to find the "correct" one for your approach. It
FREE
This product is designed for the MT5 platform and offers two key features: VWAP (Volume Weighted Average Price) calculation and Volume Profile analysis. Advantages: VWAP Calculation: The product calculates the VWAP, which is a popular indicator used by traders to determine the average price of a security based on its trading volume. It helps identify potential buying or selling opportunities by comparing the current price to the average price weighted by volume. Volume Profile Analysis: The prod
A Média Móvel é um indicador que faz parte da Análise Técnica. Com ela, é possível identificar o equilíbrio dos preços no mercado, observando tendências de alta, neutra ou baixa. Este indicador customizado traz opções extras pera definir o método de cálculo podendo-se esclolher entre SMA,EMA,SSMA,LWMA,JJMA,JurX,ParMA,T3,Vidya,AMA,HULL MA. Também conta com varias opções para escolher o método de cálculo para o preço base a ser usado no cáculo da média.
Hello I Want to introduce The Forex Buy Sell Arrow Premium MT5 i recently release this premium indicator! its 1000% Non Repaint Indicator, It Work Perfectly Well,, i tested it day by day, Just mind blowing Result,  Including Powerful trend Algorithm! How It Work? well, it work market trend formula, when trend Bullish Or when trend Bearish,  Recommend Timeframe M30, H1 it work all timeframe, and all currency pair, 100% non repaint, How to take signal From Forex Buy Sell Arrow Premium Ind
Visual Heatmap Book Analyzer
Alexandre Moraes De Souza Lima
Visual Heatmap Book Analyser This indicator monitors the market liquidity and generates colors based on order patterns, quantities, and renewal activities in the book. This allows you to visualize the order flow and identify areas of high and low liquidity and activity. The indicator uses machine learning techniques to analyze the order behavior in the book, enabling it to detect patterns and trends in orders, allowing you to make informed decisions about your trading operations. The color pale
Adjustable Consecutive Fractals  looks for 2 or more fractals in one direction and sends out a on screen alert, sound alert and push notification, for strong reversal points . Adjustable Consecutive Fractals, shows the fractals on chart along with a color changing text for buy and sell signals when one or more fractals appear on one side of price. Adjustable Consecutive Fractals is based Bill Williams Fractals . The standard Bill Williams fractals are set at a non adjustable 5 bars, BUT withe th
Wave Box Market Frenquency
Jean Jacques Huve Ribeiro
4.75 (4)
Totally linked to the result of a movement and the duration he had. Its height records how many ticks the asset walked during a given movement, its width shows us the duration that movement had. Its configuration must be in line with the Weis Wave Indicator configuration to observe the movement force and can indicate a possible accumulation or distribution of the movement;
FREE
This is Gekko's Cutomized Cutomized Average Directional Index (ADX), a customized version of the famous ADX indicator. Use the regular ADX and take advantage two entry signals calculations and different ways of being alerted whenever there is potential entry or exit point. Inputs Period: Period for the ADX calculation; PlotSignalType: How will the indicator calculate entry (swing) signals: 1- ShowSwingsOnTrendLevel : Show Signals for Trend Confirmation Swings; 2- ShowSwingsOnTrendLevelDirection
The volume weighted average price (VWAP) is a trading benchmark used by traders that gives the average price a security has traded at throughout the day, based on both volume and price. It is important because it provides traders with insight into both the trend and value of a security. This version is simple to use as we simplify the indicator entries and leave only the most used buffers. You can use it to integrate with your EA          Product Features Daily VWAP ploted at the chart. MOnthly
White Weis Volume Ticks
Ricardo Almeida Branco
5 (4)
White Weis Volume This indicator shows the sum of the volume in each wave, bulish or bearish, as idealized by David Weis , but it brings an important addition , which is the marking of the bar with the highest volume of the wave (White Bar)! In coding the indicator, it was sought to optimize the code to require minimal processing during use and not to overload mt5. The indicator can be used for pre-trading analysis and study, where the trader analyzes possible points of support and resistance
The indicator measures the accumulated balance of aggression. The formula is as follows:  Accumulated   = Previous Candle Accumulated + Purchase Volume - Sales Volume. Know our products    *** Did you like the product? Then, help us doing review in the " Reviews " tab. The indicator sends information to your email or cell phone when the accumulated balance changes direction. Example : Accumulated seller becomes a buyer. Note : It is recommended to use the default configuration and VPS valu
Volume Zone Fractal
Eduardo Da Costa Custodio Santos
VZO Plus is an indicator that shows overbought and oversold regions based on traded volume. #When the indicator line is between -40 and -60 it is oversold #When the indicator line is between 40 and 60 it is overbought. Outside these regions, the market is following its natural path by inertia. Above the green line, it means that the market is positive, Another way to analyze the indicator is through divergence regions. When we have the bottom higher than the other in a downtrend or One bottom
Order Book, known also as Market Book, market depth, Level 2, - is a dynamically updated table with current volumes of orders to buy and to sell specific financial instument at price levels near Bid and Ask. MetaTrader 5 provides the means for receiving market book from your broker, but in real time only, without access to its history. The indicator OrderBook Cumulative Indicator accumulates market book data online and visualizes them on the chart. In addition, the indicator can show the market
Flow Bookmap
Thalles Nascimento De Carvalho
Flow Bookmap: Visualize Market Flow and Protect Your Trades ️ WANT TO MASTER THE MARKET WITH PRECISE INFORMATION ABOUT BUYERS AND SELLERS? Flow Bookmap is the ultimate tool for traders looking to understand market behavior in depth. It transforms order flow data into an intuitive interface on the MT5 chart, highlighting critical areas of interest for quick and secure decision-making. How It Works Flow Bookmap interprets the interaction between buyers and sellers in the market, highligh
Cybertrade Double Bollinger Bands - MT5  The Bollinger Bands indicator shows the levels of different highs and lows that a security price has reached in a given duration and also their relative strength, where the highs are close to the upper line and the lows are close to the lower line. Our differential is to present this indicator in a double form, with the availability of its values ​​to simplify automation. It works on periods longer than the period visible on the chart. All values ​​are
FREE
Mini Chart Indicators
Flavio Javier Jarabeck
The Metatrader 5 has a hidden jewel called Chart Object, mostly unknown to the common users and hidden in a sub-menu within the platform. Called Mini Chart, this object is a miniature instance of a big/normal chart that could be added/attached to any normal chart, this way the Mini Chart will be bound to the main Chart in a very minimalist way saving a precious amount of real state on your screen. If you don't know the Mini Chart, give it a try - see the video and screenshots below. This is a gr
The indicator show Higher timeframe candles for ICT technical analisys Higher time frames reduce the 'noise' inherent in lower time frames, providing a clearer, more accurate picture of the market's movements. By examining higher time frames, you can better identify trends, reversals, and key areas of support and resistance. The Higher Time Frame Candles indicator overlays higher time frame data directly onto your current chart. You can easily specify the higher time frame candles you'd li
Reverso 1
Armand Gonto
Reverso 1.0 est un Indicateur Technique basé sur la tendance. Cet Indicateur intègre une formule exceptionnelle qui permet de décider au croisement du signal et du prix de clôture d'entrer dans le marché. Le timeframe indiqué est compris entre 2H et 1D. Les symboles que je conseille sont les suivants: BTCUSD-ETHUSD XAUGBP-XAUEUR-XAUAUD-XAGEUR-XAUUSD NZDJPY-GBPUSD-EURJPY-GBPJPY-USDJPY-CHFJPY-CADJPY-AUDJPY
Indicador Regressão Linear – Par de Ativos - INTRADAY Indicador é um oscilador que faz o plot do Resíduo resultado da regressão linear entre os dois ativos inseridos como input do indicador, representado pela fórmula: Y = aX + b + R Onde Y é o valor do ativo dependente, X é o valor do ativo independente, a é a inclinação da reta entre os dois ativos, b é a intersecção da reta e R é o resíduo. O resíduo representa a quantidade da variabilidade que Y que o modelo ajustado não consegue explicar. E
FREE
Trend ADX RSI volume
Smaylle Rafael Coelho Mariano
The   Trend ADX RSI Volumes   is an advanced technical indicator that combines the Average Directional Index (ADX), the Relative Strength Index (RSI), and volume information to provide a comprehensive analysis of market trends. This indicator is designed to help traders identify not only the strength of a trend but also its direction and validity. Key Features of the Indicator Trend Strength Measurement : The   ADX   quantifies the strength of a trend on a scale from 0 to 100. Values above 25 ge
FREE
Hello There, Today I want to show you my new researchable fore BUY SELL indicator, it work all asset, and also work Derive Volatility asset! it work all time frame, but i recommend start 5 minute to H1 when you receive a signal just take trade and stay wait for your take profit asset All Major Pair And minor IT WORK ALSO XAUUSD Fantastic results,  for more info,,, message us thank you   
True Day
Aurthur Musendame
5 (1)
True Days is a tool designed specifically for the trader who wants to catch intraday volatility in price charts.  True day makes it easier for the trader to avoid trading in the dead zone - a period in time where markets are considered dead or non volatile. The trader can concentrate on finding opportunities only during periods of profound market movements. By default the indicator gives you a true day starting at 02:00 to 19:00 hours GMT+2. You can adjust according to your Time Zone. By deafult
FREE
Buyers of this product also purchase
Trend Screener Pro MT5
STE S.S.COMPANY
4.84 (76)
Unlock the Power of Trends Trading with the Trend Screener Indicator: Your Ultimate Trend Trading Solution powered by Fuzzy Logic and Multi-Currencies System! Elevate your trading game with the Trend Screener, the revolutionary trend indicator designed to transform your Metatrader into a powerful Trend Analyzer. This comprehensive tool leverages fuzzy logic and integrates over 13 premium features and three trading strategies, offering unmatched precision and versatility. LIMITED TIME OFFER : Tre
Golden Trend Indicator MT5
Noha Mohamed Fathy Younes Badr
4.88 (16)
Golden Trend indicator  is The best indicator for predicting trend movement this indicator never lags and never repaints and never back paints    and give  arrow buy and sell    before the candle appear  and it will help you and  will make your trading decisions clearer its work on all currencies and  gold and crypto and all time frame This unique  indicator uses very secret algorithms to catch the  trends, so you can trade using this indicator and see the trend clear on charts  manual guide and
TPSpro RFI Levels MT5
Roman Podpora
4.53 (19)
A key element in trading is zones or levels from which decisions to buy or sell a trading instrument are made. Despite attempts by major players to conceal their presence in the market, they inevitably leave traces. Our task was to learn how to identify these traces and interpret them correctly. ИНСТРУКЦИЯ RUS         INSTRUCTIONS  ENG         R ecommended to use with an indicator   -   TPSpro  TREND PRO -  Version MT4 Bonus: 6 months of  " RFI SIGNALS "  subscription with your purchase! Main f
FX Power MT5 NG
Daniel Stein
5 (11)
FX Power: Analyze Currency Strength for Smarter Trading Decisions Overview FX Power is your go-to tool for understanding the real strength of currencies and Gold in any market condition. By identifying strong currencies to buy and weak ones to sell, FX Power simplifies trading decisions and uncovers high-probability opportunities. Whether you’re looking to follow trends or anticipate reversals using extreme delta values, this tool adapts seamlessly to your trading style. Don’t just trade—trade
FX Volume MT5
Daniel Stein
4.82 (17)
FX Volume: Experience Genuine Market Sentiment from a Broker’s Perspective Quick Overview Looking to elevate your trading approach? FX Volume provides real-time insights into how retail traders and brokers are positioned—long before delayed reports like the COT. Whether you’re aiming for consistent gains or simply want a deeper edge in the markets, FX Volume helps you spot major imbalances, confirm breakouts, and refine your risk management. Get started now and see how genuine volume data can
FX Levels MT5
Daniel Stein
5 (3)
FX Levels: Exceptionally Accurate Support & Resistance for All Markets Quick Overview Looking for a reliable way to pinpoint support and resistance levels across any market—currencies, indices, stocks, or commodities? FX Levels merges our traditional “Lighthouse” method with a forward-thinking dynamic approach, offering near-universal accuracy. By drawing from real-world broker experience and automated daily plus real-time updates, FX Levels helps you identify reversal points, set profit targe
TPSproTREND PrO MT5
Roman Podpora
4.71 (17)
TPSpro TREND PRO  - is a trend indicator that automatically analyzes the market and provides information about the trend and each of its changes, as well as giving signals for entering trades without redrawing! The indicator uses each candle, analyzing them separately. referring to different impulses - up or down impulse. Exact entry points into transactions for currencies, crypto, metals, stocks, indices!  ИНСТРУКЦИЯ RUS         INSTRUCTIONS  ENG       R ecommended to use with an indicator   -
Matrix Arrow Indicator MT5
Juvenille Emperor Limited
5 (13)
Matrix Arrow Indicator MT5  is a unique 10 in 1 trend following   100% non-repainting  multi-timeframe indicator that can be used on all symbols/instruments:   forex,   commodities,   cryptocurrencies,   indices,   stocks .  Matrix Arrow Indicator MT5  will determine the current trend at its early stages, gathering information and data from up to 10 standard indicators, which are: Average Directional Movement Index (ADX) Commodity Channel Index (CCI) Classic Heiken Ashi candles Moving Average
IX Power MT5
Daniel Stein
4.86 (7)
IX Power: Unlock Market Insights for Indices, Commodities, Cryptos, and Forex Overview IX Power is a versatile tool designed to analyze the strength of indices, commodities, cryptocurrencies, and forex symbols. While FX Power offers the highest precision for forex pairs by leveraging all available currency pair data, IX Power focuses exclusively on the underlying symbol’s market data. This makes IX Power an excellent choice for non-forex markets and a reliable option for forex charts when deta
This indicator is based on the mathematics of the great trader W.D. Ganna. With its help, you can easily find strong levels by analyzing swings to find the optimal entry point. The indicator works on all instruments and all timeframes. The indicator is fully manual and has control buttons. All you need to do is press the NEW button, a segment will appear, which you can place on any movement, swing or even 1 candle that you want to analyze. By placing the segment, press the OK button. A grid (th
Quantum TrendPulse
Bogdan Ion Puscasu
5 (13)
Introducing Quantum TrendPulse , the ultimate trading tool that combines the power of SuperTrend , RSI , and Stochastic into one comprehensive indicator to maximize your trading potential. Designed for traders who seek precision and efficiency, this indicator helps you identify market trends, momentum shifts, and optimal entry and exit points with confidence. Key Features: SuperTrend Integration: Easily follow the prevailing market trend and ride the wave of profitability. RSI Precision: Detect
FX Dynamic: Track Volatility and Trends with Customized ATR Analysis Overview FX Dynamic is a powerful tool that leverages Average True Range (ATR) calculations to give traders unparalleled insights into daily and intraday volatility. By setting up clear volatility thresholds—such as 80%, 100%, and 130%—you can quickly identify potential profit opportunities or warnings when markets exceed typical ranges. FX Dynamic adapts to your broker’s time zone, helps you maintain a consistent measure of
Gold Stuff mt5
Vasiliy Strukov
4.92 (173)
Gold Stuff mt5 is a trend indicator designed specifically for gold and can also be used on any financial instrument. The indicator does not redraw and does not lag. Recommended time frame H1. Contact me immediately after the purchase to get   personal bonus!  You can get a free copy of our Strong Support and Trend Scanner indicator, please pm. me! Settings  and manual   here  Please note that I do not sell my EA's or special sets on telegram, it is only available on Mql5 and my set files are on
This indicator identifies and displays zones, as it were areas of strength, where the price will unfold. The indicator can work on any chart, any instrument, at any timeframe. The indicator has two modes. The indicator is equipped with a control panel with buttons for convenience and split into two modes. Manual mode: To work with manual mode, you need to press the NEW button, a segment will appear. This segment is stretched over the movement and the LVL button is pressed. The level is displayed
Support And Resistance Screener Breakthrough unique Solution With All Important levels analyzer and Markets Structures Feature Built Inside One Tool ! Our indicator has been developed by traders for traders and with one Indicator you will find all Imporant market levels with one click. LIMITED TIME OFFER : Support and Resistance Screener Indicator is available for only 50 $ and lifetime. ( Original price 125$ ) (offer extended) The available tools ( Features ) in our Indicator are :  1. HH-LL S
PUMPING STATION – Your Personal Profit Pump on Forex!   Introducing PUMPING STATION — a revolutionary Forex indicator that will transform your trading into a profit-generating machine! This indicator is not just an assistant but a full-fledged trading system with powerful algorithms that will help you start earning consistently. When you purchase this product, you also get FOR FREE: Exclusive Set Files: For automatic setup and maximum performance. 4 Hours of Video Training: Learn how to trade us
This dashboard shows the latest available   harmonic patterns   for the selected symbols, so you will save time and be more efficient /   MT4 version . Free Indicator:   Basic Harmonic Pattern Comparison of "Basic Harmonic Pattern" vs. "Basic Harmonic Patterns Dashboard" Indicators Feature Basic Harmonic Pattern Basic Harmonic Patterns Dashboard Functionality Detects and displays harmonic patterns on a single chart Searches multiple symbols and timeframes for harmonic patterns, displays res
PZ Swing Trading MT5
PZ TRADING SLU
5 (5)
Protect against whipsaws: revolutionize your swing trading approach Swing Trading is the first indicator designed to detect swings in the direction of the trend and possible reversal swings. It uses the baseline swing trading approach, widely described in trading literature. The indicator studies several price and time vectors to track the aggregate trend direction and detects situations in which the market is oversold or overbought and ready to correct. [ Installation Guide | Update Guide | Tro
Top indicator for MT5   providing accurate signals to enter a trade without repainting! It can be applied to any financial assets:   forex, cryptocurrencies, metals, stocks, indices .  Watch  the video  (6:22) with an example of processing only one signal that paid off the indicator! MT4 version is here It will provide pretty accurate trading signals and tell you when it's best to open a trade and close it. Most traders improve their trading results during the first trading week with the help of
PZ Trend Trading MT5
PZ TRADING SLU
3.8 (5)
Capture every opportunity: your go-to indicator for profitable trend trading Trend Trading is an indicator designed to profit as much as possible from trends taking place in the market, by timing pullbacks and breakouts. It finds trading opportunities by analyzing what the price is doing during established trends. [ Installation Guide | Update Guide | Troubleshooting | FAQ | All Products ] Trade financial markets with confidence and efficiency Profit from established trends without getting whip
Easy Breakout MT5
Mohamed Hassan
5 (3)
After your purchase, feel free to contact me for more details on how to receive a bonus indicator called VFI, which pairs perfectly with Easy Breakout for enhanced confluence!     Easy Breakout MT5   is a powerful price action trading system built on one of the most popular and widely trusted strategies among traders: the   Breakout strategy ! This indicator delivers crystal-clear Buy and Sell signals based on breakouts from key support and resistance zones. Unlike typical breakout indicators
MetaForecast M5
Vahidreza Heidar Gholami
5 (2)
MetaForecast predicts and visualizes the future of any market using different powerful methods. While financial markets are not always predictable, if there are patterns in the past data, MetaForecast can learn and predict the future as accurately as possible. It features a complete implementation of neural networks embedded directly into the indicator, enabling traders to create and train AI models using data from multiple symbols to learn complex patterns. MetaForecast leverages your computer'
RelicusRoad Pro MT5
Relicus LLC
4.78 (18)
How many times have you bought a trading indicator with great back-tests, live account performance proof with fantastic numbers and stats all over the place but after using it, you end up blowing your account? You shouldn't trust a signal by itself, you need to know why it appeared in the first place, and that's what RelicusRoad Pro does best! User Manual + Strategies + Training Videos + Private Group with VIP Access + Mobile Version Available A New Way To Look At The Market RelicusRoad is th
Timeframes Trend Scanner is a trend analyzer or trend screener indicator that helps you know the trend in all timeframes of symbol you're watching. This indicator provides clear & detailed analysis results on a beautiful dashboard, let you able to use this result right away without need to do any additional analysis. Please note that this indicator doesn't work with Strategy Tester. Sorry for that! How it works Step 1: Calculate values of 23 selected & trusted technical indicators (Oscillator &
EXCLUSIVE! JUST  10 COPIES  AVAILABLE!   BONUS AUX VIP Club 2024 : Include EA CAP, CEP, LDH, PSC307 & AO4C to enhance the performance of this tool to its maximum potential  Click Here to Download Files   ( for users only ) FREE Trading Education Available Daily via Zoom --- For More Info or Instant Message Click link ---  https://t.me/abcdwave Transform your trading with the "Five Magic Bullets" Indicator, tailored for traders who embrace the power of Elliott Wave Chaos Theory.
Bill Williams Advanced
Siarhei Vashchylka
5 (9)
Bill Williams Advanced is designed for automatic chart analysis using Bill Williams' "Profitunity" system. The indicator analyzes four timeframes at once. Manual (Be sure to read before purchasing) Advantages 1. Automatically analyzes the chart using the "Profitunity" system of Bill Williams. The found signals are placed in a table in the corner of the screen. 2. Equipped with a trend filter based on the Alligator indicator. Most of the system signals are recommended to be used only according t
Gartley Hunter Multi
Siarhei Vashchylka
5 (9)
Gartley Hunter Multi - An indicator for searching for harmonic patterns simultaneously on dozens of trading instruments and on all possible timeframes. Manual (Be sure to read before purchasing) | Version for MT4 Advantages 1. Patterns: Gartley, Butterfly, Shark, Crab. Bat, Alternate Bat, Deep Crab, Cypher 2. Simultaneous search for patterns on dozens of trading instruments and on all possible timeframes 3. Search for patterns of all possible sizes. From the smallest to the largest 4. All fou
Gold Trend 5
Sergei Linskii
3.5 (2)
Gold Trend - this is a good stock technical indicator. The indicator algorithm analyzes the price movement of an asset and reflects volatility and potential entry zones. The best indicator signals: For SELL = red histogram + red SHORT pointer + yellow signal arrow in the same direction. For BUY = blue histogram + blue LONG pointer + aqua signal arrow in the same direction. Benefits of the indicator: The indicator produces signals with high accuracy. A confirmed arrow signal can only be redrawn
Trend Line Map Pro MT5
STE S.S.COMPANY
4.09 (11)
Trend Line Map indicator is an addons for   Trend Screener Indicator . It's working as a scanner for all signals generated by Trend screener ( Trend Line Signals ) . It's a Trend Line Scanner based on Trend Screener Indicator.  If you don't have Trend Screener Pro Indicator,   the Trend Line Map Pro will not work.     LIMITED TIME OFFER : Trend Line Map Indicator is available for only 50 $ and lifetime. ( Original price 125$ ) By accessing to our MQL5 Blog,  you can find all our premium indicat
CBT Quantum Maverick High-Efficiency Binary Trading System CBT Quantum Maverick is a finely tuned, high-performance binary options trading system designed for traders seeking precision, simplicity, and disciplined trading. No customization is required—this system is optimized for effective results right out of the box. Simply follow the signals, which can be mastered with a bit of practice. Key Features: Signal Precision: New-bar-based trading signals—targeting the next candle based on curren
More from author
Fair Value Gaps
Cao Minh Quang
4.83 (42)
The Fair Value Gap (FVG) is a price range where one side of the market liquidity is offered, typically confirmed by a liquidity void on the lower time frame charts in the same price range. Price can "gap" to create a literal vacuum in trading, resulting in an actual price gap. Fair Value Gaps are most commonly used by price action traders to identify inefficiencies or imbalances in the market, indicating that buying and selling are not equal. If you're following the ICT Trading Strategy or Smar
FREE
Fair Value Gaps MT4
Cao Minh Quang
5 (3)
The Fair Value Gap (FVG) is a price range where one side of the market liquidity is offered, typically confirmed by a liquidity void on the lower time frame charts in the same price range. Price can "gap" to create a literal vacuum in trading, resulting in an actual price gap. Fair Value Gaps are most commonly used by price action traders to identify inefficiencies or imbalances in the market, indicating that buying and selling are not equal. If you're following the ICT Trading Strategy or Smart
FREE
MACD Indicator It has MACD line, Signal line, and Histogram. The Histogram has 4 colors based on Direction Above and Below the Zero Line, showing its movement direction as simple as possible. Allows Show MACD & Signal Line, Show Change In color of MACD   Line based on cross of Signal Line. Show Dots at Cross of MacD and Signal Line, Turn on and off Histogram. Enjoy your trading experience, and feel free to share your comments and reviews. If you are interested in this indicator, you might be i
FREE
The latest version of Indicator is fully integrated into an all-in-one package, including: Fair Value Gaps (FVG). See more =>  How to trade with FVG Implied Fair Value Gap (IFVG). See more =>   How to trade with IFVG OrderBlock (OB). See more =>   How to trade with OrderBlock The options in the settings section are relatively easy to navigate, and you can even use them right away upon activation without encountering difficulties when using the default configuration. The indicator utilizes an alg
MACD Indicator It has MACD line, Signal line, and Histogram. The Histogram has 4 colors based on Direction Above and Below the Zero Line, showing its movement direction as simple as possible. Allows Show MACD & Signal Line, Show Change In color of   MACD     Line based on cross of Signal Line. Show Dots at Cross of MacD and Signal Line, Turn on and off Histogram. Enjoy your trading experience, and feel free to share your comments and reviews. If you are interested in this indicator, you might
FREE
The latest version of Indicator is fully integrated into an all-in-one package, including: Fair Value Gaps (FVG). See more =>  How to trade with FVG Implied Fair Value Gap (IFVG). See more =>   How to trade with IFVG OrderBlock (OB). See more =>   How to trade with OrderBlock The options in the settings section are relatively easy to navigate, and you can even use them right away upon activation without encountering difficulties when using the default configuration. The indicator utilizes an al
Market Sessions Pre
Cao Minh Quang
5 (1)
The Market Sessions indicator is a popular tool among forex and stock traders for visually representing global trading sessions on a price chart. It highlights the time periods for major trading sessions — such as the Asian (Tokyo) , European (London) , and American (New York) sessions — directly on the chart. This helps traders identify when markets open and close, allowing for better decision-making based on session-specific trading behavior. - Asian Session (Default: 00:00-09:00) - London Se
FREE
The Market Sessions indicator is a popular tool among forex and stock traders for visually representing global trading sessions on a price chart. It highlights the time periods for major trading sessions — such as the   Asian (Tokyo) ,   European (London) , and   American (New York)   sessions — directly on the chart. This helps traders identify when markets open and close, allowing for better decision-making based on session-specific trading behavior. - Asian Session (Default: 00:00-09:00) - Lo
FREE
The Linear Regression Oscillator (LRO) is a technical indicator based on linear regression analysis, commonly used in financial markets to assess the momentum and direction of price trends. It measures the distance between the current price and the value predicted by a linear regression line, which is essentially the best-fit line over a specified period. Here’s a breakdown of how it works and its components: Key Components of the Linear Regression Oscillator Linear Regression Line (Best-Fit Lin
I've combined two trading strategies, the Order Block Strategy and the FVG Trading Strategy, by utilizing a combination of the FVG indicators and Order Blocks. The results have been surprisingly effective. This is a two-in-one solution that makes it easy for traders to identify critical trading zones. I've optimized the settings so that all you need to do is install and trade; it's not overly complex to explain further. No need for any usage instructions regarding the trading method. You shoul
The Market Structure with Inducements & Sweeps indicator is a unique take on Smart Money Concepts related market structure labels that aims to give traders a more precise interpretation considering various factors. Compared to traditional market structure scripts that include Change of Character (CHoCH) & Break of Structures (BOS) -- this script also includes the detection of Inducements (IDM) & Sweeps which are major components of determining other structures labeled on the chart. SMC & pri
Simple ICT Concepts
Cao Minh Quang
5 (2)
The Simple  ICT Concepts Indicator is a powerful tool designed to help traders apply the principles of the Inner Circle Trader (ICT) methodology. This indicator focuses on identifying key zones such as liquidity levels, support and resistance, and market structure, making it an invaluable asset for price action and smart money concept traders. Key Features Market Structure : Market structure labels are constructed from price breaking a prior swing point. This allows a user to determine the curr
The Pure Price Action ICT Tools indicator is designed for pure price action analysis, automatically identifying real-time market structures, liquidity levels, order & breaker blocks, and liquidity voids. Its unique feature lies in its exclusive reliance on price patterns, without being constrained by any user-defined inputs, ensuring a robust and objective analysis of market dynamics. Key Features Market Structures A Market Structure Shift, also known as a Change of Character (CHoCH), is a pivot
The   Simple  ICT Concepts Indicator   is a powerful tool designed to help traders apply the principles of the   Inner Circle Trader (ICT)   methodology. This indicator focuses on identifying key zones such as liquidity levels, support and resistance, and market structure, making it an invaluable asset for price action and smart money concept traders. Key Features Market Structure : Market structure labels are constructed from price breaking a prior swing point. This allows a user to determine t
Automatically detect bullish or bearish order blocks to optimize your trade entries with our powerful indicator. Ideal for traders following ICT (The Inner Circle Trader). Works with any asset type, including cryptocurrencies, stocks, and forex. Displays order blocks on multiple timeframes, from M2 to W1. Alerts you when an order block is detected, migrated, or a higher timeframe order block is created/migrated. Perfect for both scalping and swing trading in Smart Money Concepts.  Enhanced by st
The   Linear Regression Oscillator (LRO)   is a technical indicator based on linear regression analysis, commonly used in financial markets to assess the momentum and direction of price trends. It measures the distance between the current price and the value predicted by a linear regression line, which is essentially the best-fit line over a specified period. Here’s a breakdown of how it works and its components: Key Components of the Linear Regression Oscillator Linear Regression Line (Best-Fit
This Simple Smart Money Concepts indicator displays real-time market structure (internal & swing BOS / CHoCH), order blocks, premium & discount zones, equal highs & lows, and much more...allowing traders to automatically mark up their charts with widely used price action methodologies. "Smart Money Concepts" (SMC) is used term amongst price action traders looking to more accurately navigate liquidity & find more optimal points of interest in the market. Trying to determine where institutional
The Pure Price Action ICT Tools indicator is designed for pure price action analysis, automatically identifying real-time market structures, liquidity levels, order & breaker blocks, and liquidity voids. Its unique feature lies in its exclusive reliance on price patterns, without being constrained by any user-defined inputs, ensuring a robust and objective analysis of market dynamics. Key Features Market Structures A Market Structure Shift, also known as a Change of Character (CHoCH), is a pivot
Multiple Non-Linear Regression MT4 This indicator is designed to perform multiple non-linear regression analysis using four independent variables: close, open, high, and low prices. Here's a components and functionalities: Inputs: Normalization Data Length: Length of data used for normalization. Learning Rate: Rate at which the algorithm learns from errors. Show data points: Show plotting of normalized input data(close, open, high, low) Smooth?: Option to smooth the output. Smooth Length: Lengt
The Market Structure with Inducements & Sweeps indicator is a unique take on Smart Money Concepts related market structure labels that aims to give traders a more precise interpretation considering various factors. Compared to traditional market structure scripts that include Change of Character (CHoCH) & Break of Structures (BOS) -- this script also includes the detection of Inducements (IDM) & Sweeps which are major components of determining other structures labeled on the chart. SMC & pri
Smart Market Structure Simple   is a powerful indicator that helps traders identify   market structure   based on the   Smart Money Concept (SMC) . This indicator automatically detects   Break of Structure (BOS), Change of Character (CHoCH), Fair Value Gaps (FVG), Order Blocks (OB), Liquidity Zones (LQZ),   and key swing points   Higher High (HH), Higher Low (HL), Lower High (LH), Lower Low (LL) .   Main Objective:   Assist traders in tracking institutional flow ( Smart Money ) and finding hi
Order Block Detector
Cao Minh Quang
5 (2)
Automatically detect bullish or bearish order blocks to optimize your trade entries with our powerful indicator. Ideal for traders following ICT (The Inner Circle Trader). Works with any asset type, including cryptocurrencies, stocks, and forex. Displays order blocks on multiple timeframes, from M2 to W1. Alerts you when an order block is detected, migrated, or a higher timeframe order block is created/migrated. Perfect for both scalping and swing trading. Enhanced by strong VSA (Volume Spread A
This indicator measures and displays the price range created from the first period within a new trading session, along with price breakouts from that range and targets associated with the range width. The Opening Range can be a powerful tool for making a clear distinction between ranging and trending trading days. Using a rigid structure for drawing a range, provides a consistent basis to make judgments and comparisons that will better assist the user in determining a hypothesis for the day's pr
Multiple Non-Linear Regression This indicator is designed to perform multiple non-linear regression analysis using four independent variables: close, open, high, and low prices. Here's a components and functionalities: Inputs: Normalization Data Length: Length of data used for normalization. Learning Rate: Rate at which the algorithm learns from errors. Show data points: Show plotting of normalized input data(close, open, high, low) Smooth?: Option to smooth the output. Smooth Length: Length of
Smart Market Structure Simple is a powerful indicator that helps traders identify market structure based on the Smart Money Concept (SMC) . This indicator automatically detects Break of Structure (BOS), Change of Character (CHoCH), Fair Value Gaps (FVG), Order Blocks (OB), Liquidity Zones (LQZ), and key swing points Higher High (HH), Higher Low (HL), Lower High (LH), Lower Low (LL) . Main Objective: Assist traders in tracking institutional flow ( Smart Money ) and finding high-probability tra
Filter:
No reviews
Reply to review
Version 1.5 2025.02.14
fix small error
Version 1.4 2025.01.07
- Add Define Global Variables Name
- Adjust HL/HH/LH/LL Points
Version 1.3 2024.12.31
- fix error with EA Integration
Version 1.2 2024.12.23
- Add EA Integration
Version 1.1 2024.12.06
- Fix draw Premium/Discount Zones