Market Heart MT5
- Indicators
- Innovicient Limited
- Version: 1.3
- Updated: 7 December 2024
- Activations: 20
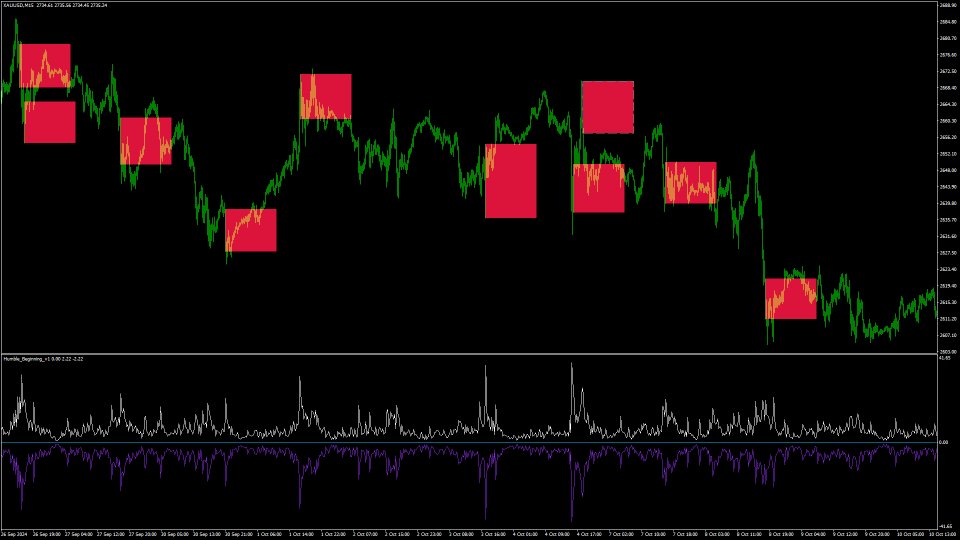
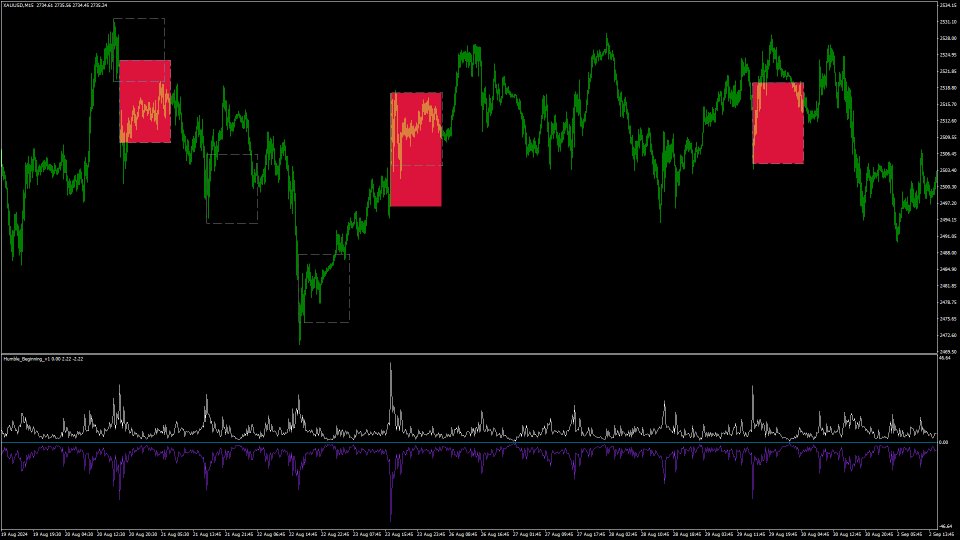
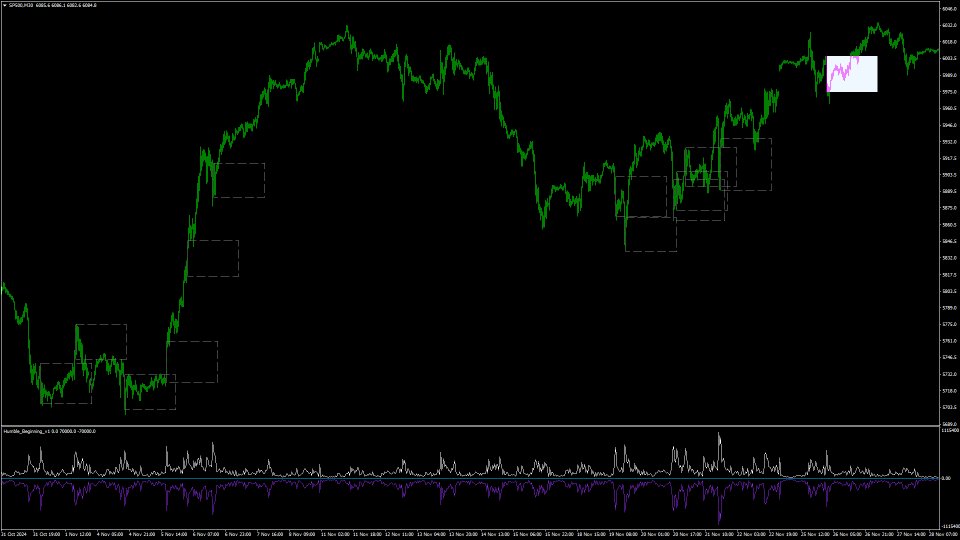
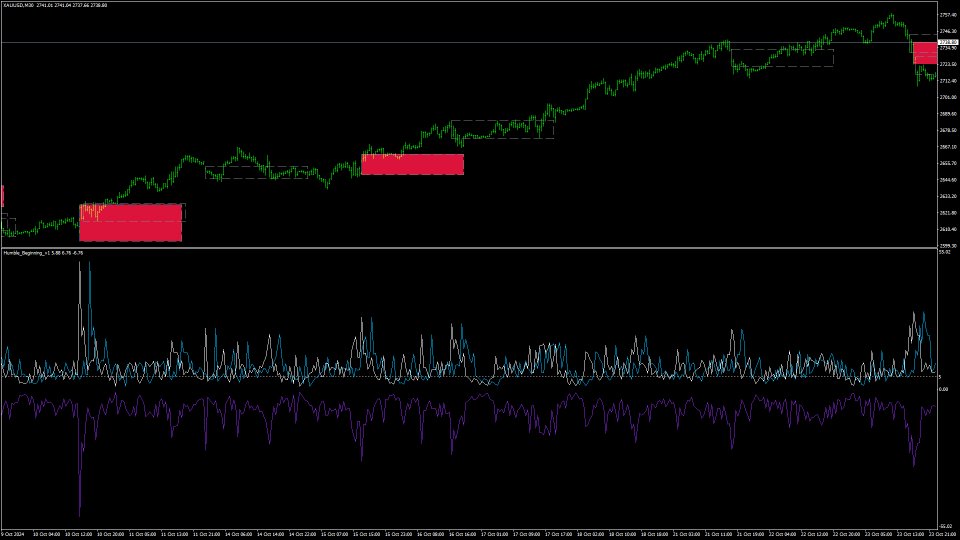
The Market Heart indicator scans market entries after high volatility is noticed. Most big moves occur a short time after market volatility. Most big moves occur a short time after market volatility. The idea is to look for entries after the rectangles form and not necessarily as trade entry signals. . For example, you could use the Retracement Feeder indicator that generates arrow signals.
Market Heart MT4 Version
Heartbeat Value: The lower the heartbeat figure the better.
Trade Mode, which has the Snap Mode and Ordinary Mode.
Market Heart MT4 Version
How to use:
1. Primary use
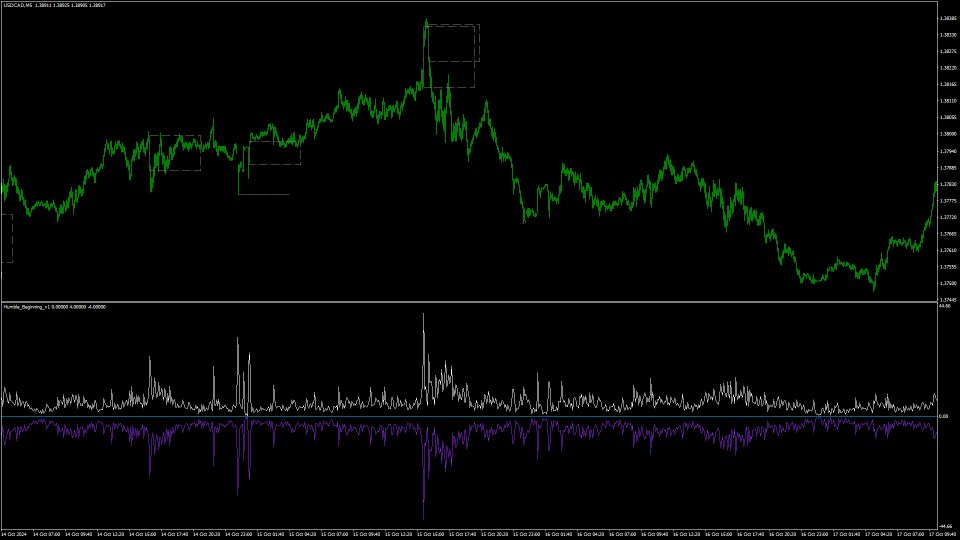
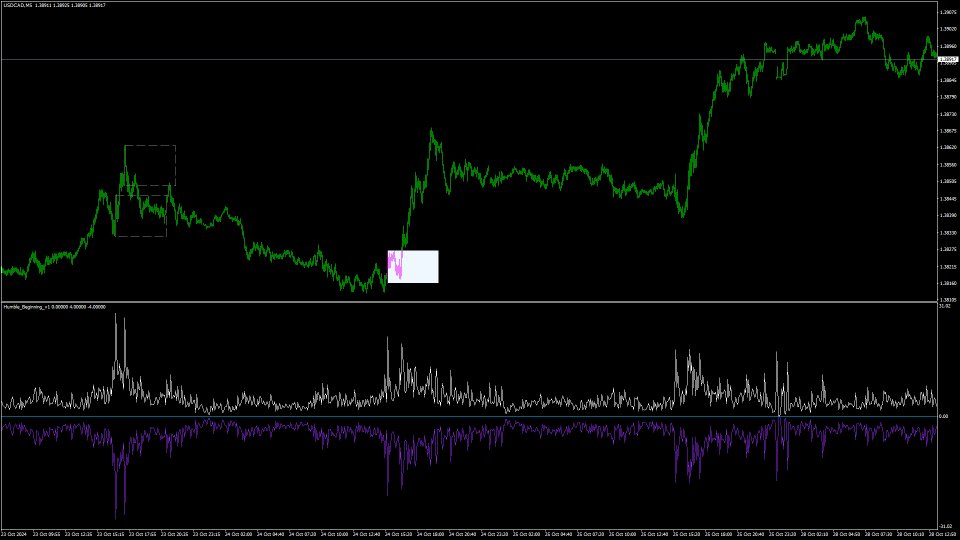
The White Box is the first to be formed and is supported by two auxiliary boxes.
Buy if the price closes above the auxiliary box and the Retracement Feeder gives buy arrows.
Buy if the price closes above the auxiliary box and the Retracement Feeder gives buy arrows.
Sell if the price closes below the auxiliary box and the Retracement Feeder gives sell arrows.
Alternatively, you can disable the auxiliary boxes and trade based on the White box, which also forms a shadow-dotted rectangle.
Settings: Importance settings
Heartbeat Value: The lower the heartbeat figure the better.
Trade Mode, which has the Snap Mode and Ordinary Mode.
The Snap Mode produces more signals and Signal Level should be above or equal to 90
The Ordinary Mode produces fewer signals and the Signal Level should be 50 or below.
If two boxes are close to each other, only buy if the price closes above the two boxes or sell if it closes below them; therefore, treat them as a single box.
If two boxes are close to each other, only buy if the price closes above the two boxes or sell if it closes below them; therefore, treat them as a single box.
2. Additional uses
- Use Heartbeat lines not only as a range calculator but also as a trend-changing indicator. Changes in the instrument's range often signal pending reversal or trend confirmation. Therefore, you can mark the desired level in the "Levels" tab of properties.
- After High Peaks on the White line, the intersection represents the subsiding volatility. Therefore, there is expectation that the instrument will find direction.
- In addition, you can make use of crosses between the White and the Blue lines I this happens below level 5. The range is at almost 0. This will give you tight SL.

