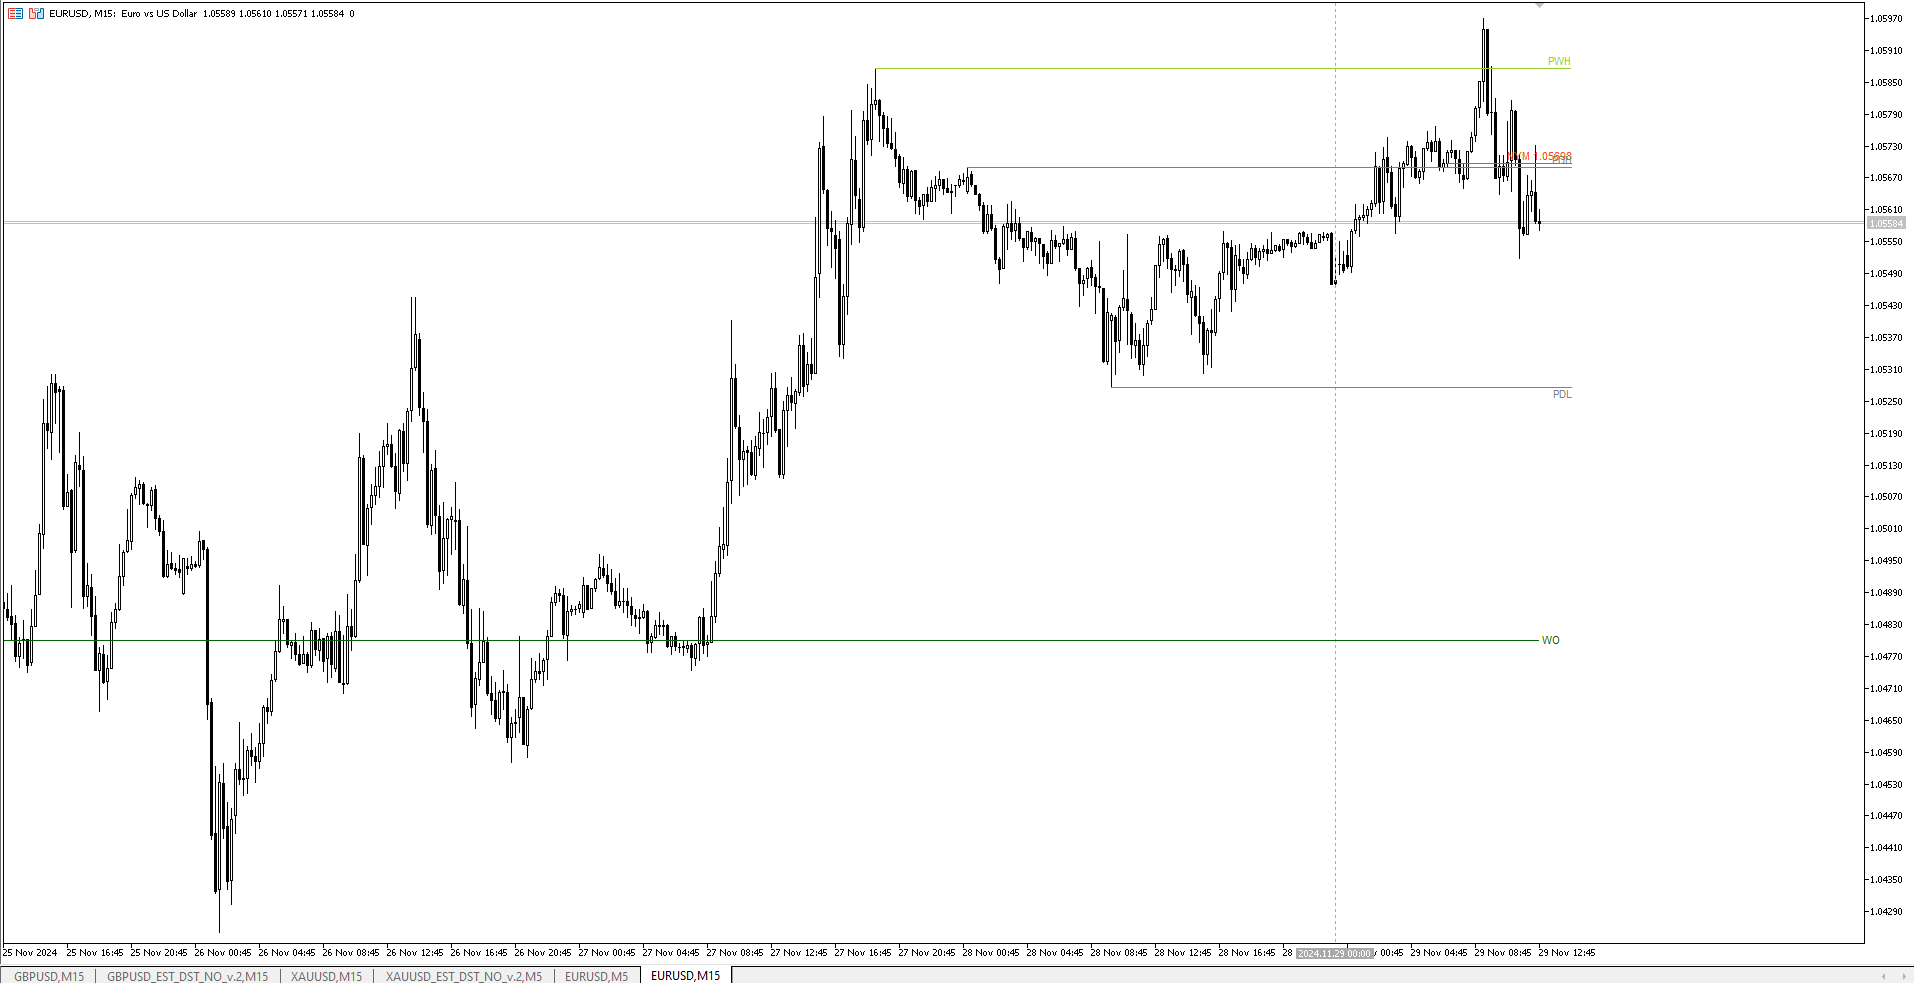
Haven Key Levels PDH PDL
- Indicators
- Maksim Tarutin
- Version: 1.5
- Updated: 23 April 2025
The indicator "Haven Key Levels PDH PDL" helps traders visualize key levels on the chart. It automatically marks the following levels:
- DO (Daily Open) — the daily open level.
- NYM (New York Midnight) — the New York midnight level.
- PDH (Previous Day High) — the previous day's high.
- PDL (Previous Day Low) — the previous day's low.
- WO (Weekly Open) — the weekly open level.
- MO (Monthly Open) — the monthly open level.
- PWH (Previous Week High) — the previous week's high.
- PWL (Previous Week Low) — the previous week's low.
Other products -> HERE
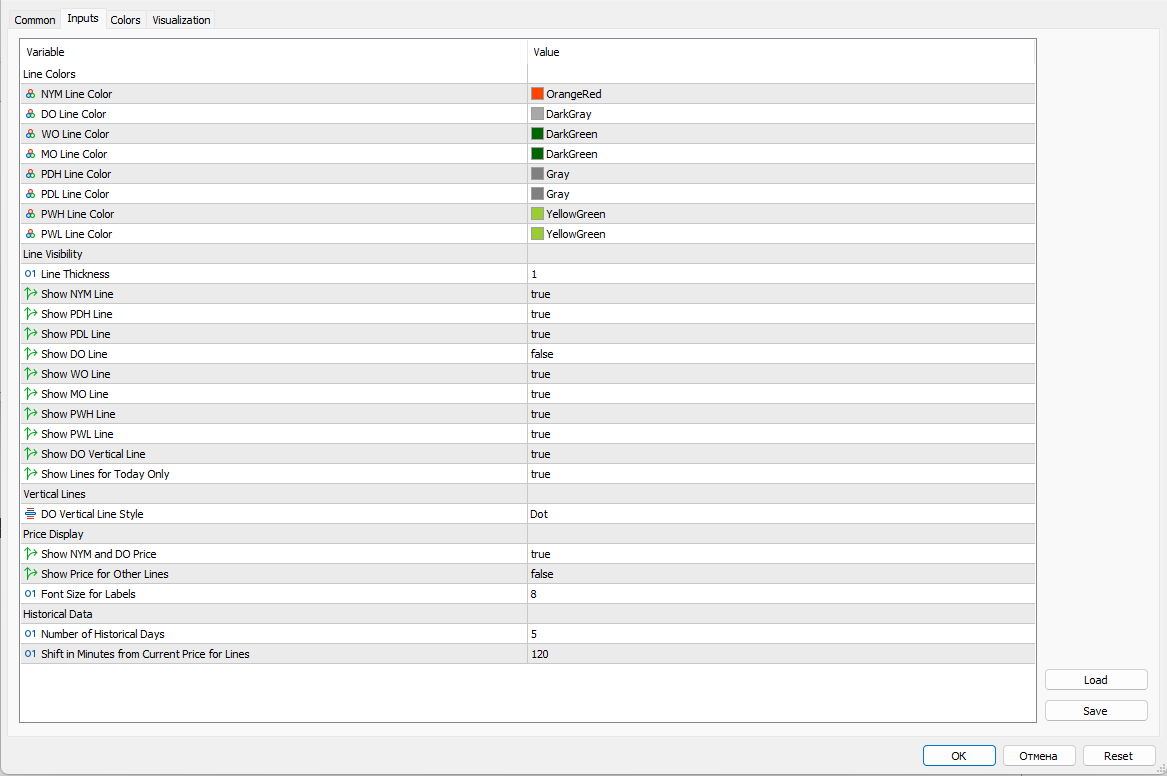
Tool customization options:
-
Color and line thickness selection:
- Set colors for the levels: NYM, DO, WO, MO, PDH, PDL, PWH, PWL.
- Adjust line thickness.
-
Level visibility control:
- Enable or disable the display of lines for the levels: NYM, PDH, PDL, DO, WO, MO, PWH, PWL.
- Display a vertical line for DO.
- Option to display lines only for the current day.
-
Vertical line style customization:
- Set the style of the vertical line for DO (e.g., dashed, solid).
-
Display prices next to the lines:
- Display prices for the levels NYM and DO.
- Set visibility of prices for other levels.
- Change font size for price labels.
-
Define the depth of historical data:
- Specify the number of days for analyzing historical data.
- Set offset of lines from the current price for a specified number of minutes.
A simple and informative way to track important price levels throughout the trading session.


Awesome Indicator Thank you so much