AI Channels MT5
- Indicators
- Duc Hoan Nguyen
- Version: 1.0
New tools will be $30 for the first week or the first 3 purchases!
Trading Tools Channel on MQL5: Join my MQL5 channel to update the latest news from me
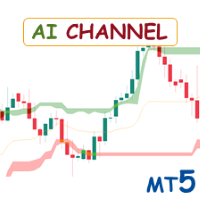
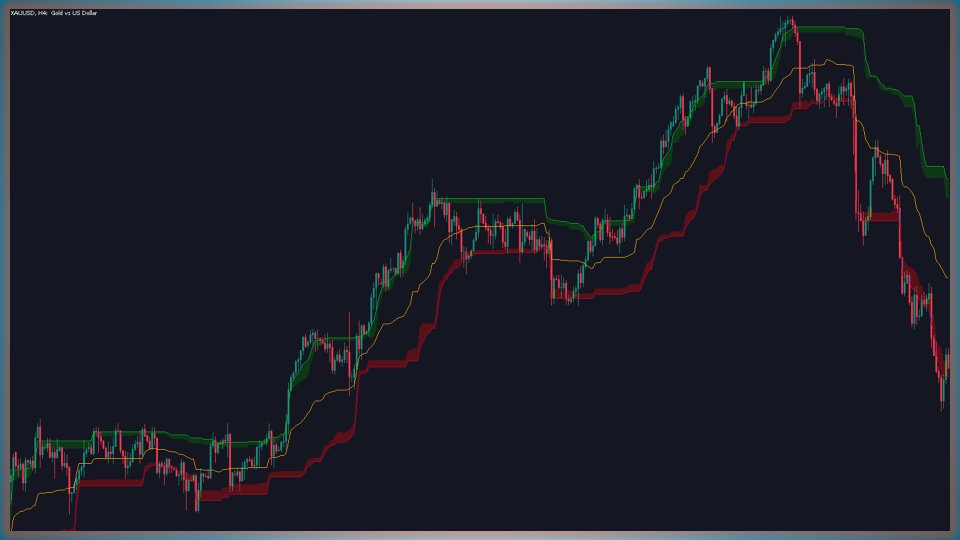
The AI Channels Indicator utilizes rolling K-means clustering—a powerful machine learning technique in clustering analysis—to deliver real-time insights into underlying price trends. This indicator creates adaptive channels based on clustered price data, enabling traders to make informed decisions regarding trend direction and market conditions.
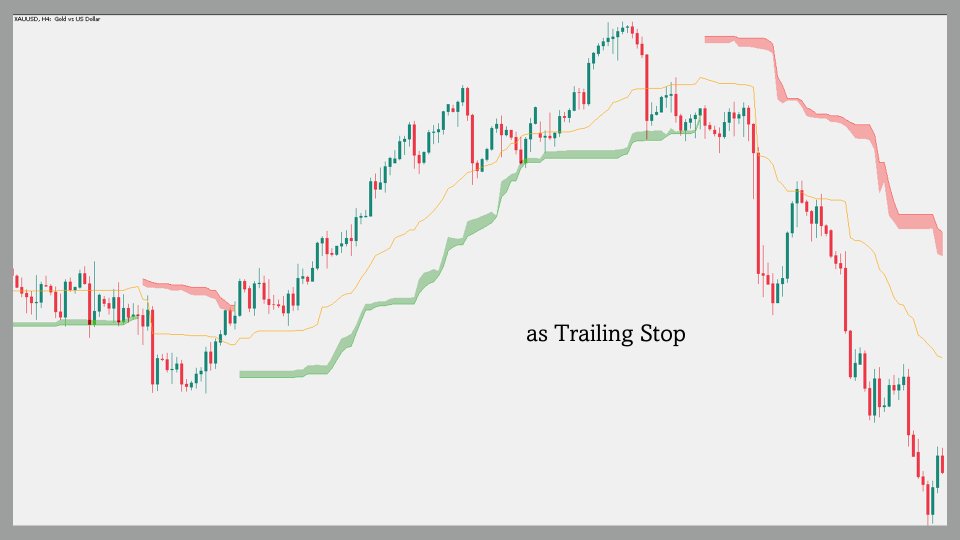
The indicator also includes a trailing stop option within its settings, providing added flexibility for managing risk.
See more MT4 version at: AI Channels MT4
See more products at: All Products
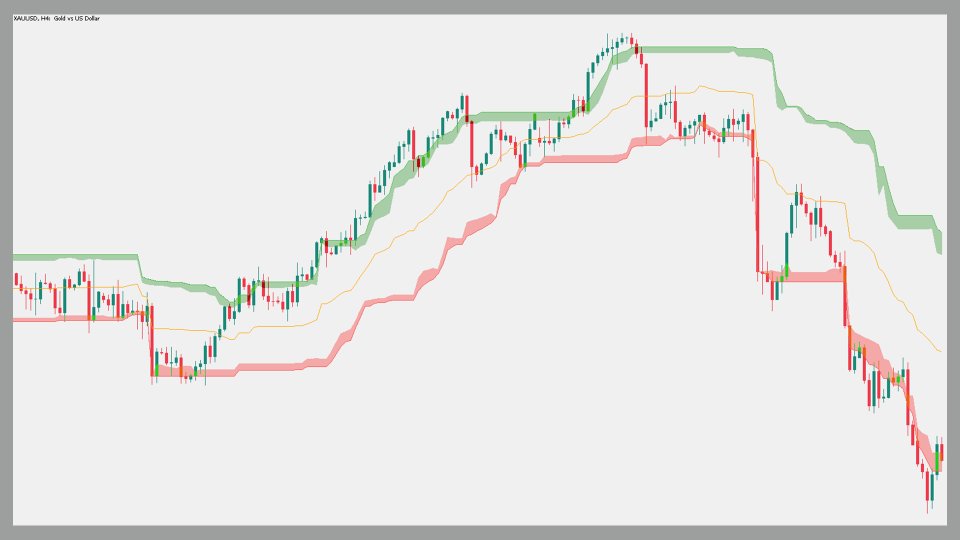
How to Use the AI Channels IndicatorEach channel extremity offers valuable insights for determining trend direction:
- Upper Channel Extremity: Price breaking above this level may indicate an uptrend.
- Lower Channel Extremity: Price breaking below this level may suggest a downtrend.
Adjusting the Window Size (the range of recent prices used for clustering) can provide either a long-term view with higher values or a short-term perspective with lower values.
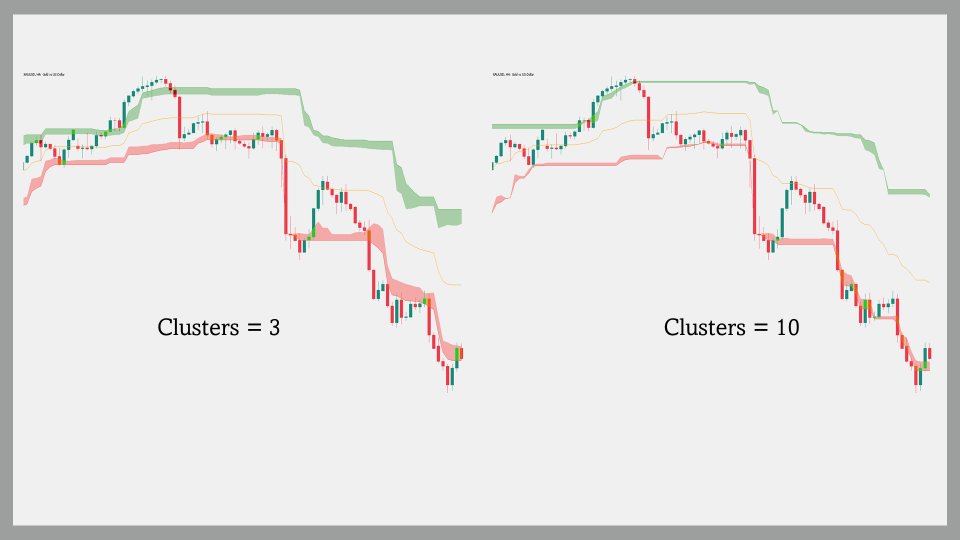
Adjustable Clustering with "Clusters" SettingThe Clusters setting allows users to control how difficult it is for the price to break channel extremities. Higher cluster values place extremities further from the price, reflecting more robust trend barriers.
The Denoise Channels feature is enabled by default, smoothing out noise to provide clearer trend lines. Disabling this option returns more precise centroids at each point, though it may result in more irregular channel extremities.
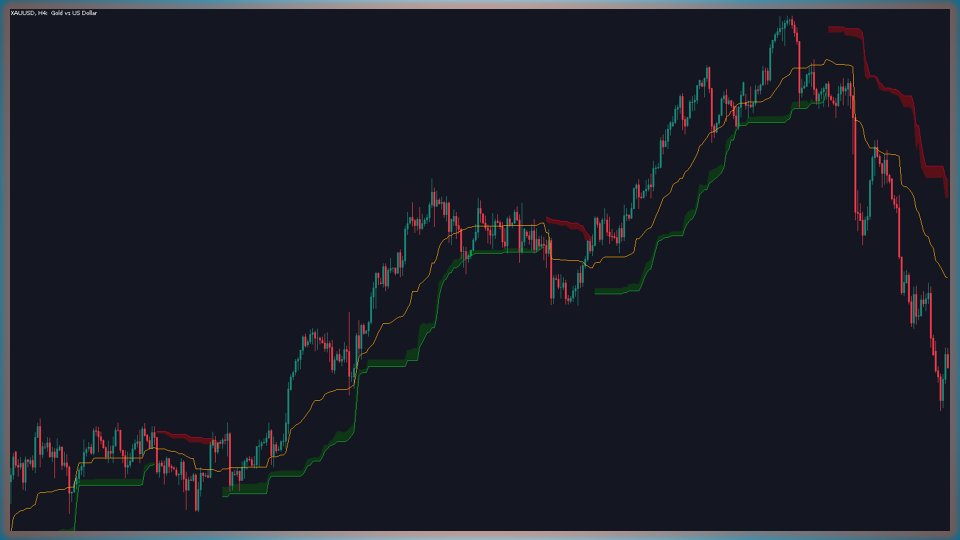
Trailing Stop VisualizationFor those who prefer trend-following strategies, the indicator offers an option to display channels as a trailing stop, which can help in managing trades during trending markets.
Centroid Dispersion AreasEach extremity consists of an area that represents centroid dispersion. The width of these areas indicates how spread out the prices within each cluster are around their centroid:
- Wider Areas: A larger dispersion width suggests greater price volatility within the cluster.
In practice, when the price enters a wider area, it is more likely to breach the associated extremity.
Indicator Details and PerformanceThe AI Channels Indicator uses K-means clustering over the specified Window Size, identifying clusters based on recent prices. Each channel extremity reflects the centroids of the lowest, average, and highest price clusters, offering an aggregated view of price dynamics.
To optimize performance, the indicator provides settings for maximum iteration steps during centroid calculation and Historical Bars Calculation to manage the calculation window, ensuring a balance between computational efficiency and indicator accuracy.
Settings Overview- Window Size: Number of recent prices used for indicator calculation.
- Clusters: Number of clusters used to calculate channel extremities.
- Denoise Channels: When enabled, it reduces noise for a smoother channel view.
- As Trailing Stop: Allows displaying the indicator as a trailing stop.
To improve runtime efficiency:
- Maximum Iteration Steps: Limits the iterations for finding centroids, balancing calculation speed and clustering accuracy.
- Historical Bars Calculation: Sets the calculation window in bars, defining the amount of historical data to process.
With the AI Channels Indicator, traders gain a sophisticated tool for trend detection and volatility analysis based on clustering techniques, adaptable to both short- and long-term market insights.
