Trend Levels MT4
- Indicators
- Duc Hoan Nguyen
- Version: 2.11
- Updated: 27 February 2025
- Activations: 10
New tools will be $30 for the first week or the first 3 purchases!
Trading Tools Channel on MQL5: Join my MQL5 channel to update the latest news from me
The Trend Levels indicator is meticulously crafted to pinpoint critical trend levels—High, Mid, and Low—during market movements. With real-time calculations based on the highest, lowest, and mid-level values over a customizable lookback period, this tool provides traders with a structured view of ongoing trend dynamics and strength, helping them make precise, informed trading decisions.
See more MT5 version at: Trend Levels MT5
See more products at: All Products
Key Features and How to Use the Trend Levels Indicator
Trend Shift Signals
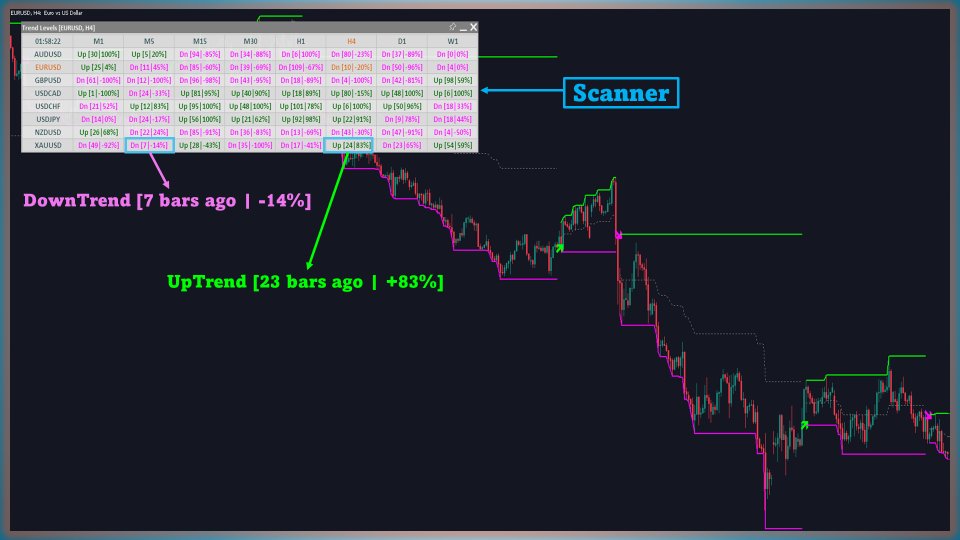
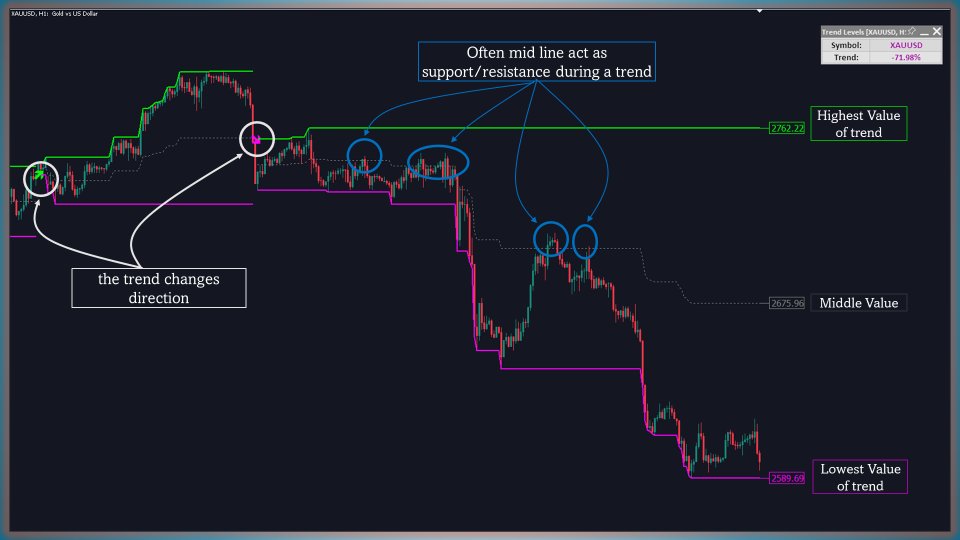
The indicator identifies trend shifts by tracking the highest and lowest values within the chosen input period. When the current high reaches the highest level, the indicator signals an uptrend. Conversely, when the current low reaches the lowest level, it signals a downtrend. These trend shifts are visually represented on the chart, enabling traders to quickly recognize potential trend reversals and adjust their strategies accordingly.
Trend Level CalculationOnce a trend is established, the indicator calculates the highest, lowest, and mid-levels over the defined lookback period. These levels are plotted as color-coded lines on the chart, allowing traders to easily visualize essential support and resistance levels within the trend. This visual aid helps traders identify key areas where price might react, providing strategic points for potential entries or exits.
Midline RetestsThe mid-level line often serves as a key interaction point within the trend, where price may either pull back or be rejected. Traders can utilize these midline retests as strategic opportunities for entering or validating a trade. The chart visually demonstrates how frequently price interacts with this midline, highlighting zones that may indicate trend continuation or reversal.
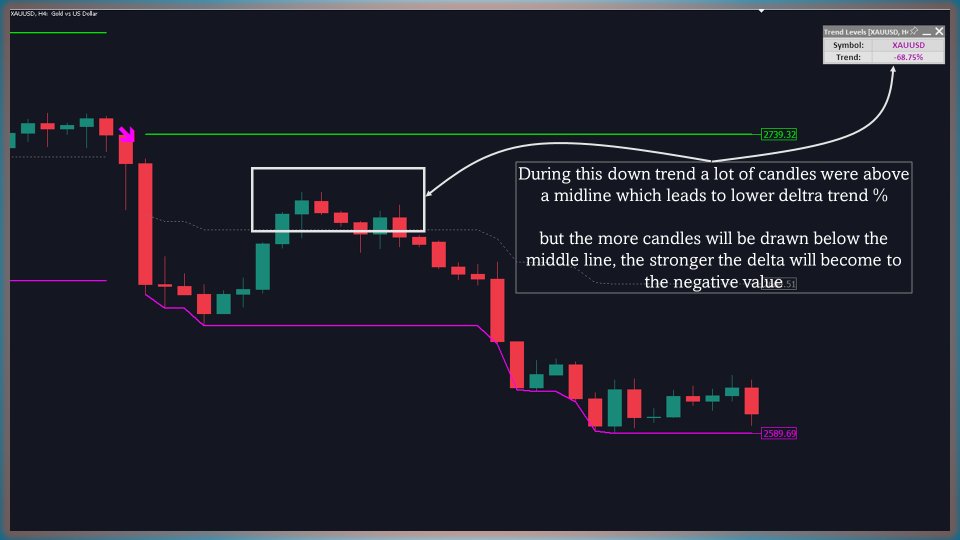
Trend Strength CalculationThe indicator also calculates the trend strength by measuring the difference between the number of candles closing above and below the midline. This percentage-based delta is displayed in real-time, providing insight into the trend’s momentum. By observing this metric, traders can evaluate the current trend’s strength and determine if it is gaining or losing momentum, allowing for more precise adjustments to their strategies.
User Inputs- Length: Sets the lookback period for calculating the highest and lowest values, which establish the key trend levels.
- Candle Counting: Counts the number of candles closing above and below the midline to assess the trend strength delta.
The Trend Levels indicator is a powerful tool designed to assist traders in visualizing trend dynamics, key support and resistance levels, and real-time trend strength. Through its trend shift signals, midline retests, and trend strength calculations, the Trend Levels indicator empowers traders with a clearer understanding of market trends, helping them make well-informed decisions and capitalize on opportunities during market shifts. Whether confirming trend direction or pinpointing optimal entry points, the Trend Levels indicator offers a robust approach to trend analysis.
