• Overview
  • Reviews (10)
  • Comments (6)

Berma Bands

5

The Berma Bands (BBs) indicator is a valuable tool for traders seeking to identify and capitalize on market trends. By analyzing the relationship between the price and the BBs, traders can discern whether a market is in a trending or ranging phase.

Visit the [ Berma Home Blog ] to know more.

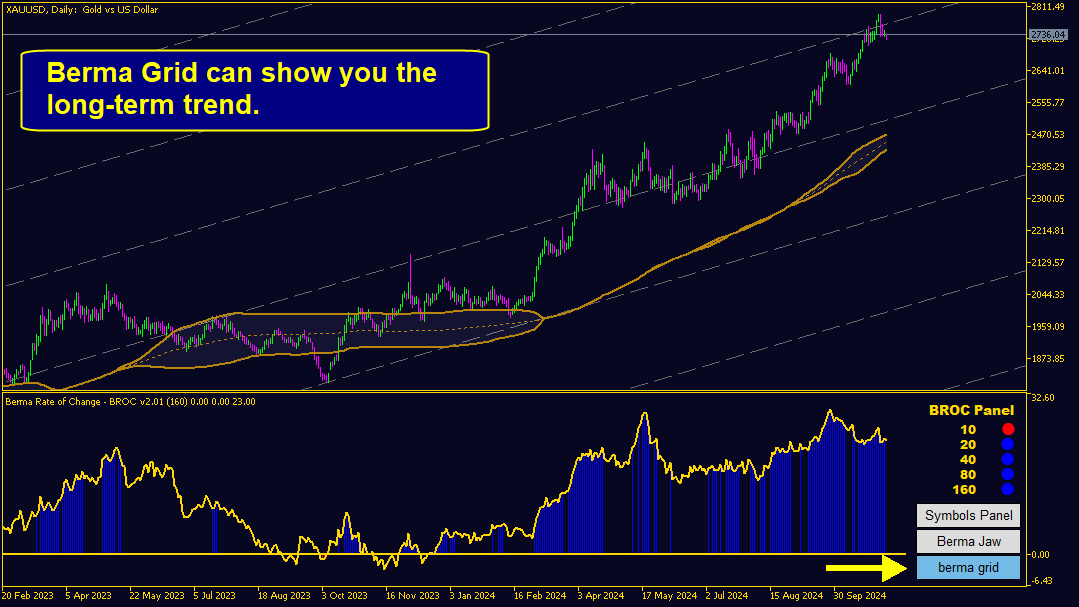
Berma Bands are composed of three distinct lines: the Upper Berma Band, the Middle Berma Band, and the Lower Berma Band. These lines are plotted around the price, creating a visual representation of the price movement relative to the overall trend. The distance between these bands can provide insights into volatility and potential trend reversals.

When the Berma Bands lines separate from each, it often suggests that the market is entering a period of sideways or ranging movement. This indicates a lack of clear directional bias. Traders may find it challenging to identify trends during these periods and may wait for a clearer trend to emerge.

When the Berma Bands lines converge into a single line, it often signals a strong trending environment. This convergence indicates a clear directional bias, as the price is volatile enough to move in trends. Traders may find it easier to identify potential entry and exit points during these periods, as the trend's momentum can provide favorable trading opportunities. However, it's important to be mindful of potential pullbacks or corrections within the overall trend.

Berma Bands provide clear buy and sell signals based on price candle interactions with the upper and lower bands. A buy signal occurs when a price candle closes above the Upper Berma Band for the first time, indicating a potential uptrend. Conversely, a sell signal is generated when a price candle closes below the Lower Berma Band for the first time, suggesting a potential downtrend. Traders can use these signals as a guide for entering or exiting positions, although it's essential to consider other factors and risk management strategies when making trading decisions.

Berma Bands can enhance trading efficiency by providing real-time alerts for buy and sell signals. This can be achieved through sound notifications, mobile alerts, or email notifications. These alerts can help traders stay informed about potential trading opportunities even when they are away from their trading screens, allowing them to react promptly to market movements.

Berma Bands’ Most Important Inputs.

BB Candles [Min =2]: The number of candles used in band calculations. If less than two the indicator will print a message, and this parameter will be reset to default (= 160).

Show Arrows & Vertical Lines:
This parameter will allow you to see potential buy and sell signals on the chart.  You can choose to show one or both.

Chart Color Scheme: Here you can find ready-made color schemes that will make your chart look more professional. You can choose (Do Nothing) if he wants to use your own colors.

If you have any questions then please, contact me via a private message or, write them in the comment section. I will reply to your messages as soon as I am online.


Reviews 10
xiesw
380
xiesw 2025.01.01 07:14 
 

Very outstanding indicators.

Juan
22
Juan 2024.12.31 01:57 
 

Considero Berma Bands como un indicador de los que te resaltan lo importante de un sólo vistazo además fácil de usar y configurar.

También tengo que resaltar la rapidez y trato agradable del desarrollador de este indicador para resolver cualquier duda sobre su producto.

Ahmedex
30
Ahmedex 2024.12.28 16:56 
 

good 5 stars

Recommended products
Owl Smart Levels MT5
Sergey Ermolov
4 (29)
MT4 version  |   FAQ The Owl Smart Levels Indicator is a complete trading system within the one indicator that includes such popular market analysis tools as Bill Williams' advanced fractals , Valable ZigZag which builds the correct wave structure of the market, and Fibonacci levels which mark the exact levels of entry into the market and places to take profits. Detailed description of the strategy Instructions for working with the indicator Advisor-assistant in trading Owl Helper Private User
Noize Absorption Index - is the manual trading system that measures the difference of pressure between bears forces and bulls forces. Green line - is a noize free index that showing curent situation. Zero value of index shows totally choppy/flat market.Values above zero level shows how powerfull bullish wave is and values below zero measures bearish forces.Up arrow appears on bearish market when it's ready to reverse, dn arrow appears on weak bullish market, as a result of reverse expectation.
How to use Pair Trading Station Pair Trading Station is recommended for H1 time frame and you can use it for any currency pairs. To generate buy and sell signal, follow few steps below to apply Pair Trading Station to your MetaTrader terminal. When you load Pair Trading Station on your chart, Pair Trading station will assess available historical data in your MetaTrader platforms for each currency pair. On your chart, the amount of historical data available will be displayed for each currency pai
Atomic Analyst MT5
Issam Kassas
4.32 (19)
First of all Its worth emphasizing here that this Trading Indicator is   Non-Repainting   , Non Redrawing and Non Lagging Indicator   Indicator, Which makes it ideal from both manual and robot trading.  User manual: settings, inputs and strategy . The Atomic Analyst  is a PA Price Action Indicator that uses Strength and Momentum of the price to find a better edge in the market. Equipped with Advanced filters which help remove noises and false signals, and Increase Trading Potential. Using Multi
Magic Finger can help you identify trends and trading opportunities clearly. The finger points to the open position signal, and the discoloration line is confirmed by the trend. If you are a day trader, you can choose to trade during a period of active trading, referring to the discoloration line as the basis for the next order, finger signal as a filter. If you are a trend trader, you can choose a period above H1, wait for the appearance of the finger signal in the key price area, and enter th
SolarTrade Suite Financial Indicator: Jupiter Market Indicator - Your Reliable Guide in the World of Financial Markets! This is a trend indicator that uses special innovative and advanced algorithms to calculate its value, and also has an eye-pleasing design. It is very easy to understand the readings of this indicator: blue color - buy, red - sell. Check out our other products from the SolarTrade Suite series at the bottom of the description. Do you want to confidently navigate the world o
To get access to MT4 version please click here . - This is the exact conversion from TradingView: "Stochastic Momentum Index" By "UCSgears". - This is a popular version of stochastic oscillator on tradingview. - This is a light-load processing and non-repaint indicator. - Buffers are available for the lines on chart. - You can message in private chat for further changes you need. Thanks for downloading
PZ Trend Trading MT5
PZ TRADING SLU
3.8 (5)
Capture every opportunity: your go-to indicator for profitable trend trading Trend Trading is an indicator designed to profit as much as possible from trends taking place in the market, by timing pullbacks and breakouts. It finds trading opportunities by analyzing what the price is doing during established trends. [ Installation Guide | Update Guide | Troubleshooting | FAQ | All Products ] Trade financial markets with confidence and efficiency Profit from established trends without getting whip
Trend Line Map Pro MT5
STE S.S.COMPANY
4.09 (11)
Trend Line Map indicator is an addons for   Trend Screener Indicator . It's working as a scanner for all signals generated by Trend screener ( Trend Line Signals ) . It's a Trend Line Scanner based on Trend Screener Indicator.  If you don't have Trend Screener Pro Indicator,   the Trend Line Map Pro will not work.     LIMITED TIME OFFER : Trend Line Map Indicator is available for only 50 $ and lifetime. ( Original price 125$ ) By accessing to our MQL5 Blog,  you can find all our premium indicat
Scan pattern
VLADISLAV AKINDINOV
The indicator is designed to help in making a decision on the direction of trading (buy or sell). It is a history scanner that searches for matches of the current pattern (combination of several current bars) with historical data in percentage terms by the relative vertical position of candles relative to each other, the size of each candle, the size of the candle body and the candle shadows. In history, the matches found are indicated by vertical lines on the candle of the beginning of the soug
Premium level is a unique indicator with more than 80% accuracy of correct predictions! This indicator has been tested for more than two months by the best Trading Specialists! The author's indicator you will not find anywhere else! From the screenshots you can see for yourself the accuracy of this tool! 1 is great for trading binary options with an expiration time of 1 candle. 2 works on all currency pairs, stocks, commodities, cryptocurrencies Instructions: As soon as the red arrow app
Renko Gold
Ignacio Agustin Mene Franco
Renko Gold! clearly indicates the floors and ceilings where it goes from 4 lines, the line below that marks the floor in green confirming with the thinnest line clarifies the purchase entry, the same is for sale, the top line marks the ceiling and the thinnest red line marks the sale, This indicator works for all temporalities! For Forex and Synthetic Indices markets! It also works for crypto markets! Good profit! World Investor.
"Support and Resistance" is a fundamental concept in technical analysis for trading stocks, currencies, or other assets in financial markets. Here's how to use it: Identifying Support Support is a price level where buying is strong. When the price drops to this level, there tends to be significant buying activity, preventing the price from falling further. Identifing Support: Look for the lowest points in a given period and find levels where the price has bounced back up multiple times. Usage:
PZ Support Resistance MT5
PZ TRADING SLU
4.17 (6)
Unlock key market insights with automated support and resistance lines Tired of plotting support and resistance lines? This is a multi-timeframe indicator that detects and plots supports and resistance lines in the chart with the same precision as a human eye would. As price levels are tested over time and its importance increases, the lines become thicker and darker, making price leves easy to glance and evaluate. [ Installation Guide | Update Guide | Troubleshooting | FAQ | All Products ] Boos
Arrow Micro Scalper - an indicator designed for scalping and short-term trading, integrated into any chart and financial instrument (currency, crypto, stocks, metals). In its work, it uses wave analysis and a trend direction filter. It is recommended to use on time frames from M1 to H4. How to work with the indicator. The indicator contains 2 external parameters for changing the settings, the rest are already configured by default. Large arrows indicate a change in trend direction, blue - the
The indicator automatically identifies and labels essential elements of market structure shift, including: Break of Structure (BoS): Detected when there is a significant price movement breaking previous structural points. It mark possible uptrend and downtrend lines(UP & DN, It means constantly update high and low ), and once the price breaks through these lines, mark the red (BEAR) and green (BULL) arrows. BoS typically occurs when the price decisively moves through swing lows or swing highs t
Was: $249  Now: $149   Market Profile defines a number of day types that can help the trader to determine market behaviour. A key feature is the Value Area, representing the range of price action where 70% of trading took place. Understanding the Value Area can give traders valuable insight into market direction and establish the higher odds trade. It is an excellent addition to any system you may be using. Inspired by Jim Dalton’s book “Mind Over Markets”, this indicator is designed to suit the
This is Gekko's customizable version of the famous Heiken Ashi indicator. It extends the use of the famous Heiken Ashi and calculates strong entry and exit signals.  Inputs Number of Bars to Plot Indicator:  number of historical bars to plot the indicator, keep it low for better performance; Produce Arrow Signals:  determine if the indicator will plot arrow signal for long/short; Produces Signal Only When a Bar Closes:  wait for a bar to close to produce a signal (more accurate, by delayed entry
An indicator of pattern #31 ("Long Island") from Encyclopedia of Chart Patterns by Thomas N. Bulkowski. The second gap is in the opposite direction. Parameters: Alerts - show alert when an arrow appears   Push - send a push notification when an arrow appears (requires configuration in the terminal) GapSize - minimum gap size in points ArrowType - a symbol from 1 to 17 ArrowVShift - vertical shift of arrows in points   ShowLevels - show levels ColUp - color of an upward line ColDn - color of a d
STRICTLY FOR BOOM INDEX ONLY!!!!! Here I bring the Maximum Trend Arrows OT1.0 MT5 indicator. This indicator is made up of a combination of different trend indicators for entries and exits, for entries an orange arrow will paint on the chart below the current market and a red flag for closing of trades and it produces buy arrows only. When the orange arrow appears, it will appear along with it's sound to notify you. The 1H timeframe is recommended, don't use it anywhere else than on the 1H timefr
Automated Trendlines MT5
Georgios Kalomoiropoulos
Trendlines  are the most essential tool of technical analysis in forex trading.  Unfortunately, most  traders don’t draw them correctly. Automated Trendlines indicator is a professional tool for serious traders that help you visualize the trending movement of the markets . AMAZING OFFER --> Activations from 5 to 20 for "MTF Supply Demand Zones" and "Automated Trendlines" There are two types of Trendlines Bullish Trendlines and Bearish Trendlines. In the uptrend, Forex trend line is drawn throu
The SMC Venom Model BPR indicator is a professional tool for traders working within the Smart Money (SMC) concept. It automatically identifies two key patterns on the price chart: FVG   (Fair Value Gap) is a combination of three candles, in which there is a gap between the first and third candles. It forms a zone between levels where there is no volume support, which often leads to a price correction. BPR   (Balanced Price Range) is a combination of two FVG patterns that form a “bridge” - a zon
Your Trend Friend
Luigi Nunes Labigalini
5 (1)
The trend is your friend! Look at the color of the indicator and trade on that direction. It does not  repaint. After each candle is closed, that's the color of the trend. You can focus on shorter faster trends or major trends, just test what's most suitable for the symbol and timeframe you trade. Simply change the "Length" parameter and the indicator will automatically adapt. You can also change the color, thickness and style of the lines. Download and give it a try! There are big movements w
PZ Mean Reversion MT5
PZ TRADING SLU
3 (2)
Outperform traditional strategies: effective mean reversion for savvy traders Unique indicator that implements a professional and quantitative approach to mean reversion trading. It capitalizes on the fact that the price diverts and returns to the mean in a predictable and measurable fashion, which allows for clear entry and exit rules that vastly outperform non-quantitative trading strategies. [ Installation Guide | Update Guide | Troubleshooting | FAQ | All Products ] Clear trading signals Am
Fractal 358 Plus
Renato Fridschtein
Fractal 358 Plus is a predictive indicator that provides the clearest sight of price movements. Identifying graphic patterns such as Caixote (Crate), Pivot and Inside Candle , it shows entries and exits spots, as well as threats to your trades in the markets. It comes ready to use with B3 Mini Index (WIN$ series) and can be adjusted to use with any asset and timeframe. Fractal 358 unravels price movement Based on the Fibonacci sequence, Fractal 358 is a new and different way of reading and und
The Gann Box (or Gann Square) is a market analysis method based on the "Mathematical formula for market predictions" article by W.D. Gann. This indicator can plot three models of Squares: 90, 52(104), 144. There are six variants of grids and two variants of arcs. You can plot multiple squares on one chart simultaneously. Parameters Square — selection of a square model: 90 — square of 90 (or square of nine); 52 (104) — square of 52 (or 104); 144 — universal square of 144; 144 (full) — "full" v
Trading Utility for Forex Currency Pairs Only not for Gold  Functions Auto Lot Calculation based on Risk Auto stoploss  Auto TakeProfit Breakeven Auto Close Half % Close in percentage with respect to the PIPs Pending Orders BuyLimit Sell Limit with distances BuyStop Sell Stop    with distances Trading Informations Risk in percentage For Multiple trades Combine Takeprofit and Combine Stoplosses
The indicator shows harmonic patterns on the chart without repainting with the minimum possible lag. The search for indicator tops is based on the wave principle of price analysis. Advanced settings allow you to choose parameters for your trading style. At the opening of a candle (bar), when a new pattern is formed, an arrow of the probable direction of the price movement is fixed, which remains unchanged. The indicator recognizes the following patterns and their varieties: ABCD, Gartley (Butter
New Combined Indicator - 3 in 1 Are you looking for trading tools that can enhance your market analysis and investment strategies? We have combined three of our best indicators into a single powerful and convenient solution, allowing you to get the most value for your trading. 1. Order Block Indicator (previously sold for $32.90) The Order Block Indicator is an essential tool for identifying areas of strong institutional interest within the market. This indicator marks the highs and lows of orde
Buyers of this product also purchase
Golden Trend Indicator MT5
Noha Mohamed Fathy Younes Badr
4.88 (17)
Golden Trend indicator  is The best indicator for predicting trend movement this indicator never lags and never repaints and never back paints    and give  arrow buy and sell    before the candle appear  and it will help you and  will make your trading decisions clearer its work on all currencies and  gold and crypto and all time frame This unique  indicator uses very secret algorithms to catch the  trends, so you can trade using this indicator and see the trend clear on charts  manual guide and
Описание индикатора MONEY Индикатор MONEY предназначен для анализа волатильности и выявления значительных рыночных движений (всплесков). Он использует ATR (Average True Range) для определения момента, когда цена выходит за пределы обычного диапазона, и сигнализирует об этом трейдеру с помощью стрелок на графике. Основные параметры: • Минимальное количество свечей – задает период для анализа всплесков. • Алерты (уведомления) – включение или отключение звуковых и текстовых сигналов. • Период AT
TPSpro RFI Levels MT5
Roman Podpora
4.55 (20)
A key element in trading is zones or levels from which decisions to buy or sell a trading instrument are made. Despite attempts by major players to conceal their presence in the market, they inevitably leave traces. Our task was to learn how to identify these traces and interpret them correctly. ИНСТРУКЦИЯ RUS         INSTRUCTIONS  ENG         R ecommended to use with an indicator   -   TPSpro  TREND PRO -  Version MT4 Bonus: 6 months of  " RFI SIGNALS "  subscription with your purchase! Main f
TPSproTREND PrO MT5
Roman Podpora
4.72 (18)
VERSION MT4        —        ИНСТРУКЦИЯ RUS           —        INSTRUCTIONS  ENG Main functions: Accurate entry signals WITHOUT REPAINTING! Once a signal appears, it remains valid! This is a significant distinction from repainting indicators that might provide a signal and then alter it, potentially leading to deposit losses. Now, you can enter the market with higher probability and precision. There's also a function to color candles after an arrow appears until the target (take profit) is reac
Quantum TrendPulse
Bogdan Ion Puscasu
5 (13)
Introducing Quantum TrendPulse , the ultimate trading tool that combines the power of SuperTrend , RSI , and Stochastic into one comprehensive indicator to maximize your trading potential. Designed for traders who seek precision and efficiency, this indicator helps you identify market trends, momentum shifts, and optimal entry and exit points with confidence. Key Features: SuperTrend Integration: Easily follow the prevailing market trend and ride the wave of profitability. RSI Precision: Detect
Top indicator for MT5   providing accurate signals to enter a trade without repainting! It can be applied to any financial assets:   forex, cryptocurrencies, metals, stocks, indices .  Watch  the video  (6:22) with an example of processing only one signal that paid off the indicator! MT4 version is here It will provide pretty accurate trading signals and tell you when it's best to open a trade and close it. Most traders improve their trading results during the first trading week with the help of
CBT Quantum Maverick High-Efficiency Binary Trading System CBT Quantum Maverick is a finely tuned, high-performance binary options trading system designed for traders seeking precision, simplicity, and disciplined trading. No customization is required—this system is optimized for effective results right out of the box. Simply follow the signals, which can be mastered with a bit of practice. Key Features: Signal Precision: New-bar-based trading signals—targeting the next candle based on curren
Timeframes Trend Scanner is a trend analyzer or trend screener indicator that helps you know the trend in all timeframes of symbol you're watching. This indicator provides clear & detailed analysis results on a beautiful dashboard, let you able to use this result right away without need to do any additional analysis. Please note that this indicator doesn't work with Strategy Tester. Sorry for that! How it works Step 1: Calculate values of 23 selected & trusted technical indicators (Oscillator &
Advanced Supply Demand MT5
Bernhard Schweigert
4.5 (14)
Best Solution for any Newbie or Expert Trader! This indicator is a unique, high quality and affordable trading tool because we have incorporated a number of proprietary features and a new formula. With this update, you will be able to show double timeframe zones. You will not only be able to show a higher TF but to show both, the chart TF, PLUS the higher TF: SHOWING NESTED ZONES. All Supply Demand traders will love it. :) Important Information Revealed Maximize the potential of Advanced Supply
Visual Heatmap Book Analyzer
Alexandre Moraes De Souza Lima
Visual Heatmap Book Analyser This indicator monitors the market liquidity and generates colors based on order patterns, quantities, and renewal activities in the book. This allows you to visualize the order flow and identify areas of high and low liquidity and activity. The indicator uses machine learning techniques to analyze the order behavior in the book, enabling it to detect patterns and trends in orders, allowing you to make informed decisions about your trading operations. The color pale
KT Candlestick Patterns MT5
KEENBASE SOFTWARE SOLUTIONS
KT Candlestick Patterns finds and marks the 24 most dependable Japanese candlestick patterns in real-time. Japanese traders have been using candlestick patterns to predict the price direction since the 18th century. It's true that not every candlestick pattern can be equally trusted to predict the price direction reliably. However, when combined with other technical analysis methods like Support and Resistance, they provide an exact and unfolding market situation. This indicator includes many
[ MT4 Version ] Are you tired of spending months on demo or live accounts to test your trading strategies? The Backtesting Simulator is the ultimate tool designed to elevate your backtesting experience to new heights. Utilizing Metatrader historical symbol information, it offers an unparalleled simulation of real market conditions. Take control of your testing speed, test ideas quickly or at a slower pace, and witness remarkable improvements in your testing performance. Forget about wasting tim
Pro Thunder V10 Neural Network Indicator for MT5 | Binary Options & OTC Trading Signals Elevate your binary options trading with   Pro Thunder V10 , the ultimate AI-powered indicator engineered for MetaTrader 5. Leveraging cutting-edge Neural Networks and years of market expertise, this non-repaint tool delivers unmatched accuracy across all market conditions—including volatile news events, OTC markets, Deriv indices (Boom 300, Crash 500), and more. Join thousands of traders worldwide who trust
Royal Scalping Indicator M5
Vahidreza Heidar Gholami
5 (6)
Royal Scalping Indicator is an advanced price adaptive indicator designed to generate high-quality trading signals. Built-in multi-timeframe and multi-currency capabilities make it even more powerful to have configurations based on different symbols and timeframes. This indicator is perfect for scalp trades as well as swing trades. Royal Scalping is not just an indicator, but a trading strategy itself. Features Price Adaptive Trend Detector Algorithm Multi-Timeframe and Multi-Currency Trend Low
MetaForecast M5
Vahidreza Heidar Gholami
5 (3)
MetaForecast predicts and visualizes the future of any market using different powerful methods. While financial markets are not always predictable, if there are patterns in the past data, MetaForecast can learn and predict the future as accurately as possible. It features a complete implementation of neural networks embedded directly into the indicator, enabling traders to create and train AI models using data from multiple symbols to learn complex patterns. MetaForecast leverages your computer'
RelicusRoad Pro MT5
Relicus LLC
4.78 (18)
How many times have you bought a trading indicator with great back-tests, live account performance proof with fantastic numbers and stats all over the place but after using it, you end up blowing your account? You shouldn't trust a signal by itself, you need to know why it appeared in the first place, and that's what RelicusRoad Pro does best! User Manual + Strategies + Training Videos + Private Group with VIP Access + Mobile Version Available A New Way To Look At The Market RelicusRoad is th
This indicator is based on the mathematics of the great trader W.D. Ganna. With its help, you can easily find strong levels by analyzing swings to find the optimal entry point. The indicator works on all instruments and all timeframes. The indicator is fully manual and has control buttons. All you need to do is press the NEW button, a segment will appear, which you can place on any movement, swing or even 1 candle that you want to analyze. By placing the segment, press the OK button. A grid (th
CONTACT US  after purchase to get the Indicator Manual. Try Now—Limited Discount for the next 10 Buyers! Download the  Metatrader 4 Version Read the product description carefully before purchasing the product.  Due to regulatory restrictions, our service is unavailable in certain countries such as India, Pakistan, and Bangladesh. Disclaimer: • Our products are available only on mql5.com. • We never contact anyone or sell our products privately. • We do not provide any personal trading advice.
This indicator identifies and displays zones, as it were areas of strength, where the price will unfold. The indicator can work on any chart, any instrument, at any timeframe. The indicator has two modes. The indicator is equipped with a control panel with buttons for convenience and split into two modes. Manual mode: To work with manual mode, you need to press the NEW button, a segment will appear. This segment is stretched over the movement and the LVL button is pressed. The level is displayed
PZ Swing Trading MT5
PZ TRADING SLU
5 (5)
Protect against whipsaws: revolutionize your swing trading approach Swing Trading is the first indicator designed to detect swings in the direction of the trend and possible reversal swings. It uses the baseline swing trading approach, widely described in trading literature. The indicator studies several price and time vectors to track the aggregate trend direction and detects situations in which the market is oversold or overbought and ready to correct. [ Installation Guide | Update Guide | Tro
Quantum Trend Sniper
Bogdan Ion Puscasu
4.73 (51)
Introducing   Quantum Trend Sniper Indicator , the groundbreaking MQL5 Indicator that's transforming the way you identify and trade trend reversals! Developed by a team of experienced traders with trading experience of over 13 years,   Quantum Trend Sniper Indicator   is designed to propel your trading journey to new heights with its innovative way of identifying trend reversals with extremely high accuracy. ***Buy Quantum Trend Sniper Indicator and you could get Quantum Breakout Indicator for
LIMITED! JUST 10 COPIES AVAILABLE!  BONUS AUX VIP Club 2024 : Include EA CAP, CEP, LDH, PSC307 & AO4C to enhance the performance of this tool to its maximum potential  Click Here to Download Files   ( for users only ) FREE Trading Education Available Daily via Zoom --- For More Info or Instant Message Click link ---  https://t.me/abcdwave Transform your trading with the "Five Magic Bullets" Indicator, tailored for traders who embrace the power of Elliott Wave Chaos Theory. Spec
TPA True Price Action indicator reveals the true price action of the market makers through 100% non-repainting signals strictly at the close of a candle! TPA shows entries and re-entries, every time the bulls are definitely stronger than the bears and vice versa. Not to confuse with red/green candles. The shift of power gets confirmed at the earliest stage and is ONE exit strategy of several. There are available now two free parts of the TPA User Guide for our customers. The first "The Basics"
Blahtech Supply Demand MT5
Blahtech Limited
4.54 (13)
Was: $299  Now: $149  Supply Demand uses previous price action to identify potential imbalances between buyers and sellers. The key is to identify the better odds zones, not just the untouched ones. Blahtech Supply Demand indicator delivers functionality previously unavailable on any trading platform. This 4-in-1 indicator not only highlights the higher probability zones using a multi-criteria strength engine, but also combines it with multi-timeframe trend analysis, previously confirmed swings
Trend Forecaster
Alexey Minkov
5 (6)
!SPECIAL SALE!  The Trend Forecaster indicator utilizes a unique proprietary algorithm to determine entry points for a breakout trading strategy. The indicator identifies price clusters, analyzes price movement near levels, and provides a signal when the price breaks through a level. The Trend Forecaster indicator is suitable for all financial assets, including currencies (Forex), metals, stocks, indices, and cryptocurrencies. You can also adjust the indicator to work on any time frames, althoug
Golden Spikes Detector
Batsirayi L Marango
3.25 (4)
Golden Spikes Detector This indicator is based on an advanced strategy primarily for trading spikes on Boom and Crash Indices. Complex algorithms were implemented to detect high probability entries only. It alerts on potential Buy and Sell entries. To trade spikes on the Deriv or Binary broker, only take Buy Boom and Sell Cash alerts. It was optimised to be loaded on 5-minute timeframe although multiple timeframe analysis is done in the background. Features ·             Desktop pop up and sound
AT Forex Indicator MT5
Marzena Maria Szmit
5 (5)
The AT Forex Indicator MT5 is a sophisticated trading tool designed to provide traders with a comprehensive analysis of multiple currency pairs. This powerful indicator simplifies the complex nature of the forex market, making it accessible for both novice and experienced traders. AT Forex Indicator uses advanced algorithms to detect trends, patterns and is an essential tool for traders aiming to enhance their forex trading performance. With its robust features, ease of use, and reliable signal
Elliott Wave Trend was designed for the scientific wave counting. This tool focuses to get rid of the vagueness of the classic Elliott Wave Counting using the guideline from the template and pattern approach. In doing so, firstly Elliott Wave Trend offers the template for your wave counting. Secondly, it offers Wave Structural Score to assist to identify accurate wave formation. It offers both impulse wave Structural Score and corrective wave Structure Score. Structural Score is the rating to sh
Royal Wave Pro M5
Vahidreza Heidar Gholami
3.5 (4)
Royal Wave is a Trend-Power oscillator which has been programmed to locate and signal low-risk entry and exit zones. Its core algorithm statistically analyzes the market and generates trading signals for overbought, oversold and low volatile areas. By using a well-designed alerting system, this indicator makes it easier to make proper decisions regarding where to enter and where to exit trades. Features Trend-Power Algorithm Low risk Entry Zones and Exit Zones Predictions for Overbought and Over
Introduction to Fractal Pattern Scanner Fractal Indicator refers to the technical indicator that makes use of the fractal geometry found in the financial market. Fractal Pattern Scanner is the advanced Fractal Indicator that brings the latest trading technology after the extensive research and development work in the fractal geometry in the financial market. The most important feature in Fractal Pattern Scanner is the ability to measure the turning point probability as well as the trend probabil
More from author
Bermaui Manual EA
Muhammad Elbermawi
5 (10)
This is a semi-automatic expert advisor that trades the grid system. The idea is to gradually take different positions in the market, then to calculate the break-even level for them. When the prices pass this break-even by a predetermined distance all opened orders are closed. Important Information Here is the user's guide:   https://www.mql5.com/en/blogs/post/730567 You can try this EA with any of my other products, here:    https://www.mql5.com/en/users/bermaui314/seller Important Features T
Bermaui Deviation Percent
Muhammad Elbermawi
4.94 (111)
Or ( BD% ) which is a volatility index that measures volatility in percent rather than points. The idea of BD% is to make an index depending on the Classic Standard Deviation (CSD) that moves between 0 and 100 percent. You can use BD% to compare volatility for the same security in different time periods or different time-frames. In addition, you can use BD% to compare volatility between different securities in different markets in terms of percent rather than points. HOW TO USE "BD%" If BD%
MASR Bands
Muhammad Elbermawi
5 (5)
Or M oving A verage S upport R esistance Bands . MASR Bands indicator is a moving average surrounded by two bands that work together as support and resistance levels. Statistically, MASR Bands contain price candles 93% of the time. Here is how it is calculated in steps: 1. The first step is to calculate the highest high (HHV) and the lowest low (LLV) for an X period of time. 2. The second step is to divide HHV by LLV to get how wide is the distance between them as a percentage. I call the resu
True Direction Oscillator
Muhammad Elbermawi
4.86 (359)
Or (TDO)  which is an index that measures the price rate of change using the principle of " Pure Momentum ". When a security price advances from 10 to 15 then the price rate of change is 150% but when it declines back from 15 to 10 then the price rate of change is 33.3% only. That is why technical analysis indicators like "Price Rate of Change" (ROC) or "Momentum" give higher readings for ascending price movements than those given to descending ones. TDO fixes this problem to help traders at rea
Bermaui Bands
Muhammad Elbermawi
4.97 (67)
Bermaui Bands (BB) is a technical analysis tool that helps filter between ranging and trending price movements. The idea behind this indicator can be explained in the next steps: Calculate Standard Deviation as an oscillator that moves between 0 and 100. I will name it Bermaui Deviation percent (BD %). If "BD %" is near zero then volatility is at its extreme. In addition, if "BD %" is near 100 then volatility is very low. High volatility means a great probability for a trending market, while low
Bermaui Pin Bars
Muhammad Elbermawi
5 (13)
Bermaui Pin Bars   Or (BPB) is an indicator that finds Pin Bars price action pattern on the chart. Pin Bars is a shortcut for "Pinocchio Bars" which is a classic bar pattern alternative to Japanese candlesticks with tall upper or lower shadows and very small bodies like Hammer, Inverted-Hammer, Hanging Man, Shooting Star, Dragon Fly Doji or Grave Stone Doji. Bermaui Pin Bars indicator find this pattern depending on a formula that can be explained in the next steps: At first BPB calculate the ce
Bermaui RSI Candles
Muhammad Elbermawi
5 (4)
The idea of this indicator is to draw RSI in the form of candles that can be compared with price charts to generate buy and sell signals. The indicator is not my invention. I founded it on the internet several years ago. I updated the code, added alert functions, added the Bermaui Utilities group of tools. The indicator calculates the RSI of all the prices that are used to draw candlesticks (RSI of the open, high, low & close). It uses the highest of them to draw the RSI candles high wick & the
Moving Average Cloud
Muhammad Elbermawi
4.92 (13)
Or "MAC". This is an indicator designed to help you capture and trade the trend. The idea behind this indicator can be explained in the next steps: Draw a fast-moving average Envelope. Draw a slow-moving average Envelope. The MAC Upper Band is the highest value between the high of both Envelopes. The MAC Lower Band is the lowest value between the low of both Envelopes. The MAC Histogram Cloud fills the distance between two bands to show you change in direction. Blue Cloud indicates the uptrend
Classic Keltner Channel
Muhammad Elbermawi
4.87 (30)
Or CKC. This indicator works depending on the classic ten-day moving average rule described by Chester W. Keltner (1909–1998). All parameters are set to the classic version of the Keltner system by default, while the user can change them if he wants. Important Information    Read CKC Manual:   https://www.mql5.com/en/blogs/post/736577    CKC Expert Advisor Example:   https://www.mql5.com/en/blogs/post/734150 About Keltner Channel Formula 1. Calculate the Center Line as a simple moving average
Bermaui Channel
Muhammad Elbermawi
5 (19)
This is a price channel that shows five important price levels on the chart. Those levels are: 1. The Highest High (HH) of the previous x bars. 2. The Highest Low (HL) of the previous x bars. 3. The Center Line. 4. The Lowest High (LH) of the previous x bars. 5. The Lowest Low (LL) of the previous x bars. How does Bermaui Channels Captures Overbought  area Think of the distance between HH and HL levels as an overbought area. When the price candles or bars crosses the HL to the upside this indica
Filter:
pornchai_p
838
pornchai_p 2025.03.24 09:40 
 

User didn't leave any comment to the rating

squidme
573
squidme 2025.03.19 08:42 
 

User didn't leave any comment to the rating

Gouzief Hanna Kamel Hanna
140
Gouzief Hanna Kamel Hanna 2025.02.25 13:45 
 

User didn't leave any comment to the rating

sultan10001
68
sultan10001 2025.02.06 07:46 
 

User didn't leave any comment to the rating

xiesw
380
xiesw 2025.01.01 07:14 
 

Very outstanding indicators.

Juan
22
Juan 2024.12.31 01:57 
 

Considero Berma Bands como un indicador de los que te resaltan lo importante de un sólo vistazo además fácil de usar y configurar.

También tengo que resaltar la rapidez y trato agradable del desarrollador de este indicador para resolver cualquier duda sobre su producto.

Ahmedex
30
Ahmedex 2024.12.28 16:56 
 

good 5 stars

Khaled Akachat
24
Khaled Akachat 2024.12.21 18:11 
 

User didn't leave any comment to the rating

Nuno Silva Da Cruz
923
Nuno Silva Da Cruz 2024.12.18 19:11 
 

User didn't leave any comment to the rating

teejay77
438
teejay77 2024.11.13 17:51 
 

User didn't leave any comment to the rating

Reply to review