Gann Candles
- Indicators
- Ryan L Johnson
- Version: 1.10
- Updated: 14 November 2024
- Activations: 5
This Gann Candles indicator incorporates a series of W.D. Gann's strategies into a single trading indicator. Gann was a legendary trader who lived from 1878 to 1955. He started out as a cotton farmer and started trading at age 24 in 1902. His strategies included geometry, astronomy, astrology, times cycles, and ancient math. Although Gann wrote several books, none of them contain all of his strategies so it takes years of studying to learn them. He was also a devout scholar of the Bible and the ancient Greek and Egyptian cultures, and he was a 33rd degree Freemason of the Scottish Rite.
In an effort to simplify what I believe are the best of Gann's strategies, I reduced them into one indicator that simply colors your preexisting price bars when those strategies are in-sync versus out-of-sync. This greatly reduces potential chart clutter. Also, I reduced the number of input settings down to only two:
- FastFilter, and
- SlowFilter
Both FastFilter and SlowFilter must be set to 5 or more, as noted in the Inputs tab upon attaching the indicator to your chart.
Gann Candles works on regular time-based charts (M5, M15, M20, etc.) and custom charts (Renko, range bars, etc.). The indicator does not repaint.
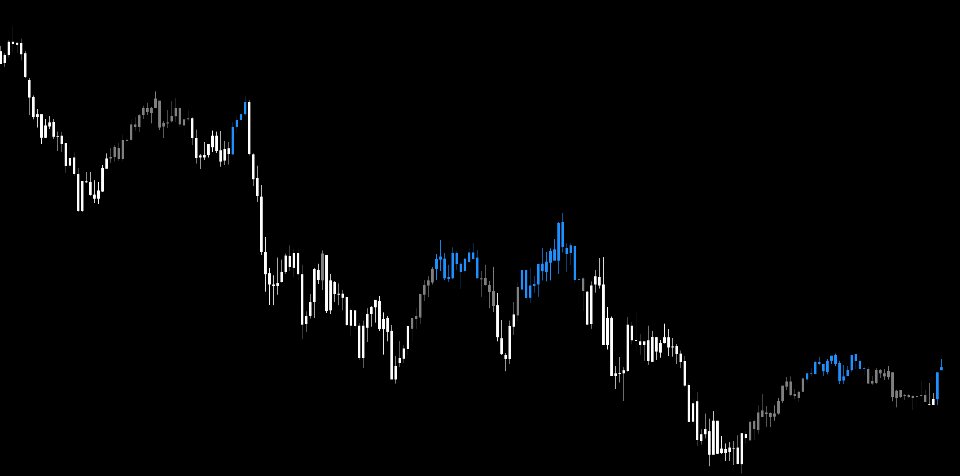
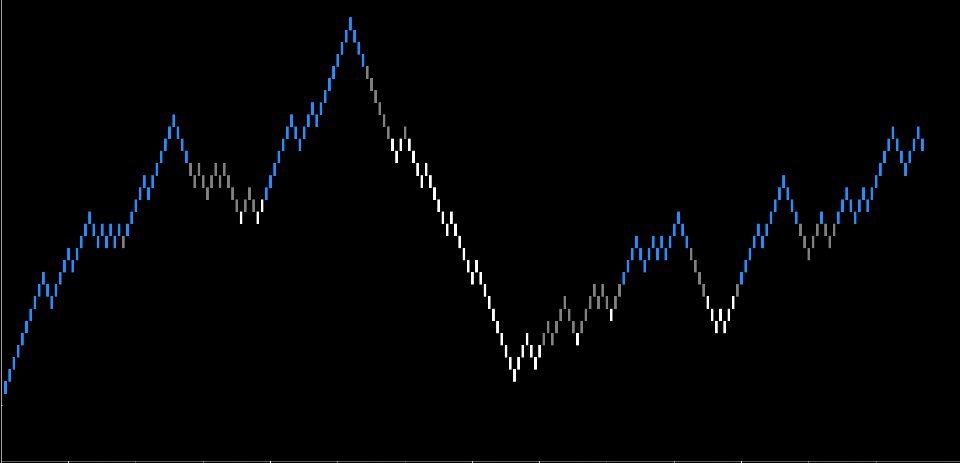
When using the default settings, blue candles form bullish price patterns, gray candles form flat (sideways) price patterns, and white candles form bearish price patterns. The simplest way to trade Gann Candles is to buy at the close of a blue candle and exit at the close of a gray candle, and then sell at the close of a white candle and exit at the close of a gray candle. The pictures of Gann Candles on a chart (below) more or less speak for themselves.
LEGAL DISCLAIMER: Nothing in this post may be construed as trading nor investment advice. Any and all examples provided above merely illustrate the technical features and hypothetical usage of the indicator posted herein.
