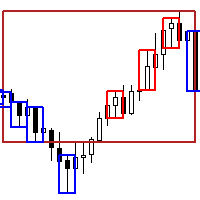
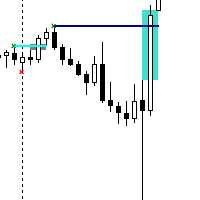
Swing Points 4
- Indicators
- Usiola Oluwadamilol Olagundoye
- Version: 1.10
- Updated: 4 November 2024
- Activations: 20
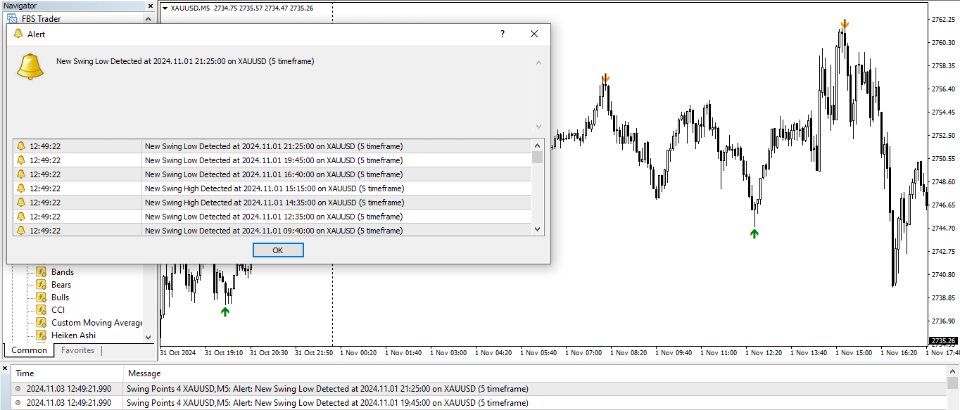
Swing Highs and Lows Detection:
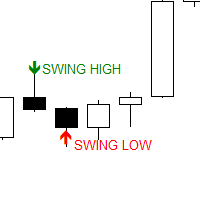
Visual Representation:
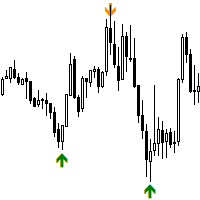
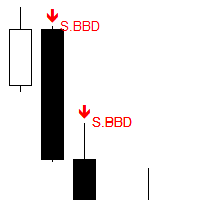
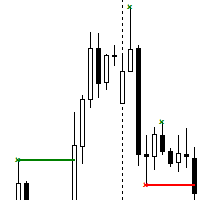
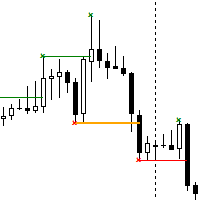
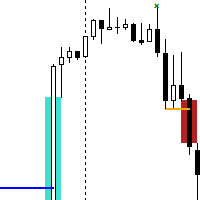
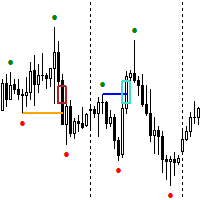
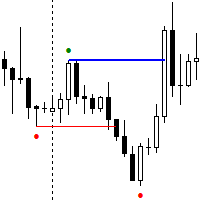
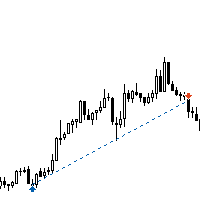
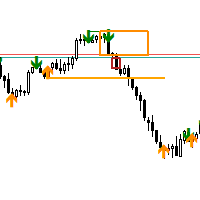
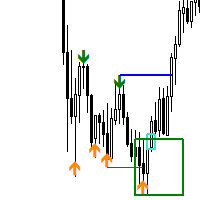
The indicator plots colored arrows on the chart:
This visual aid helps traders quickly spot key turning points without needing to manually analyze price movements.
Automatic Swing Object Deletion:
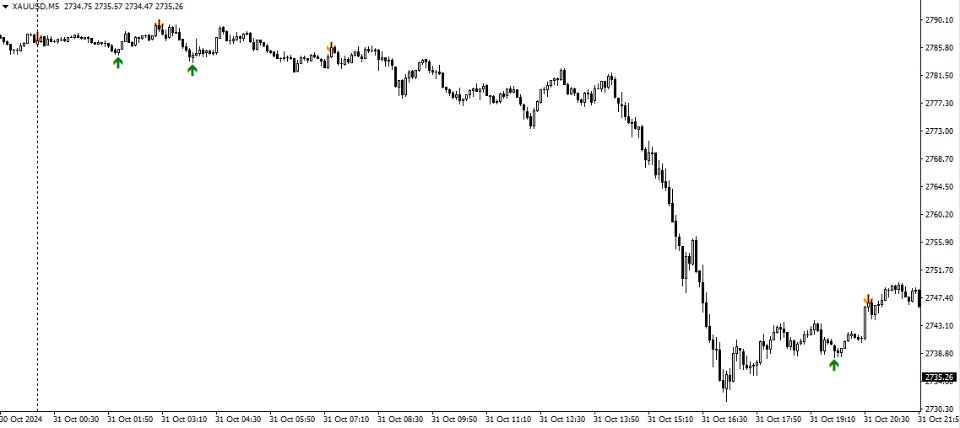
To maintain a clean and relevant chart, the Swing Points Indicator automatically deletes old swing high or low arrows if new, more significant swing points are detected. This ensures that the chart remains uncluttered, preventing confusion from outdated signals. For example, if a new swing high forms that is higher than the previous one, the previous arrow is automatically removed, leaving only the most current signals visible.
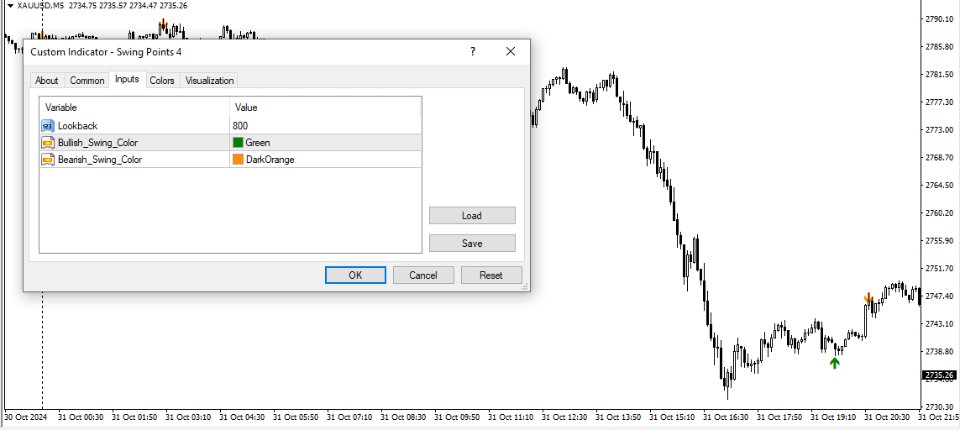
Lookback Period:
Specifies the number of bars the indicator should examine to identify swing points, offering flexibility for both short-term and long-term strategies.
Trend Reversals and Market Breakouts:
Swing points are critical for identifying trend reversals and potential breakout levels. By marking significant highs and lows, the indicator enables traders to spot key levels where price may reverse or break through, leading to substantial market movements. This makes it useful for both trend-following and counter-trend strategies.
Support and Resistance Identification:
Swing highs and lows often coincide with important support and resistance levels. Traders can use these points as dynamic levels where the market may stall or reverse. This can aid in placing stop-loss levels, setting profit targets, or determining optimal entry points for trades.
