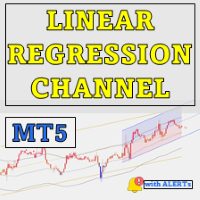
Linear Regression Channel MT4
- Indicators
- Duc Hoan Nguyen
- Version: 1.0
- Activations: 10
Only 4 Copies Available at $49 – Secure Yours Before the Price Increases to $149!
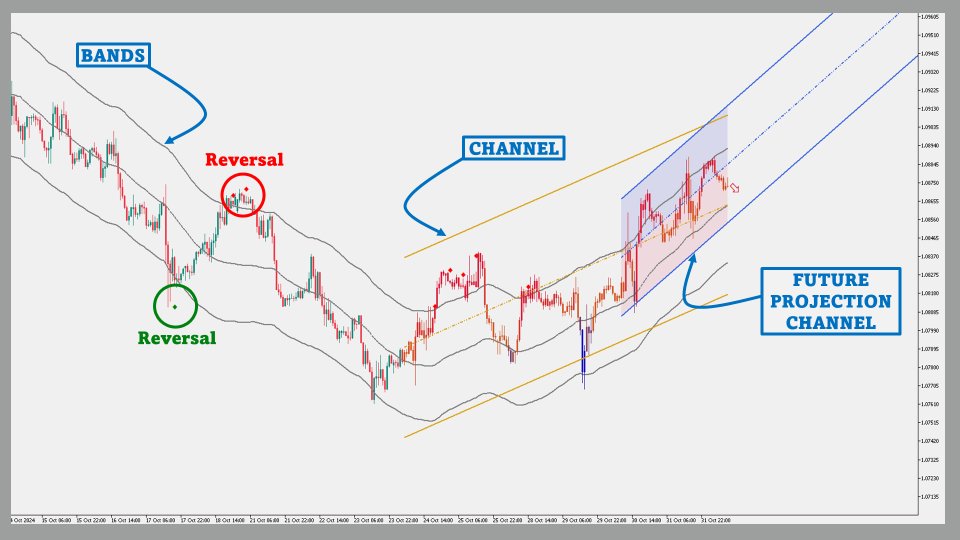
The Linear Regression Channel Indicator is a powerful technical analysis tool that helps traders capture price trends and potential reversal points. By calculating and displaying linear regression channels, bands, and future projections, this indicator offers an in-depth perspective on market dynamics. It aids in identifying overbought and oversold conditions, trend direction, and provides clear visual cues for potential future price movements.
See more MT5 version at: Linear Regression Channel MT5
See more products at: https://www.mql5.com/en/users/ndhsfy/seller
Key Features:
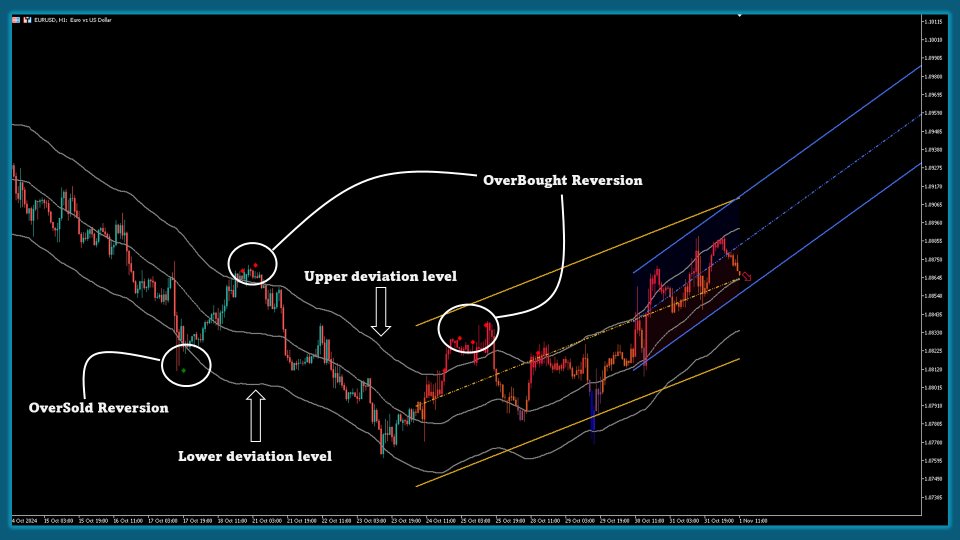
1. Linear Regression Bands:
- Function: Plots bands based on linear regression calculations, representing overbought and oversold levels.
- Customization:
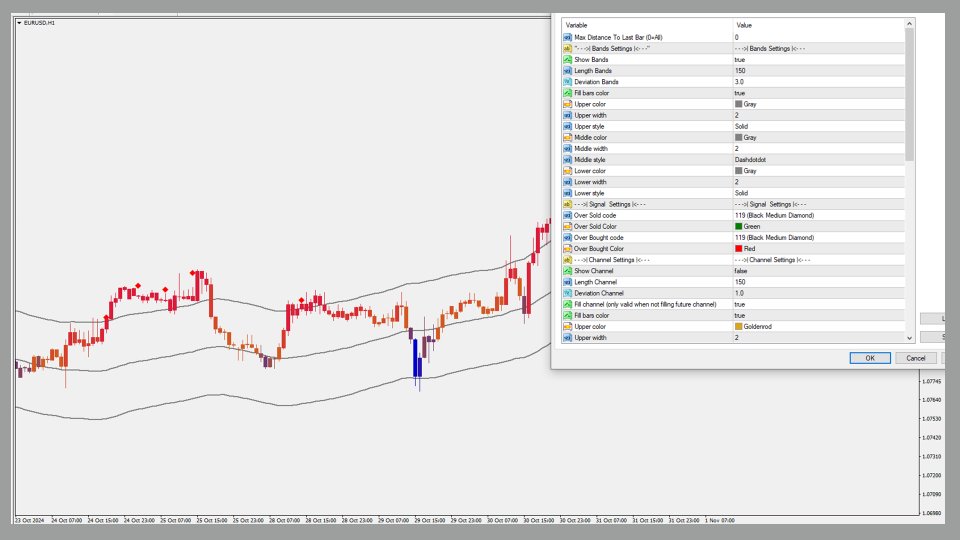
- Length: Adjusts the look-back period for the regression calculation, flexible for various timeframes.
- Deviation: Defines the width of the bands to highlight key levels within trends.
2. Linear Regression Channel:
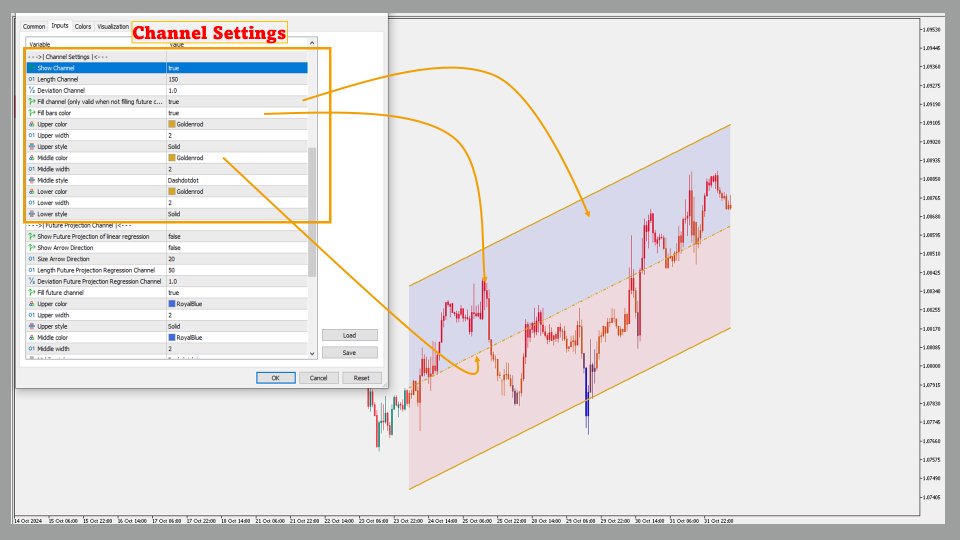
- Function: Displays a channel using linear regression to illustrate the primary price trend.
- Customization:
- Channel Length: Sets the look-back period for the channel calculation, adaptable for reflecting short- or long-term trends.
- Deviation: Adjusts the channel’s width to help identify critical trend points.
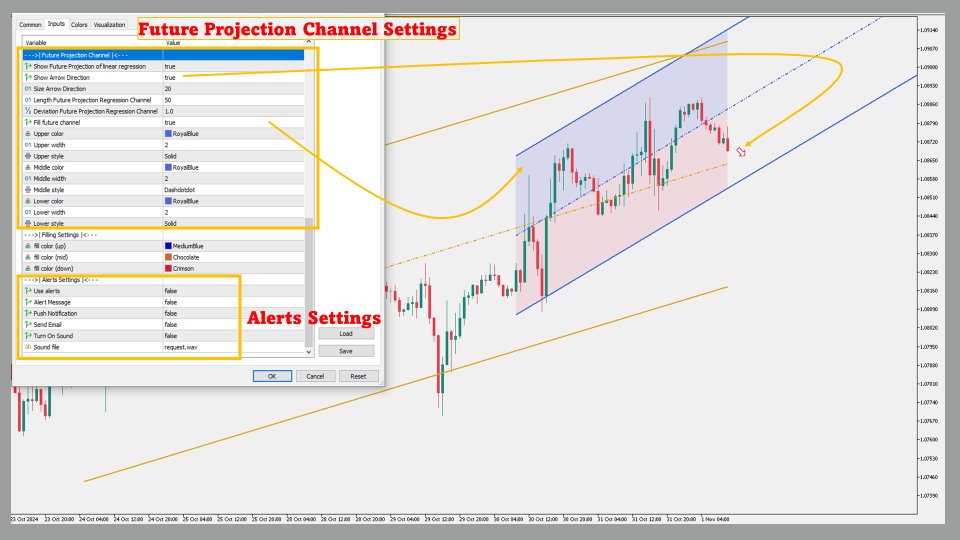
3. Future Projection Channel:
- Function: Projects a linear regression channel into the future, assisting in predicting potential price movements.
- Customization:
- Length: Defines the look-back period for the projection calculation.
- Deviation: Determines the width of the projected channel, useful for setting target prices or stop-loss levels.
4. Arrow Direction:
- Function: Displays directional arrows based on future projection, indicating expected price movement.
- Usage Tip: An upward arrow suggests a potential uptrend, while a downward arrow indicates a potential downtrend.
5. Color-Coded Price Bars:
- Function: Colors price bars based on their position within the regression bands or channel, creating a heatmap effect for identifying bullish, bearish, and neutral conditions.
6. Dynamic Visualization:
- Dynamic Colors: Uses standout colors to differentiate market conditions, such as uptrends, downtrends, and mid-levels.
- Labels and Markers: Highlights significant price levels and conditions, enhancing interpretability with markers on critical trading signals.
Usage Notes:
- Setting the Length: Adjust the look-back period to fit the timeframe you are analyzing. Shorter lengths respond quickly to recent price changes, while longer lengths offer a broader trend perspective.
- Interpreting Bands and Channels: The bands and channels help pinpoint overbought and oversold conditions. Prices rising above the upper band or channel indicate overbought conditions, while those dropping below the lower band or channel suggest oversold conditions.
- Using Future Projection: The future projection channel is particularly useful for forecasting price trends and setting targets or stop levels based on anticipated movements.
- Color-Coded Price Bars: The price bar colors shift based on their position within the bands or channel, helping identify bullish, bearish, and neutral conditions with ease.
Benefits:
The Linear Regression Channel is an ideal tool for traders looking to enhance their technical analysis. With its range of regression-based visualizations and flexible parameters, this indicator aids in identifying essential market conditions, trend directions, and potential reversal points. Whether you are a short-term trader or a long-term investor, the Linear Regression Channel can provide valuable insights to support your trading strategy.
