ZeroLag MA trend levels for MT4
- Indicators
- Minh Truong Pham
- Version: 1.0
- Activations: 5
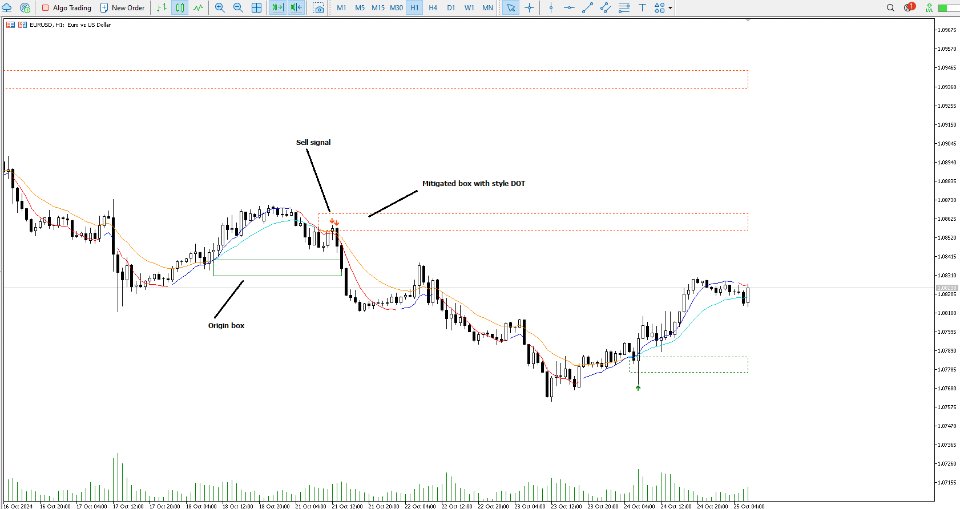
The Zero-Lag MA Trend Levels indicator combines a Zero-Lag Moving Average (ZLMA) with a standard Exponential Moving Average (EMA) to provide a dynamic view of the market trend. This indicator automatically plots the EMA and ZLMA lines on the chart. The colors of the lines represent the market trend.
With EMA:
++ green (uptrend) when EMA > zlma
++ red (downtrend) when EMA < zlma
With ZLMA:
++ green (uptrend) when the line is trending up
++ red (downtrend) when the line is trending down
When the two lines intersect, the indicator automatically determines the zone by adding/subtracting the ATR value. These are the resistance and support zones.
When the price returns to the resistance and support zones, along with some calculated factors, it will give us buy and sell signals for high profits.
Resistance and support zones will become invalid when the price exceeds these zones.
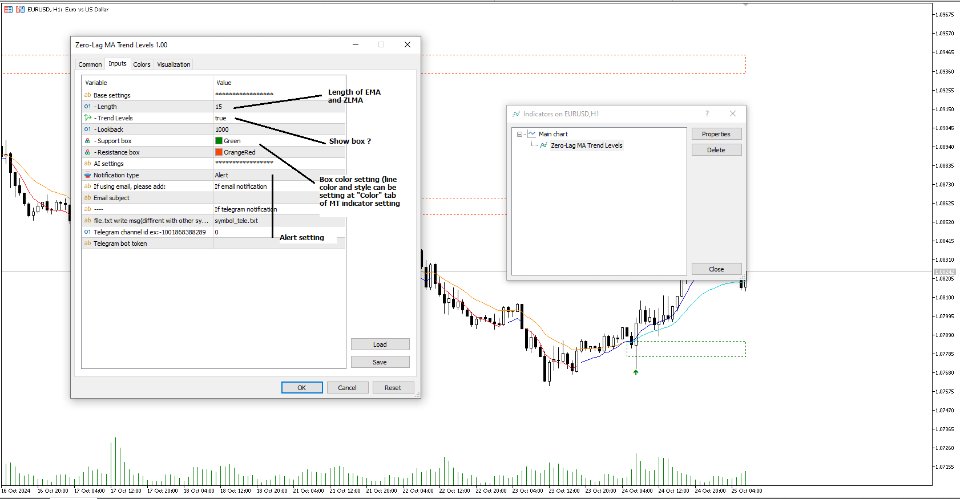
⯁ INPUT settings
+ Length of EMA
+ Show Box setting
+ Notification setting


