SuperTrend AI Clustering MT5 with Scanner
- Indicators
- Duc Hoan Nguyen
- Version: 2.10
- Updated: 27 February 2025
- Activations: 10
New tools will be $30 for the first week or the first 3 purchases!
Trading Tools Channel on MQL5: Join my MQL5 channel to update the latest news from me
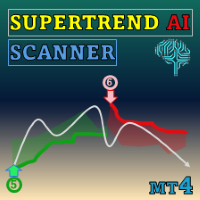
Discover the power of AI with the SuperTrend AI Clustering MT5 with Scanner, a revolutionary trading tool for MetaTrader 5 (MT5). This indicator redefines market analysis by combining K-means clustering with the widely popular SuperTrend indicator, giving traders an edge in navigating trends and signals.
See more MT4 version at: SuperTrend AI Clustering MT4 with Scanner
See more products at: https://www.mql5.com/en/users/ndhsfy/seller
While traditional SuperTrend indicators help detect trends, the SuperTrend AI Clustering takes it further by incorporating machine learning. This means that instead of static settings, the indicator dynamically adjusts based on real-time performance metrics, providing more accurate and timely signals.
How It WorksSuperTrend AI works similarly to a standard SuperTrend, but with an adaptive edge. By adjusting the range of values and performance settings, traders can generate longer-term signals. Each signal comes with performance metrics, offering insights into trend strength and helping traders make informed decisions. For instance, higher values indicate a stronger trend, while lower values suggest a potential pullback.
What makes this tool exceptional is its adaptive moving average function, which can also serve as support and resistance levels. By fine-tuning the performance memory, traders can generate more reliable long-term signals, making this a valuable asset for both short-term traders and those with a longer market outlook.
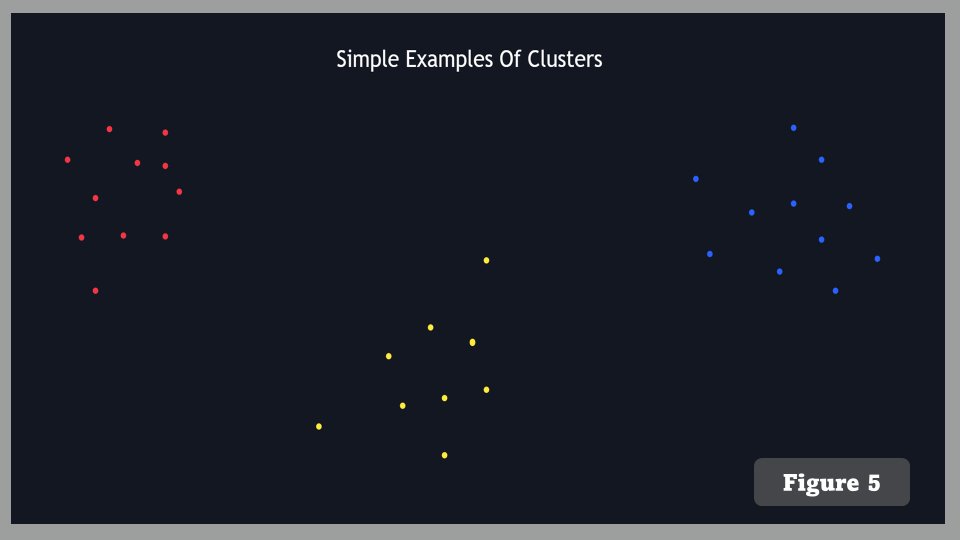
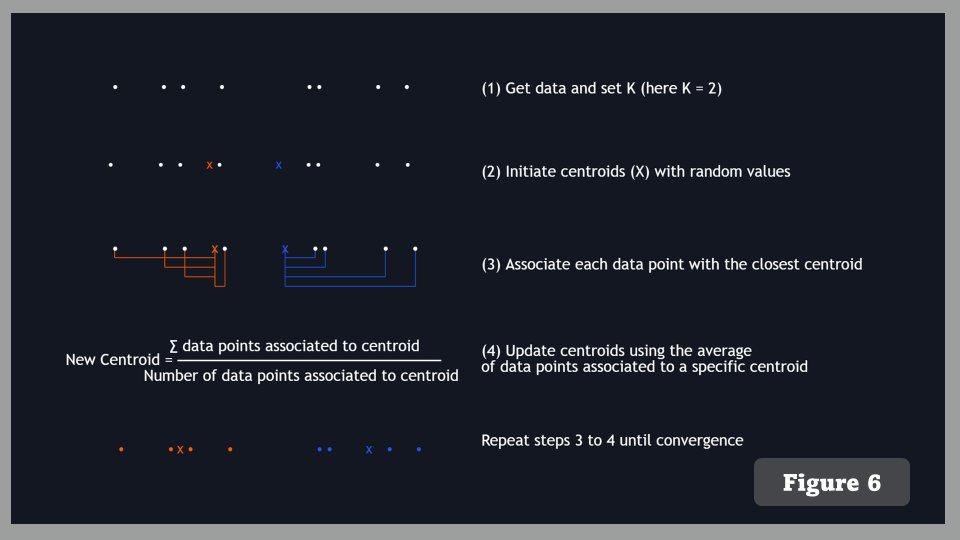
Key Features K-Means Clustering ExplainedK-means clustering, a powerful unsupervised machine learning technique, helps the indicator identify patterns and group market data. The steps include:
- Predefining the number of clusters (K).
- Randomly initializing centroids (cluster centers).
- Assigning data points to the closest centroid.
- Recalculating the centroids based on assigned points.
- Repeating the process until the clusters stabilize.
With these steps, the SuperTrend AI Clustering groups different market conditions, allowing traders to spot optimal entry and exit points more easily.
Adaptive SuperTrendThe AI-driven aspect of this indicator is based on the idea that:
“At any given moment, the best-performing configuration of an indicator is the most relevant for trading.”
By applying this logic, the indicator selects the top-performing settings based on past performance, adjusting in real-time as market conditions change. This makes the SuperTrend AI more flexible and responsive to price fluctuations.
The indicator further refines its results by averaging the top-performing settings, ensuring a smoother and more reliable trend calculation.
Settings Breakdown- ATR Length: Defines the period used for the Average True Range (ATR) in SuperTrend calculations.
- Factor Range: Determines the range of SuperTrend factor values.
- Step: Specifies the increments within the factor range.
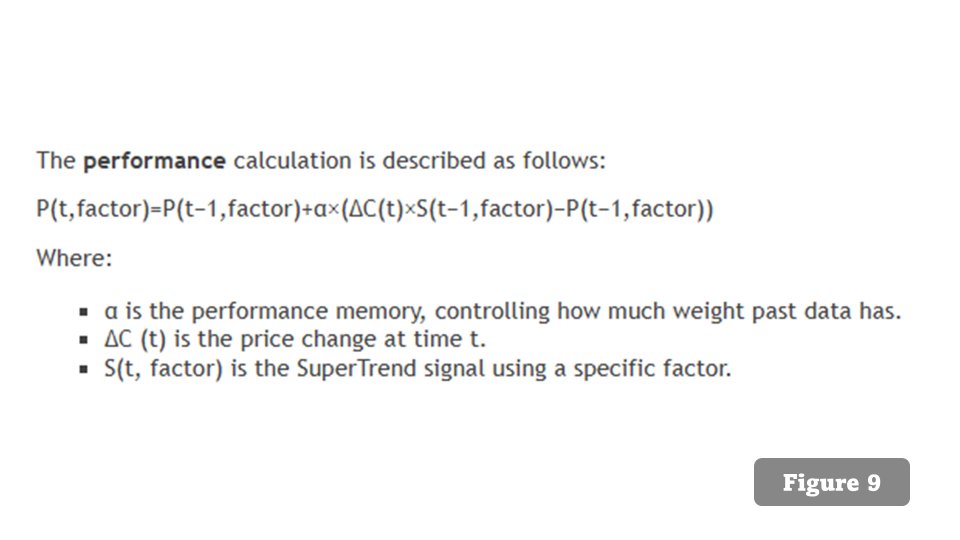
- Performance Memory: Controls how much weight past data has in determining future performance.
- Cluster Selection: Allows users to pick whether the final output comes from the best, average, or worst-performing clusters.
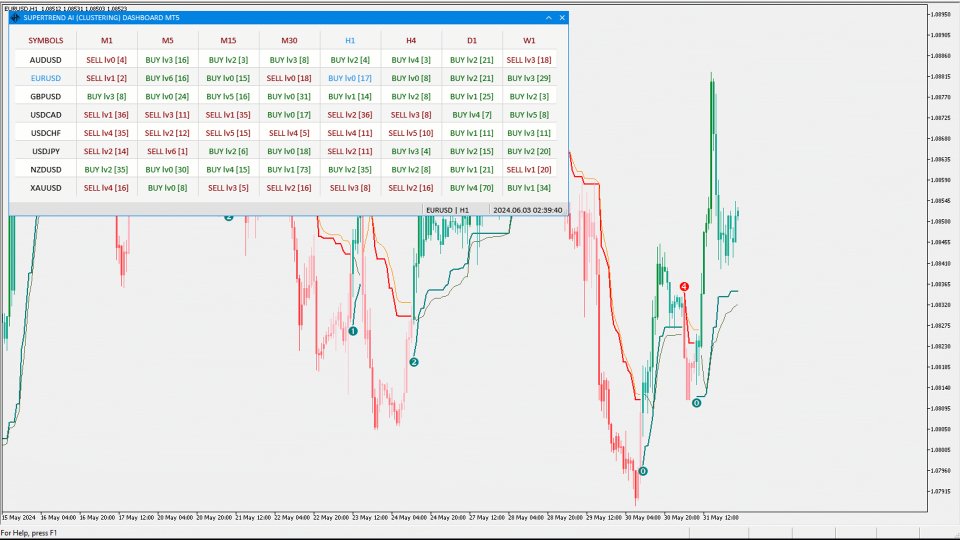
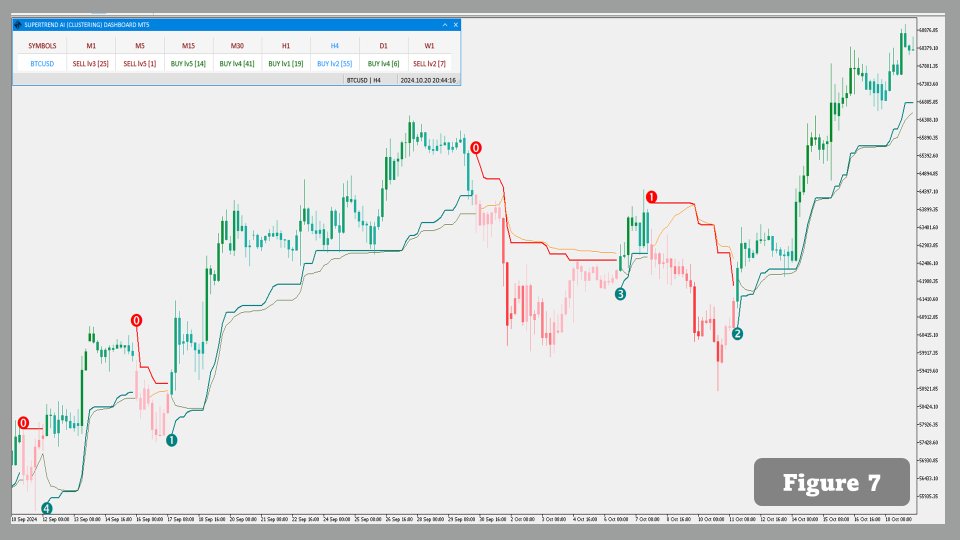
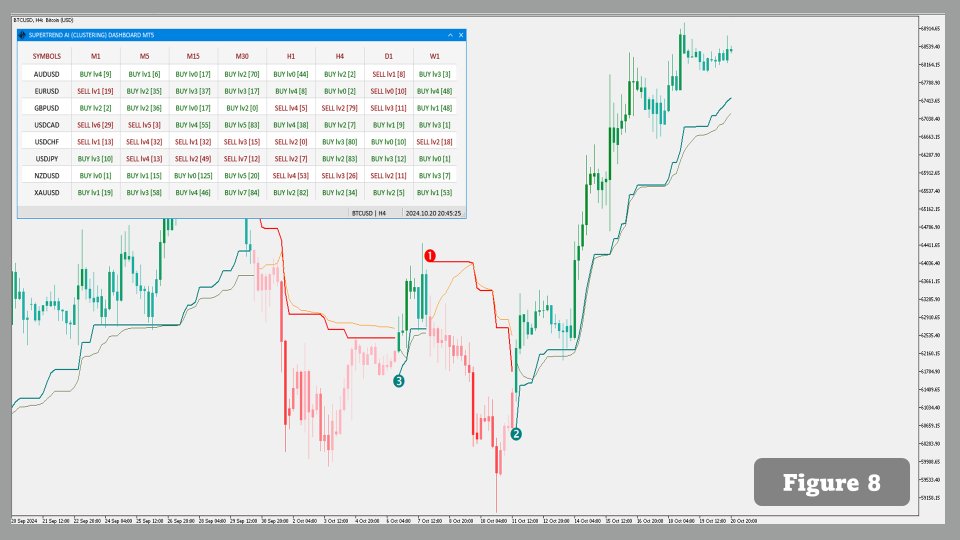
The SuperTrend AI Clustering MT5 with Scanner includes a built-in scanner that enables users to monitor trends across multiple currency pairs and timeframes simultaneously. The alert system ensures you never miss a critical signal, whether you’re looking for short-term moves or longer-term trend changes.
Optimized for Performance- Maximum Iteration Steps: Limits the iterations in clustering, balancing accuracy with performance.
- Historical Data Range: Allows users to define the window of historical data used by the indicator, optimizing performance without sacrificing accuracy.
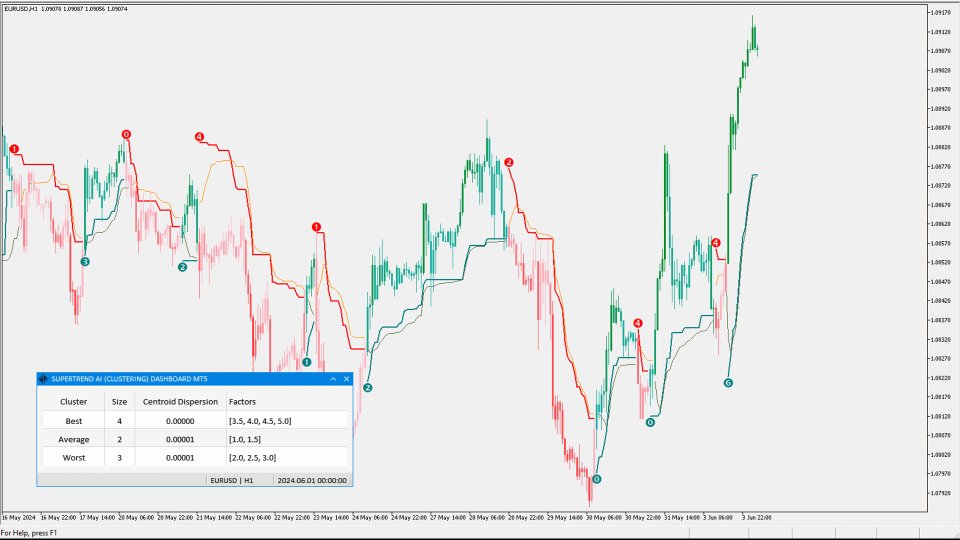
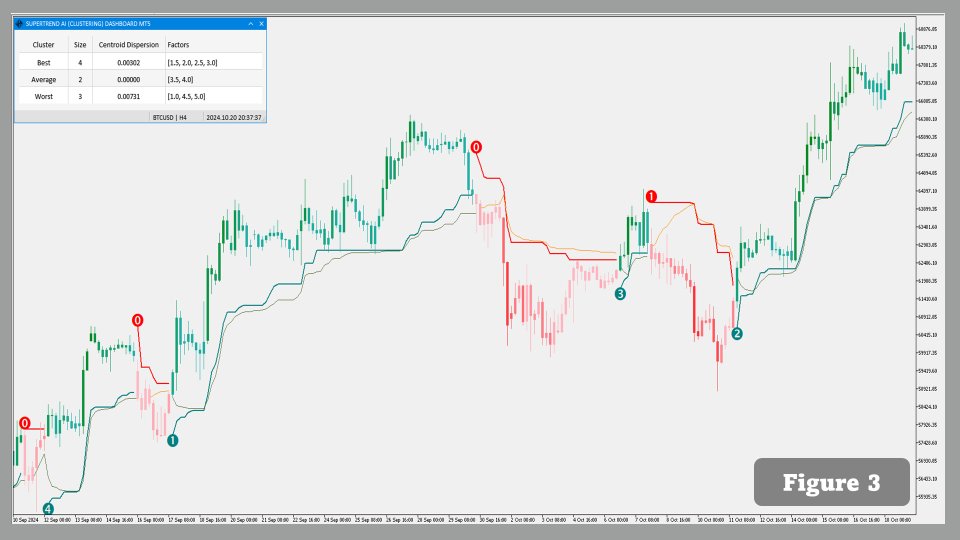
List of Images Attached:
- Figure 1: Indicator in StrategyTester and no dashboard display
- Figure 2: Indicator in StrategyTester with dashboard display
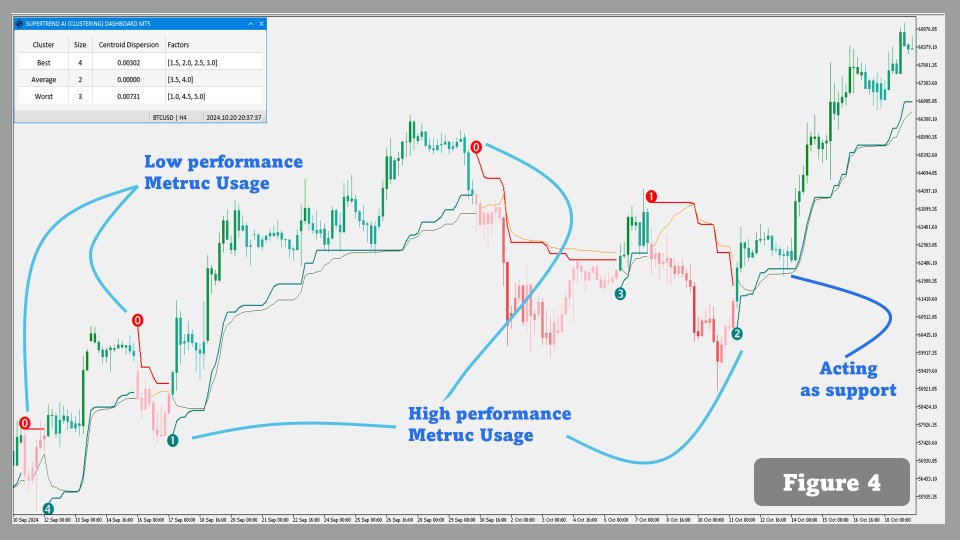
- Figure 3,4: Example image of SuperTrend AI in action
- Figure 5: Example image showing K-Means clustering .
- Figure 6: Illustrative example image of performance calculation.
- Figure 7: Scanner interface for current currency pair
- Figure 8: Scanner interface for multiple currency pairs
