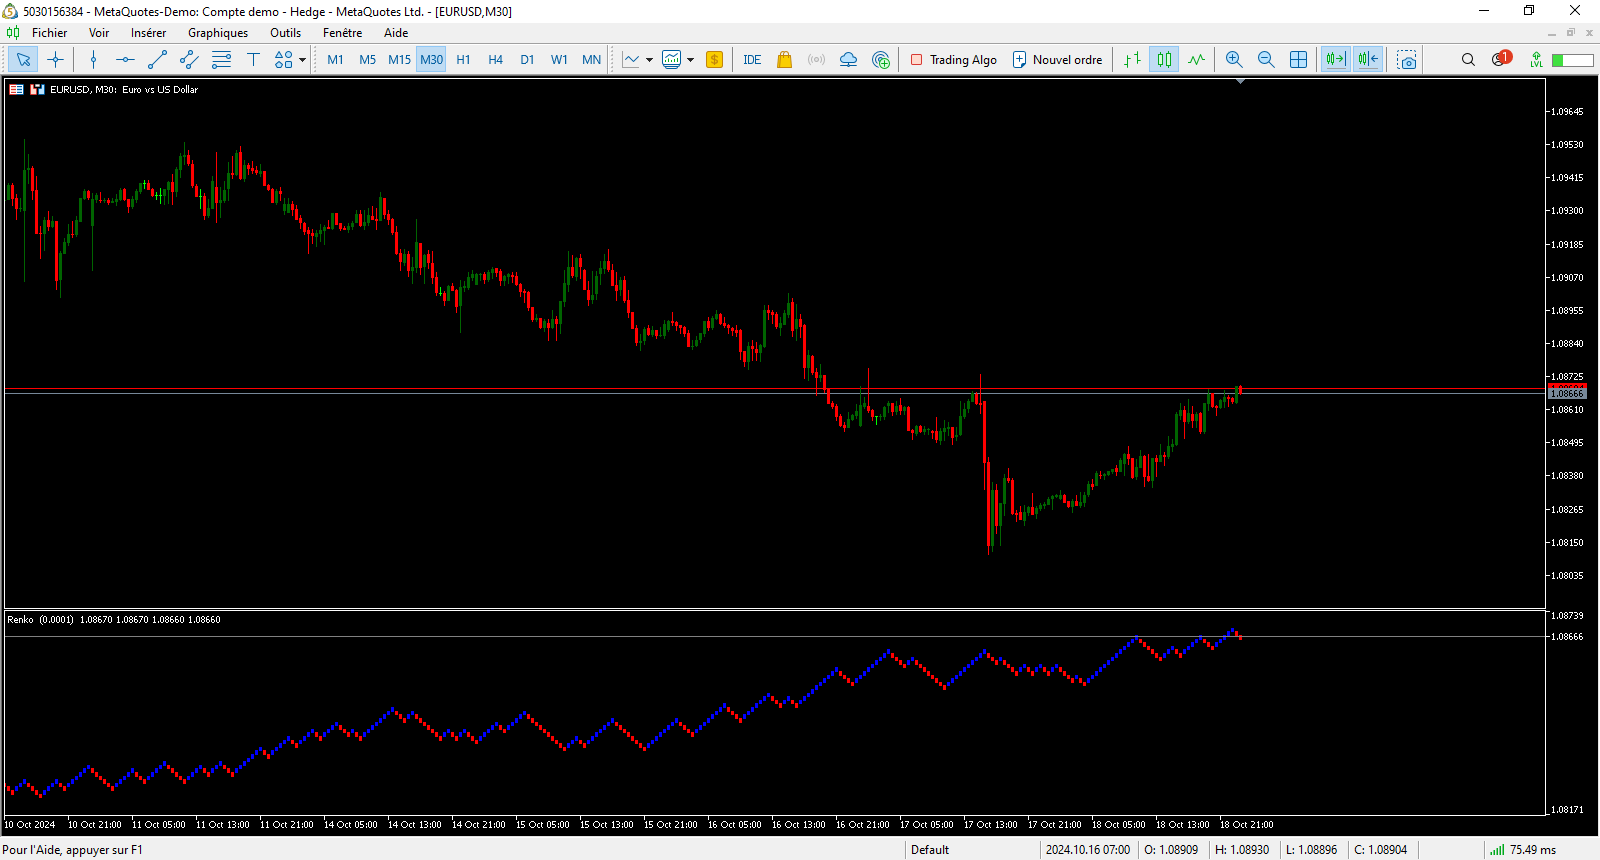
• Overview
  • Reviews
  • Comments (1)

Renko Indicator MT5

A Renko Tick chart based on continuously adjusting percentage.

  • Live Renko bricks formed by tick data
  • Adjustable brick width
  • expert for indicator attached
  • Scalp with a Renko, get weird.


The settings can and will break the script if you turn them up too high. Turning off outline mode will not look as nice, but can potentially allow for a larger number of bricks.


Recommended products
Quickview
Guilherme Emiliao Ferreira
Quickview MT5 A simple indicator to get a quick view of the variation of any asset. Input parameters Comma-separated assets = Assets to be added to the indicator Assets per line = Number of assets to be displayed per line Variation % = Minimum percentual variation between last session's close price and current bid price to have the asset colored. Colors > Positive variation = Color for positive variation. Colors > negative variation = Color for negative variation.
FREE
The indicator displays support and resistance levels based on fibonacci level in multi period Creates lines indicating the latest support and resistance levels. These lines are updated whenever there is a change in support or resistance levels. Labels are removed if the corresponding conditions are not met. the period is availble in setting and level fibonacci
FREE
Rainbow MT5
Jamal El Alama
4 (1)
Description : Rainbow MT5 is a technical indicator based on Moving Average with period 34 and very easy to use. When price crosses above MA and MA changes color to green, then this is a signal to buy. When price crosses below MA and MA changes color to red, then this is a signal to sell. The Expert advisor ( Rainbow EA MT5 ) based on Rainbow MT5 indicator is now available here . MT4 version is available here .
FREE
The Rayol Code Hour Interval Lines indicator was  designed to assist your trading experience.  It  draws the range of hours chosen by the user directly on the chart, so that it enables traders to visualize price movements during their preferred trading hours, providing  traders a more comprehensive view of price movements and market dynamics. This indicator allows the user to choose not only the Broker's time, but also the Local time. This way, the user no longer needs to calculate local time in
FREE
Expansoes M
Marcus Vinicius Da Silva Miranda
The M Extensions are variations of the Golden Ratio (Fibonacci Sequence). It is the World's first technique developed for Candle Projections. Advantages: Easy to plot. Candle anchoring; High and accurate precision as support and resistance; Excellent Risk x Return ratio; Works in any timeframe; Works in any asset / market.   The M Extensions are classified into: M0: Zero point (starting candle) RC: Initial candle control region M1: Extension region 1 M2: Extension region 2 M3: Extension regi
FREE
Are you tired of drawing trendlines every time you're analyzing charts? Or perhaps you would like more consistency in your technical analysis. Then this is for you. This indicator will draw trend lines automatically when dropped on a chart. How it works Works similar to standard deviation channel found on mt4 and mt5. It has 2 parameters: 1. Starting Bar 2. Number of bars for calculation The   starting bar   is the bar which drawing of the trend lines will begin, while the   number of bars for c
FREE
Server Clock
Flavio Javier Jarabeck
5 (4)
Many friends asked me for a simple, non-obtrusive, resource-friendly clock to track the time during their trades. It seems pretty obvious, but it is a must-have for those trading the market manually, waiting for the Market News, or just to visually know what time it is... Trading is an absorbing endeavor! So, here it is... Totally configurable, including Font Type, Font Size and Chart Location: Upper Left/Center/Right OR Lower Left/Center/Right, with a little twist of adjusting the Offset, just
FREE
The utility draws pivot levels based on a selection from day week month The previous candlestick of the selected timeframe is taken and the values for the levels are calculated using the following formulas: Pivot = (high + close + low) / 3 R1 = ( 2 * Pivot) - low S1 = ( 2 * Pivot) - high R2 = Pivot + (R1 -S1) R3 = high + ( 2 * (Pivot - low)) S2 = Pivot - (R1 - S1) S3 = low - ( 2 * (high - Pivot)); The style and thickness for all lines are adjusted. The colors for the R, Pivot and S lines ar
FREE
The indicator   "Haven Key Levels PDH PDL"   helps traders visualize key levels on the chart. It automatically marks the following levels: DO (Daily Open)   — the daily open level. NYM (New York Midnight)   — the New York midnight level. PDH (Previous Day High)   — the previous day's high. PDL (Previous Day Low)   — the previous day's low. WO (Weekly Open)   — the weekly open level. MO (Monthly Open)   — the monthly open level. PWH (Previous Week High)   — the previous week's high. PWL (Previou
FREE
The Expert Advisor "TimeLeft Display" shows the remaining time until the close  of the current candle in a digital display. The time is displayed in days, hours, minutes, and  seconds.      Features: Time Calculation:  Calculates the remaining time until the close of the current candle based on the  current timeframe of the chart. Digital Display:  Shows the remaining time in a digital format. Customizable Font and Size:  Allows selection of the font (Arial, Arial Black, Aptos Display, Tahoma, 
FREE
Format Charts
Vital H B Engenharia Ltda
If you use several charts open at the same time, you know how boring it is to apply formats to each chart individually. This script can change all open charts using a single command. Parameters: 1 - Choose symbol to put on charts: apply the selected symbol to all charts. If "current", it does not change the symbol; 2 - Choose timeframe or leave empty: apply the selected timeframe to all charts. If "CURRENT", it does not change the timeframe; 3 - Apply template to the charts: If true, apply the t
FREE
Swiss CandleTime
Terence Gronowski
5 (2)
Swiss CandleTime What ist CandleTime for This indicaor just displays the remaining time for a candle to build. It is best used if you trade with timframes from 3 minutes. I use it in M3 to keep postions. If I have two following red candles i usually liquidate the position. Timeframes M1 to H1 Inputs Arrow displayed => Edit your arrow string Arrow for waiting conditions => Arrow if chart is offline Text Color => color of the text Tell if there is a trend change => tells you, if the two preciding
FREE
RSI back arrows
Smaylle Rafael Coelho Mariano
The   RSI Back Arrows   indicator is a powerful tool designed for traders who rely on the Relative Strength Index (RSI) to identify potential market reversals. This indicator specifically highlights when the RSI has exited the   oversold   or   overbought   zones, providing clear visual signals to inform trading decisions. Key Features: Visual Cues : The indicator marks arrows on the chart when the RSI crosses back into a neutral zone, making it easy to spot potential entry and exit points. Over
FREE
BoletaMiniPanel
PATRICK ANTONIO MORELO A.
5 (4)
Simple panel with  Stop loss (Loss), Stop gain (Gain) , Trailing stop (TS) and Breakeven (BE-P). Lot is the number of contracts to be traded. Gain is the number, in points, that the stop gain will be positioned. If you don't want to put stop gain, just put 0 (zero) in place and when you open the order it won't have this stop. Loss is the number, in points, that the stop loss will be placed. If you don't want to put stop loss, just put 0 (zero) in place and when you open the order it won't ha
FREE
This indicator show the candle remaining time on the chart and/or in the corner of the window. It also display notificaton (popup and push) when a new candle is formed (optional). You configure the timer on candles and at chart corner. I don't need to explain the functions because are very simple. MT4 version:  https://www.mql5.com/en/market/product/38677 Any doubt or suggestion please contact us. Enjoy! This is a free indicator, but it took hours to develop. If you want to pay me a coffee, I a
FREE
LT Donchian Channel
Thiago Duarte
4.83 (6)
Donchian Channel is an indicator created by Richard Donchian. It is formed by taking the highest high and the lowest low of the last specified period in candles. The area between high and low is the channel for the chosen period. Its configuration is simple. It is possible to have the average between the upper and lower lines, plus you have alerts when price hits one side. If you have any questions or find any bugs, please contact me. Enjoy!
FREE
This Mt5 Indicator Signals when there is two opposite direction bars engulfed by current bar.  has a recent Exponential Moving Average Cross and past bar was oversold/bought Expert Advisor Available in Comments  Free Version Here : https://www.mql5.com/en/market/product/110114?source=Site&nbsp ; Full Alerts for mt5 terminal , phone , email, print to file, print to journal  Buy Signal ( blue line ) Past ema cross ( set at 30 bars back ) Past bar rsi is oversold ( level 40  ) Engulfing bar closes
FREE
Smart Key Levels Indicator for MT5- Advanced Support & Resistance Tool The   Smart Key Levels Indicator   is a professional-grade tool for traders seeking precise support and resistance levels. Using advanced algorithms, it identifies key price levels with dynamic strength scoring, volume filtering, and higher timeframe confluence. Perfect for all trading styles and timeframes, this indicator provides clear visual signals with customizable settings. Available for both MT4 and MT5 platforms. Unlo
Phone Trade Manager
Krutik Piyushkumar Parekh
Smart Lot-Size Calculator And Trade Assistant for Mobile Trading Overview: This is the tool every trader in the market must have no matter if you are scalper, swing traders, day trader, or long term trader. This On-The-Go trading tool will help you stay disciplined and also stay free from daily trade management chores, Most traders face common problems like   1. Calculation of proper lot-size of a position to take controlled risk  2. Managing every trade and trailing stop-loss if trades goes in
FREE
DailySessions
Davide Zunino
4.67 (6)
The indicator represents the session boxes for the Asian, European and American sessions. It is possible to change the time of each session, such as color. It is also possible to disable the display of each session. You will find in input parameters variables to modify in format hh:mm. In Colors tab you can change the color of boxes of each sessions. If you need some implementations please contact me.
FREE
Girassol Sunflower MT5 Indicator
Saullo De Oliveira Pacheco
4.33 (6)
This is the famous Sunflower indicator for Metatrader5. This indicator marks possible tops and bottoms on price charts. The indicator identifies tops and bottoms in the asset's price history, keep in mind that the current sunflower of the last candle repaints, as it is not possible to identify a top until the market reverses and it is also not possible to identify a bottom without the market stop falling and start rising. If you are looking for a professional programmer for Metatrader5, please
FREE
Automatic Trendlines
Pasi Hakamaki
4.64 (42)
The indicator draws trendlines on chart. This indicator has six inputs. User can specify alternative labels for both lines. If multiple instances of the indicator are used, the labels must differ. User can set width and color of the lines and depth which specifies what significant peaks should be used. For example, Depth=10 sets trendlines using the current peaks and valleys that have at least 10 bars to the right and to the left and that have highs/lows less/greater than the peak's high/low. In
FREE
Spread highlighter
Jonathan Daniel Marion
This spread indicator displays the actual spread of each candle. It highlights the maximum spread and the minimum spread of the chosen symbol. This indicator is very helpful to see in real time the spread evolution helping to avoid taking a trade when the spread is too high. Inputs: Print value in Points: if true displays the spread as a whole number D isplay minimum and maximum spread of the past N days: select the number of days to consider the maximum and minimum spread Automatically adj
FREE
SIMPLE AND QUICK CHART CLEANUP SCRIPT - FREE FOR ALL - EASY TO DRAG AND DROP ONTO THE CHART - A MUST HAVE IN MY EYES Everybody loves to draw on a chart! But cleaning is nobodies favor. Most of the time it will be faster to dump all and redraw the important part. Repetition makes you good! ALWAYS think about that! KEEP IT GROWING, ;-) I wish you a good day, Traders! If you need something, send me a message. Best wishes to you from Vienna!
FREE
Bar Countdown
Mario Antonio Oliveira
4.75 (4)
Bar Countdown is a simple indicator for MetaTrader 5 that shows the time remaining of the each candle. It can be placed in any corner of the chart or near of the price close and it'll help you to know if the current candle is ending. Choose the counter format between HR:MIN:SEC and MIN:SEC It is so easy to use, configure the color, size and counter position on the chart and that's it!!! The Countdown starts now! Updates: 2021/02/28; v1.0: Initial release 2021/03/16; v1.1: Minor code changes   
FREE
This is a buyer and seller aggression indicator that analyzes the shape of each candle and project this data in a histogram form. There are 4 histograms in one. On the front we have two: Upper - Buyer force. Lower - Seller force. At the background we also have two histogram, both with same color. They measure the combined strenght of buyers and sellers. This histograms can be turned off in Input Parameters. It is also possible to have the real or tick volume to help on this force measurement. IN
FREE
Waves Sizer
Flavio Javier Jarabeck
3.67 (6)
Wyckoff fans, enjoy! Ideally to be used with the Weis Waves indicator, but it can be easily used alone, the Waves Sizer puts the range (in resulting Price movement) done by the Price on its market swings. You can control how accurate or loose will be the swings. This tool is very helpful for visually know how much the Price has traveled in your Timeframe. This way you can confront this level of effort with the resulting Volume, etc... Weis Waves indicator: https://www.mql5.com/en/market/produc
FREE
Lot Size Line
Stefan Warratz
This little tool helps you to define your risk management with a simple line dragging on the chart. It shows you the actual lot size calculated on account % or fixed money amount directly at the line. All you have to do is activate the line by pressing the "t" key on your keyboard and drag the line to your stop loss point. Thats it. In the settings you can define the color and width of line and text, also space of text to line and the right and you can set the risk in percent of account or fixed
FREE
ПОСМОТРИТЕ НАШ НОВЫЙ СОВЕТНИК : :   https://www.mql5.com/ru/market/product/95095?source=Unknown#description Индикатор отображает свечи заданного старшего таймфрейма, на меньших таймфреймах TF_Bar  - выбор старшего таймфрейма, на основе которого будут отображаться свечи на текущем; Number_of_Bars   - предельное число баров, до которого будет производиться расчет индикатора; Color_Up   - цветовое отображение бычьих свечей; Color_Down   - цветовое отображение медвежьих свечей; Widht_lines   - тол
FREE
Volume Day Before
Sergio Antoni Escudero Tirado
This indicator draws a price area in which the volume percentage was traded the day before. The chart shows the days with vertical lines and two horizontal lines to indicate the upper price and the lower price of the percentage of volume was traded the day before. The upper/lower lines start and end with the day calculated. But they are referred with the values of the day before. NOT the day in which are. With this indicator you can see where the volume moved in the day before. It uses percenti
FREE
Buyers of this product also purchase
Trend Screener Pro MT5
STE S.S.COMPANY
4.89 (74)
Unlock the Power of Trends Trading with the Trend Screener Indicator: Your Ultimate Trend Trading Solution powered by Fuzzy Logic and Multi-Currencies System! Elevate your trading game with the Trend Screener, the revolutionary trend indicator designed to transform your Metatrader into a powerful Trend Analyzer. This comprehensive tool leverages fuzzy logic and integrates over 13 premium features and three trading strategies, offering unmatched precision and versatility. LIMITED TIME OFFER : Tre
Golden Trend Indicator MT5
Noha Mohamed Fathy Younes Badr
4.88 (16)
Golden Trend indicator  is The best indicator for predicting trend movement this indicator never lags and never repaints and never back paints    and give  arrow buy and sell    before the candle appear  and it will help you and  will make your trading decisions clearer its work on all currencies and  gold and crypto and all time frame This unique  indicator uses very secret algorithms to catch the  trends, so you can trade using this indicator and see the trend clear on charts  manual guide and
FX Levels MT5
Daniel Stein
5 (3)
FX Levels: Exceptionally Accurate Support & Resistance for All Markets Quick Overview Looking for a reliable way to pinpoint support and resistance levels across any market—currencies, indices, stocks, or commodities? FX Levels merges our traditional “Lighthouse” method with a forward-thinking dynamic approach, offering near-universal accuracy. By drawing from real-world broker experience and automated daily plus real-time updates, FX Levels helps you identify reversal points, set profit targe
IX Power MT5
Daniel Stein
4.83 (6)
IX Power: Unlock Market Insights for Indices, Commodities, Cryptos, and Forex Overview IX Power is a versatile tool designed to analyze the strength of indices, commodities, cryptocurrencies, and forex symbols. While FX Power offers the highest precision for forex pairs by leveraging all available currency pair data, IX Power focuses exclusively on the underlying symbol’s market data. This makes IX Power an excellent choice for non-forex markets and a reliable option for forex charts when deta
FX Volume MT5
Daniel Stein
4.82 (17)
FX Volume: Experience Genuine Market Sentiment from a Broker’s Perspective Quick Overview Looking to elevate your trading approach? FX Volume provides real-time insights into how retail traders and brokers are positioned—long before delayed reports like the COT. Whether you’re aiming for consistent gains or simply want a deeper edge in the markets, FX Volume helps you spot major imbalances, confirm breakouts, and refine your risk management. Get started now and see how genuine volume data can
FX Power MT5 NG
Daniel Stein
5 (11)
FX Power: Analyze Currency Strength for Smarter Trading Decisions Overview FX Power is your go-to tool for understanding the real strength of currencies and Gold in any market condition. By identifying strong currencies to buy and weak ones to sell, FX Power simplifies trading decisions and uncovers high-probability opportunities. Whether you’re looking to follow trends or anticipate reversals using extreme delta values, this tool adapts seamlessly to your trading style. Don’t just trade—trade
CBT Quantum Maverick High-Efficiency Binary Trading System CBT Quantum Maverick is a finely tuned, high-performance binary options trading system designed for traders seeking precision, simplicity, and disciplined trading. No customization is required—this system is optimized for effective results right out of the box. Simply follow the signals, which can be mastered with a bit of practice. Key Features: Signal Precision: New-bar-based trading signals—targeting the next candle based on curren
TPSproTREND PrO MT5
Roman Podpora
4.69 (16)
TPSpro TREND PRO  - is a trend indicator that automatically analyzes the market and provides information about the trend and each of its changes, as well as giving signals for entering trades without redrawing! The indicator uses each candle, analyzing them separately. referring to different impulses - up or down impulse. Exact entry points into transactions for currencies, crypto, metals, stocks, indices!  ИНСТРУКЦИЯ RUS         INSTRUCTIONS  ENG       R ecommended to use with an indicator   -
FX Dynamic: Track Volatility and Trends with Customized ATR Analysis Overview FX Dynamic is a powerful tool that leverages Average True Range (ATR) calculations to give traders unparalleled insights into daily and intraday volatility. By setting up clear volatility thresholds—such as 80%, 100%, and 130%—you can quickly identify potential profit opportunities or warnings when markets exceed typical ranges. FX Dynamic adapts to your broker’s time zone, helps you maintain a consistent measure of
Top indicator for MT5   providing accurate signals to enter a trade without repainting! It can be applied to any financial assets:   forex, cryptocurrencies, metals, stocks, indices .  Watch  the video  (6:22) with an example of processing only one signal that paid off the indicator! MT4 version is here It will provide pretty accurate trading signals and tell you when it's best to open a trade and close it. Most traders improve their trading results during the first trading week with the help of
This dashboard shows the latest available   harmonic patterns   for the selected symbols, so you will save time and be more efficient /   MT4 version . Free Indicator:   Basic Harmonic Pattern Comparison of "Basic Harmonic Pattern" vs. "Basic Harmonic Patterns Dashboard" Indicators Feature Basic Harmonic Pattern Basic Harmonic Patterns Dashboard Functionality Detects and displays harmonic patterns on a single chart Searches multiple symbols and timeframes for harmonic patterns, displays res
Matrix Arrow Indicator MT5
Juvenille Emperor Limited
5 (13)
Matrix Arrow Indicator MT5  is a unique 10 in 1 trend following   100% non-repainting  multi-timeframe indicator that can be used on all symbols/instruments:   forex,   commodities,   cryptocurrencies,   indices,   stocks .  Matrix Arrow Indicator MT5  will determine the current trend at its early stages, gathering information and data from up to 10 standard indicators, which are: Average Directional Movement Index (ADX) Commodity Channel Index (CCI) Classic Heiken Ashi candles Moving Average
Gartley Hunter Multi
Siarhei Vashchylka
5 (9)
Gartley Hunter Multi - An indicator for searching for harmonic patterns simultaneously on dozens of trading instruments and on all possible timeframes. Manual (Be sure to read before purchasing) | Version for MT4 Advantages 1. Patterns: Gartley, Butterfly, Shark, Crab. Bat, Alternate Bat, Deep Crab, Cypher 2. Simultaneous search for patterns on dozens of trading instruments and on all possible timeframes 3. Search for patterns of all possible sizes. From the smallest to the largest 4. All fou
Gold Stuff mt5
Vasiliy Strukov
4.92 (173)
Gold Stuff mt5 is a trend indicator designed specifically for gold and can also be used on any financial instrument. The indicator does not redraw and does not lag. Recommended time frame H1. Contact me immediately after the purchase to get   personal bonus!  You can get a free copy of our Strong Support and Trend Scanner indicator, please pm. me! Settings  and manual   here  Please note that I do not sell my EA's or special sets on telegram, it is only available on Mql5 and my set files are on
TPSpro RFI Levels MT5
Roman Podpora
4.53 (19)
A key element in trading is zones or levels from which decisions to buy or sell a trading instrument are made. Despite attempts by major players to conceal their presence in the market, they inevitably leave traces. Our task was to learn how to identify these traces and interpret them correctly. ИНСТРУКЦИЯ RUS         INSTRUCTIONS  ENG         R ecommended to use with an indicator   -   TPSpro  TREND PRO -  Version MT4 Bonus: 6 months of  "RFI SIGNALS"  subscription with your purchase! Main
First of all Its worth emphasizing here that this Trading Tool is Non Repainting , Non Redrawing and Non Lagging Indicator , Which makes it ideal for professional trading . Online course, user manual and demo. The Smart Price Action Concepts Indicator is a very powerful tool for both new and experienced traders . It packs more than 20 useful indicators into one , combining advanced trading ideas like Inner Circle Trader Analysis and Smart Money Concepts Trading Strategies . This indicator focus
Atomic Analyst MT5
Issam Kassas
4.32 (19)
First of all Its worth emphasizing here that this Trading Indicator is   Non-Repainting   , Non Redrawing and Non Lagging Indicator   Indicator, Which makes it ideal from both manual and robot trading.  User manual: settings, inputs and strategy . The Atomic Analyst  is a PA Price Action Indicator that uses Strength and Momentum of the price to find a better edge in the market. Equipped with Advanced filters which help remove noises and false signals, and Increase Trading Potential. Using Multi
Bill Williams Advanced
Siarhei Vashchylka
5 (9)
Bill Williams Advanced is designed for automatic chart analysis using Bill Williams' "Profitunity" system. The indicator analyzes four timeframes at once. Manual (Be sure to read before purchasing) Advantages 1. Automatically analyzes the chart using the "Profitunity" system of Bill Williams. The found signals are placed in a table in the corner of the screen. 2. Equipped with a trend filter based on the Alligator indicator. Most of the system signals are recommended to be used only according t
Support And Resistance Screener Breakthrough unique Solution With All Important levels analyzer and Markets Structures Feature Built Inside One Tool ! Our indicator has been developed by traders for traders and with one Indicator you will find all Imporant market levels with one click. LIMITED TIME OFFER : Support and Resistance Screener Indicator is available for only 50 $ and lifetime. ( Original price 125$ ) (offer extended) The available tools ( Features ) in our Indicator are :  1. HH-LL S
Quantum Trend Sniper
Bogdan Ion Puscasu
4.73 (51)
Introducing   Quantum Trend Sniper Indicator , the groundbreaking MQL5 Indicator that's transforming the way you identify and trade trend reversals! Developed by a team of experienced traders with trading experience of over 13 years,   Quantum Trend Sniper Indicator   is designed to propel your trading journey to new heights with its innovative way of identifying trend reversals with extremely high accuracy. ***Buy Quantum Trend Sniper Indicator and you could get Quantum Breakout Indicator for
RelicusRoad Pro MT5
Relicus LLC
4.78 (18)
How many times have you bought a trading indicator with great back-tests, live account performance proof with fantastic numbers and stats all over the place but after using it, you end up blowing your account? You shouldn't trust a signal by itself, you need to know why it appeared in the first place, and that's what RelicusRoad Pro does best! User Manual + Strategies + Training Videos + Private Group with VIP Access + Mobile Version Available A New Way To Look At The Market RelicusRoad is th
Quantum TrendPulse
Bogdan Ion Puscasu
5 (13)
Introducing Quantum TrendPulse , the ultimate trading tool that combines the power of SuperTrend , RSI , and Stochastic into one comprehensive indicator to maximize your trading potential. Designed for traders who seek precision and efficiency, this indicator helps you identify market trends, momentum shifts, and optimal entry and exit points with confidence. Key Features: SuperTrend Integration: Easily follow the prevailing market trend and ride the wave of profitability. RSI Precision: Detect
TW Trend Scalper Indicator: The TW Scalper Shoot brings you a unique trading experience by utilizing the latest trading strategies and artificial intelligence technology. This product meets the diverse needs of scalper traders by providing two distinct categories of signals: Test this exceptional product today and start your unique experience toward becoming a trend scalper. Additionally, Get a product worth   $37  as a gift. Signal Categories: 1. Long-term and Safe Signals: These signals ar
Gann Squares Indicator: Analyzing Markets with Geometric Patterns The Gann Squares indicator is a powerful tool for market analysis that draws upon the mathematical concepts introduced by W.D. Gann in his article on "Mathematical Formula for Market Predictions." This indicator incorporates Gann's techniques involving square numbers such as 144, 90, and 52, as well as the Square of 9. Additionally, it incorporates  method for utilizing the Square of 9 in conjunction with channels and the star pa
ICT, SMC, SMART MONEY CONCEPTS, SMART MONEY, Smart Money Concept, Support and Resistance, Trend Analysis, Price Action, Market Structure, Order Blocks, BOS/CHoCH,   Breaker Blocks ,  Momentum Shift,   Supply&Demand Zone/Order Blocks , Strong Imbalance, HH/LL/HL/LH,    Fair Value Gap, FVG, Invert FVG, IFVG,  Premium  &   Discount   Zones, Fibonacci Retracement, OTE, Buy Side Liquidity, Sell Side Liquidity, BSL/SSL Taken, Equal Highs & Lows, MTF Dashboard, Multiple Time Frame, Big Bar, HTF OB, HTF
BookMap HeatMap
Roberto Spadim
1 (2)
This Indicator creates a heatmap based on depth of market of the current symbol or another symbol. Other symbol is useful when you trade futures market and a contract has 'mini' and 'full' split. For example, in Brazil (B3 - BMF&Bovespa), WDO and DOL are future Forex contract of BRL/USD (where 1 DOL = 5 WDO) and big banks work mostly with DOL (where liquidity is important). Please use with M1 timeframe , objects are too small to be displayed at higher timeframes (MT5 limit). The number of level
Black Dragon indicator mt5
Ramil Minniakhmetov
4.83 (58)
The trend detection indicator will compliment any strategy and can also be used as an independent tool. Be careful i not sell EA or sets at telegram it scam. All settings free here at   blog .  IMPORTANT! Contact me immediately after the purchase to get instructions and a bonus!  Benefits  Easy to use; does not overload the graphic wih unnecessary information. The ability to use as filter for any strategy. Contains bult -in dynamic levels of cupport and resistange,  which can be used both, for p
Berma Bands
Muhammad Elbermawi
5 (3)
The Berma Bands (BBs) indicator is a valuable tool for traders seeking to identify and capitalize on market trends. By analyzing the relationship between the price and the BBs, traders can discern whether a market is in a trending or ranging phase. Visit the [ Berma Home Blog ] to know more. Berma Bands are composed of three distinct lines: the Upper Berma Band, the Middle Berma Band, and the Lower Berma Band. These lines are plotted around the price, creating a visual representation of the pric
Gold Trend 5
Sergei Linskii
3.5 (2)
Gold Trend - this is a good stock technical indicator. The indicator algorithm analyzes the price movement of an asset and reflects volatility and potential entry zones. The best indicator signals: For SELL = red histogram + red SHORT pointer + yellow signal arrow in the same direction. For BUY = blue histogram + blue LONG pointer + aqua signal arrow in the same direction. Benefits of the indicator: The indicator produces signals with high accuracy. A confirmed arrow signal can only be redrawn
Introducing   Quantum Breakout PRO , the groundbreaking MQL5 Indicator that's transforming the way you trade Breakout Zones! Developed by a team of experienced traders with trading experience of over 13 years,   Quantum Breakout PRO   is designed to propel your trading journey to new heights with its innovative and dynamic breakout zone strategy. Quantum Breakout Indicator will give you signal arrows on breakout zones with 5 profit target zones and stop loss suggestion based on the breakout b
More from author
INTRODUCTION : The breakout strength meter is a trading tool that is used to identify which currencies are the strongest to breakout, and which currencies are the weakest to breakout. The settings for the indicator are easy, and if you cannot find the settings, please leave a comment The tools are completely free to use Please, if you like the indicator, please leave a comment and rate the indicator in order to develop it
FREE
The indicator displays support and resistance levels based on fibonacci level in multi period Creates lines indicating the latest support and resistance levels. These lines are updated whenever there is a change in support or resistance levels. Labels are removed if the corresponding conditions are not met. the period is availble in setting and level fibonacci
FREE
This  variant of the ZigZag  indicator is recalculated  at  each  tick  only at the bars that were not calculated yet and,  therefore, it does  not  overload  CPU  at  all  which  is  different   from  the standard indicator. Besides, in this indicator drawing of  a  line is  executed exactly in ZIGZAG style  and, therefore, the  indicator  correctly and simultaneously  displays  two  of its extreme points (High and Low) at the same bar! Depth is a minimum number of bars without the second max
FREE
Pivot Points are used by Forex traders to find support and resistance levels based on the previous day's price action. There are various ways to calculate pivot points, including averaging the open, high, low, and close of the previous day's chart price. Forex Traders use a combination of pivot points with moving averages to find trading opportunities in the currency markets. Pivot points are very useful tools that use the previous bars' highs, lows and closings to project support and resist
FREE
The script tries to determine the overall direction of the market, using smoothed Heiken Ashi candles. The coloring system (using bright and dark colors) is an attempt to detect strong market and weak market conditions. There's also an oscillator within the script These are the  features: Alert condition Features: You can now set alerts in the alert dialog for events like trend switch, trend strengthening and weakening; all for both Bullish and Bearish trend. I also added the code for custom a
FREE
Many traders use Price Action as entry and exit signal. Since the beginning of chart analysis, traders have found several   candlestick patterns   that can indicate possible "behaviors" of the market.   Candlestick Pattern indicator   is an indicator for MetaTrader platform that can detect many of these patterns and show them on screen or to alert traders about them. though they detect slightly different sets of candle patterns. Candlestick Pattern indicator also has a more modern look compared
FREE
Volunacci mt4
Mohammed Kaddour
Volonacci Indicator It is an indicator that combines Fibonacci and volume to determine the price direction This indicator helps you identify Fibonacci angles according to the strategy The Volonacci indicator is indeed an interesting combination of Fibonacci levels and volume. This indicator uses Fibonacci tools to identify potential support and resistance levels, and enhances this by using volume to confirm the strength behind the price action. MT5 Version https://www.mql5.com/en/market/produc
This is a classic Range BreakOut system. Range is defined by min number of bars and max width in pips. User can adjust both. The Range Breakout Expert Advisor can be used to trade time ranges. The market often finds its direction in the morning hours and then follows this trend for the day, This expert advisor is designed to trade these trends after the morning breakout. Still you can trade all sorts of time breakouts with this program. How the expert works The expert creates a range from a grou
Nexus Hedg EA
Mohammed Kaddour
5 (1)
EA with the idea of ​​using the "High Risk - High Reward" strategy. You should use the EA with the same capital as my trading signal, withdraw profits regularly and only use lot size 0.01 no matter the capital. Nexus hedg ea  is an EA that work with hedge strategy.It can trade Crypto, Forex pairs, Metals, Indice but need your optimize. Fully automatic adviser, with a system for recovering from losses.  This EA not use anything indicator for entries. Just use math logical. Features : No martinga
Volunacci MT5
Mohammed Kaddour
Volonacci Indicator It is an indicator that combines Fibonacci and volume to determine the price direction This indicator helps you identify Fibonacci angles according to the strategy The Volonacci indicator is indeed an interesting combination of Fibonacci levels and volume. This indicator uses Fibonacci tools to identify potential support and resistance levels, and enhances this by using volume to confirm the strength behind the price action. MT4 Version  https://www.mql5.com/en/market/produ
Filter:
No reviews
Reply to review