Sperman Scalping Dot
- Indicators
- Andrey Kozak
- Version: 1.0
- Activations: 20
Sperman Scalping Dot will be useful for traders as it helps identify potential price reversals on the chart by using a combination of overbought and oversold indicators, as well as divergences between closing prices and price extremes. The primary goal of this indicator is to visualize moments when a trend reversal is likely, giving the trader an opportunity to enter or exit a trade in time.
How to use the indicator:
Identifying Overbought/Oversold Conditions: The indicator uses overbought and oversold zones to help determine when the price has reached extremes and is ready for a reversal. The overbought and oversold levels can be adjusted through the settings (OverboughtLevel and OversoldLevel).
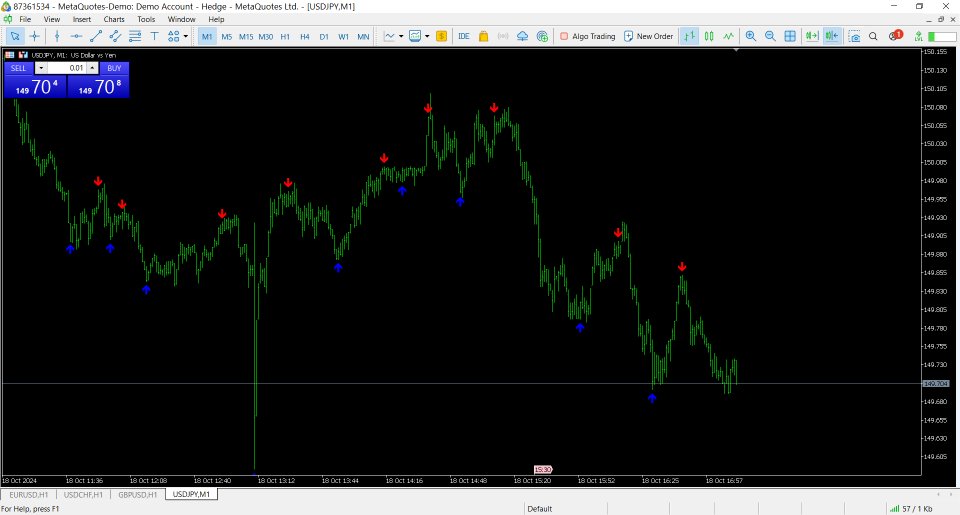
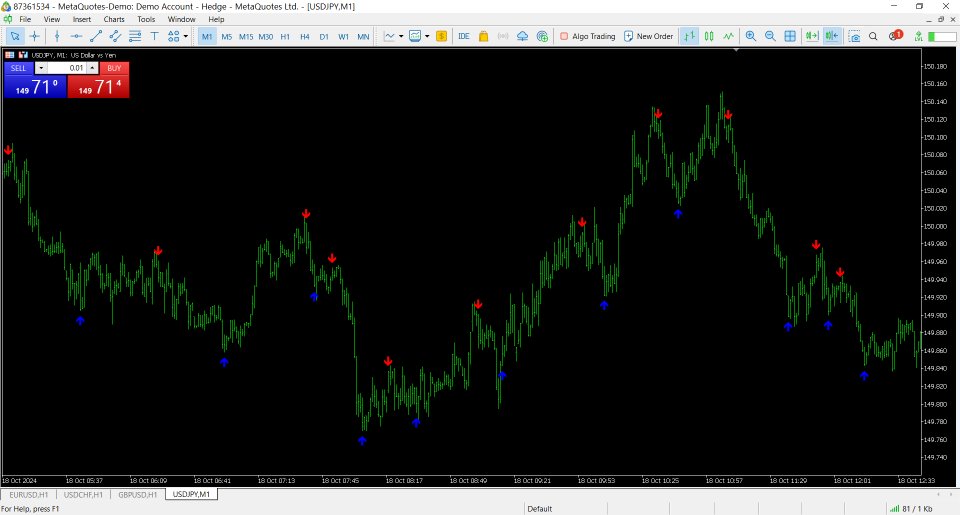
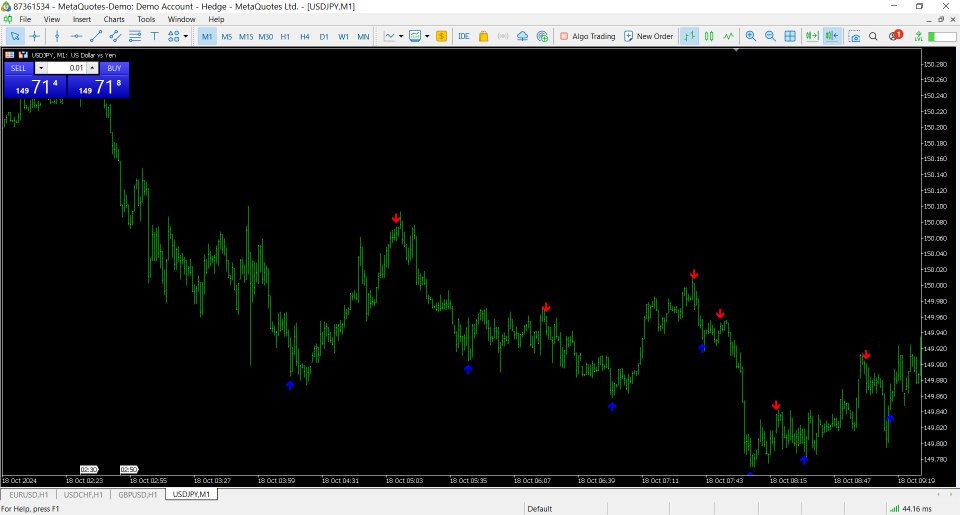
Detecting Divergences: Divergences between the closing price and price extremes (highs and lows) signal a possible reversal. The indicator looks for such discrepancies and displays arrows on the chart: a blue arrow indicates a potential buy (upward reversal), while a red arrow indicates a potential sell (downward reversal).
Entry/Exit Points: Arrows on the chart appear at points where reversals are likely and help traders identify moments for opening or closing positions: A blue arrow (at the bottom of the chart) indicates a potential buy signal. A red arrow (at the top of the chart) indicates a potential sell signal.
Volatility Analysis: The indicator also takes into account volatility (through the VolatilityThreshold parameter), which helps filter out false signals and makes the indicator more accurate in volatile market conditions.
Benefits of Using the Indicator:
- Simple Visualization: Arrows on the chart provide instant visual signals to the trader, allowing for quick responses to reversals.
- Adaptability: Analysis parameters can be adjusted (the number of bars analyzed, overbought/oversold thresholds, etc.), making the indicator flexible for different market conditions.
- Signal Filtering: By analyzing volatility and divergences, the indicator helps avoid false signals, potentially improving the accuracy of trading decisions.
Traders can apply this indicator to the chart and monitor the appearance of arrows to make decisions on opening or closing positions based on the market situation.
Indicator Settings:
- BarsToCheck = 100 – the number of bars to analyze on the chart.
- ArrowOffset = 10 – the offset of arrows from the high or low to avoid visual overlap with the price.
- VolatilityPeriod = 5 – the period for calculating market volatility.
- VolatilityThreshold = 1.0 – the multiplier for the standard deviation threshold to determine high or low volatility.
- OverboughtOversoldPeriod = 14 – the period for calculating overbought and oversold zones.
- OverboughtLevel = 78 and OversoldLevel = 22 – the overbought and oversold levels that indicate when the price has likely reached extreme values.















Für Trader die einen eigenen EA in einem M15 Hauptchart oder > verwenden, nicht zu gebrauchen. Der Indikator funktioniert nur im Hauptchart. Es gibt keine Möglichkeit, den Indikator in einem Unterchart zu verwenden. Dieser funktioniert aber als Einstieg im M1 Chart sehr gut. Es gibt keine Color Index Signale oder Text Signale auf dem Chart, sodass der EA diese finden kann. Die Programmierer sind auch nicht gewillt, den Indikator zu verbessern (gegen Aufpreis) um so auch Trader mit eigenen EA's zu bedienen. Hätten die Programmiere wenigstens ein Setting-Fenster publiziert, hätte ich den Indikator nicht gekauft. Der Kundenbetreuer scheint nicht viel vom programmieren zu verstehen, hat er sich doch so geäussert, dass die Integration eines Untercharts in den Indikator ein sehr grosser Aufwand wäre. Alles in allem, kann ich diese Leute nicht empfehlen.
Sie haben es immer noch nicht begriffen. Der Indikator läuft auf dem M1 gut, dass bringt mir aber nichts, weil der Indikator nur im Hauptchart funktioniert. Ich wünsche mir aber eine Version, die muss nicht gratis sein, die in einem Unterchart läuft und im Minimum, wenn die Signalpfeile im Chart angezeigt werden ein Color Index Signal ausgeben. O= kein Signal, 1 = BUY, 2 = SELL ,dass ist alles. Damit kann der EA das Signal lesen und einen Trade eröffnen. Ich habe keine Lust 10 Stunden am PC zu sitzen, um auf Signale des Indikators zu warten.
1. In the description they wrote that the indicator is displayed on the price chart.
2. In 4 photos they showed how and where the indicator is displayed.
3. On the site before buying you can download the demo version and test how and where the indicator is displayed. After that, a person buys the indicator and writes to us: your indicator is not working correctly. There is an error in it. It is displayed not in an additional window but in the main price window...) and gives the indicator a rating of 1 star. And also writes that he is disappointed in people and will not trust anymore. A unique situation. We are still trying to understand what the problem with the product is (and why it undeservedly received 1 star) and what exactly is our fault...)) It is not right that the administration of the mql5.com site allows all clients to leave reviews and reviews "from themselves". At least, this is our personal opinion.