Turning point of price mt5
- Indicators
- Alexey Surkov
- Version: 21.111
- Updated: 21 November 2021
- Activations: 20
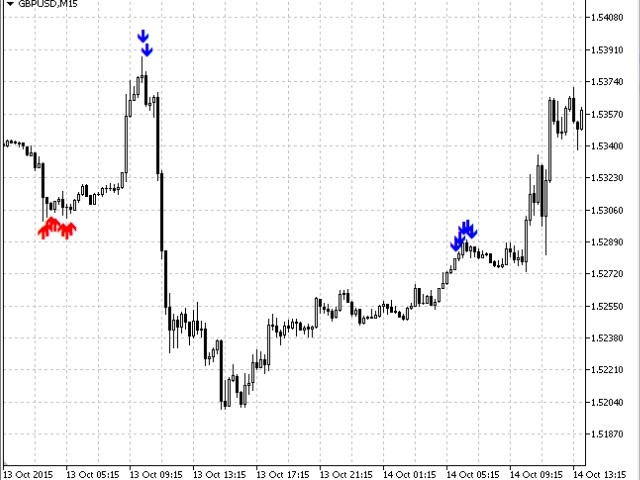
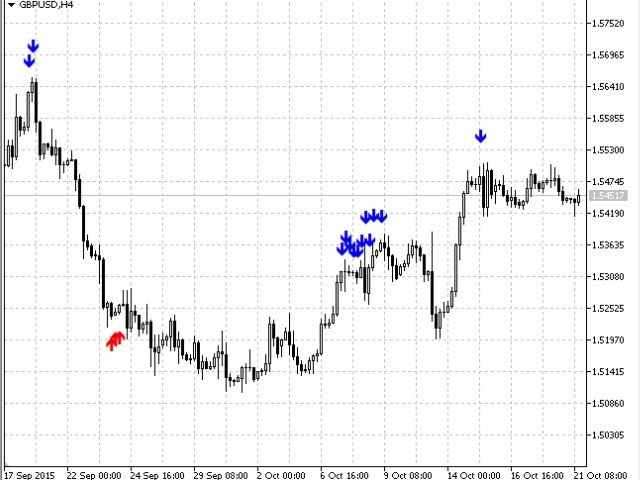
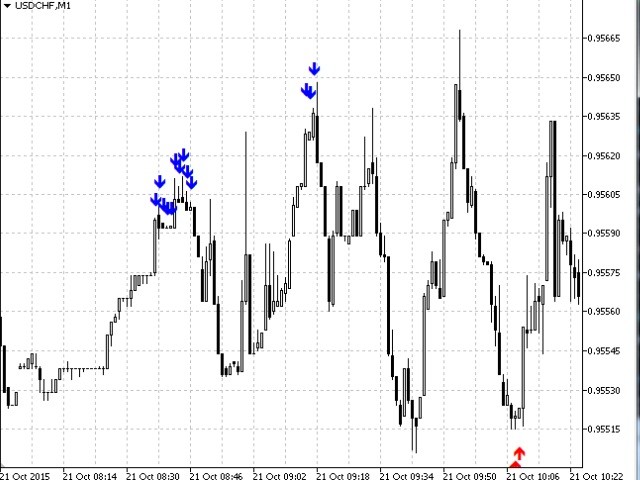
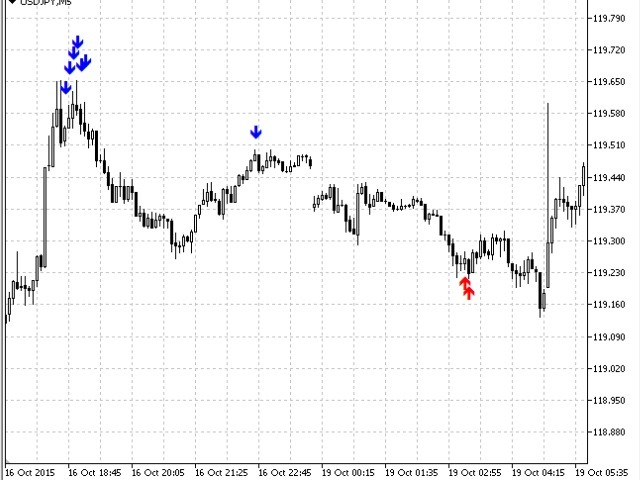
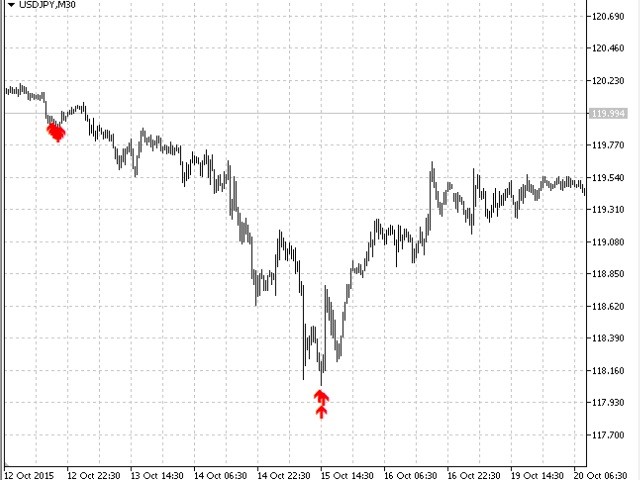
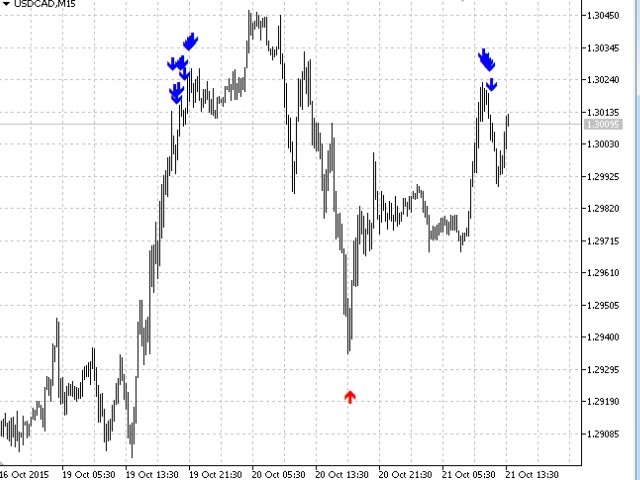
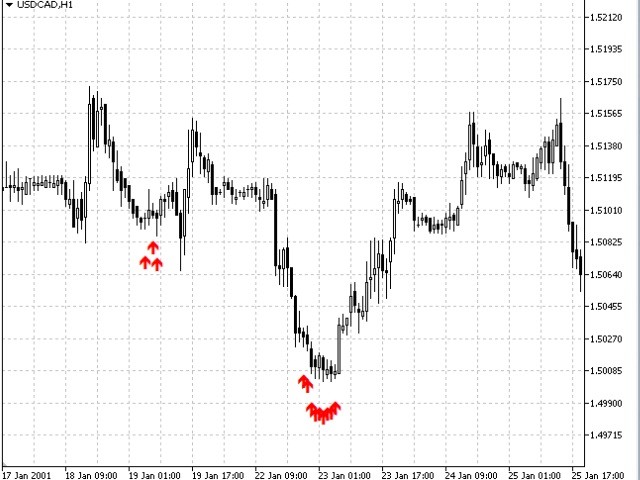
The Turning point of price indicator displays assumed turning points of the price on the chart. It is based on data of the Prise Reversal oscillator and standard ADX. When the value of Prise Reversal is in overbought or oversold area (area size is set by a user), and the value of the ADX main line exceeds the preset value, the Turning point of price indicator draws an arrow pointed to the further assumed price movement. This idea is described in the article Indicator of Price Reversal.
Inputs
- PR – size of overbought/oversold areas of the Prise Reversal indicator. Default value is 20. If you decrease this value, the Turning point of price indicator will generate less signals but they will be more accurate. And vice versa for increasing.
- ADX – value of the ADX main line, above which a signal is generated. Default value is 45. Value increase leads to decreasing the number of signals though they become more accurate. And vice versa for decreasing.
- Alert – you can set an alert when a signal appears. True – display alert, False – no alert. Default value is False.
To get correct entry points, we recommend the following:
- Adjust parameters for each traded pair and timeframe;
- First, get a signal on a higher timeframe (for example, H1), then wait for a similar signal on a lower timeframe (for example, M15).