TD Trading Info MT4
- Utilities
- Guo Zheng Sun
- Version: 1.19
TD Trading Info User Manual
Introduction:
The TD Trading Info is a sophisticated MT4 indicator designed to provide traders with comprehensive insights into their trading performance. It delivers real-time account information, detailed trading statistics, summarized profit and loss data (daily, weekly, monthly, quarterly, and annually), balance change charts, and customizable trading reminders. The indicator panel features user-friendly functionalities like theme color switching, minimizing/maximizing, dragging, and hiding/showing for an optimized user experience.
Features:
-
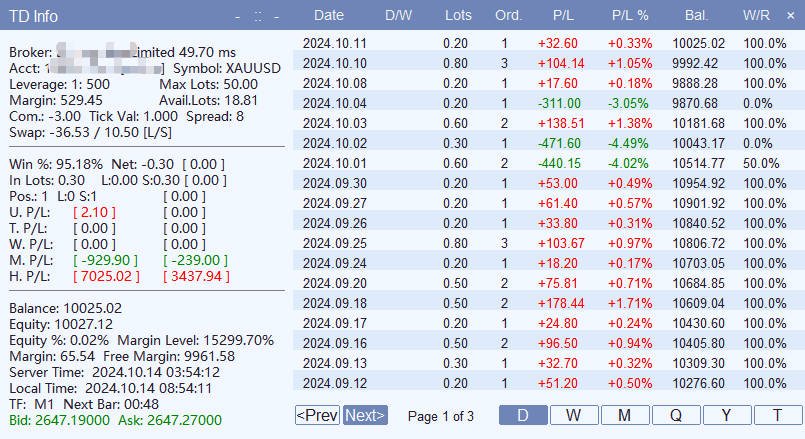
Real-Time Account Overview: Displays essential account metrics including balance, equity, used/free margin, margin level, win rate, net position, open positions, commission, and spread.
-
Trading Statistics: Provides up-to-the-minute data on current instrument positions, unrealized P/L, and historical closed P/L (daily, weekly, monthly, and overall). All calculations and updates occur automatically.
-
Multi-Timeframe Analysis: Offers comprehensive trading summaries across various timeframes (daily, weekly, monthly, quarterly, and annually), encompassing lots traded, order count, P/L, return rate, deposits/withdrawals, and balance.
-
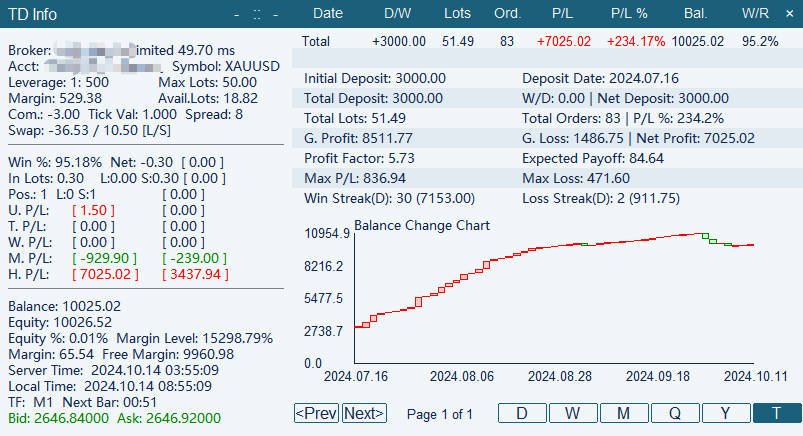
Balance Change Visualization: Presents a clear visual representation of daily account balance fluctuations using a chart format, with profits and losses differentiated by green and red bars, respectively.
-
Scheduled Reminders: Allows users to set personalized reminders based on weekdays and specific time ranges, ensuring they stay informed about crucial events or data releases.
-
Alert System: Enables users to define alert thresholds for account balance, equity, free margin, and percentage equity change. Alerts are triggered when these thresholds are breached, facilitating timely action.
-
Customizable Themes: Offers a selection of color themes to personalize the indicator's appearance.
-
Minimize/Maximize: The indicator panel can be minimized to conserve chart space and maximized when detailed information is required.
-
Draggable Panel: The panel can be repositioned anywhere on the chart by dragging it with the mouse.
-
Detailed View: Clicking the "+" button in the title bar expands a detailed view panel on the right, providing comprehensive trading records and statistics with sorting and pagination capabilities. Click "-" to collapse.
Installation:
-
Copy the TD Trading Info.ex4 file into the MQL4\Indicators folder of your MT4 installation directory.
-
In the "Navigator" window, locate the "Indicators" list, right-click to refresh, and then double-click " TD Trading Info " to add it to your chart.
Parameter Settings:
-
Reminders: Configure scrolling tooltip text and time periods using the format "weekday+start time-end time+reminder content;". Separate multiple entries with semicolons. Example: "5+20:25-20:30+Important Data Release;7+00:00-23:59+Weekend Break" (This sets a reminder for Wednesdays between 8:25 PM and 8:30 PM displaying "Important Data Release," and a reminder for Sundays throughout the day displaying "Weekend Break").
-
Themes: Select your preferred color theme for the indicator.
-
Alerts: Set alert levels for balance, equity, free margin, and equity change using the "low value+high value" format. Example: "1000+2000" (Triggers an alert if the balance falls below 1000 or exceeds 2000).
Operating Instructions:
-
Accessing Information: Once loaded, the indicator displays an information panel in the top-left corner of the chart, providing real-time account information and trading statistics.
-
Switching Themes: Double-click the "::" icon (turns pink on hover) in the panel's top-right corner to cycle through available themes.
-
Minimizing/Maximizing: Click the "-" (turns green on hover) button to minimize the panel to its title bar; click "+" to restore.
-
Dragging: Click and hold the title bar to drag the panel to your desired location.
-
Detailed View: Click "+" in the top-right corner to open the detailed view panel, displaying daily, weekly, monthly, quarterly, and annual trading records. Data can be sorted by various criteria and supports pagination. Click "×" to close.
-
Switching Timeframes: Within the detailed view, click "Day," "Week," "Month," "Quarter," "Year," or "Total" to change the displayed timeframe.
Troubleshooting:
If the interface malfunctions, buttons become unresponsive, or the indicator is obscured, try rebuilding the panel by switching the instrument or timeframe.
Disclaimer:
This indicator is solely for informational and reminder purposes and does not offer investment advice. Traders are responsible for their own investment decisions and associated risks.

