Bbands with double OBOS
- Indicators
- Zhuoxu Zhan
- Version: 1.0
- Activations: 5
This is an indicator that combines the Rate of Change and Bollinger Bands, with several functions:
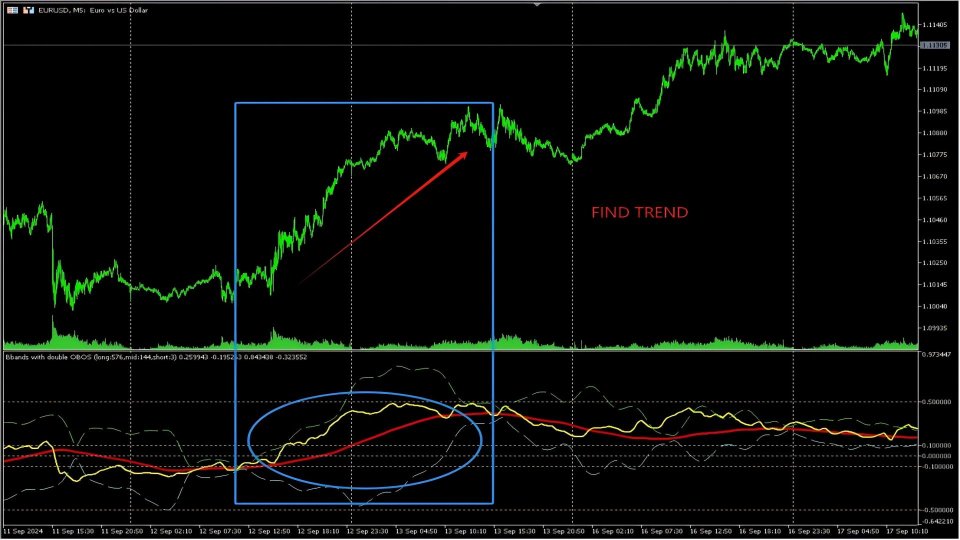
- Identifying trends.
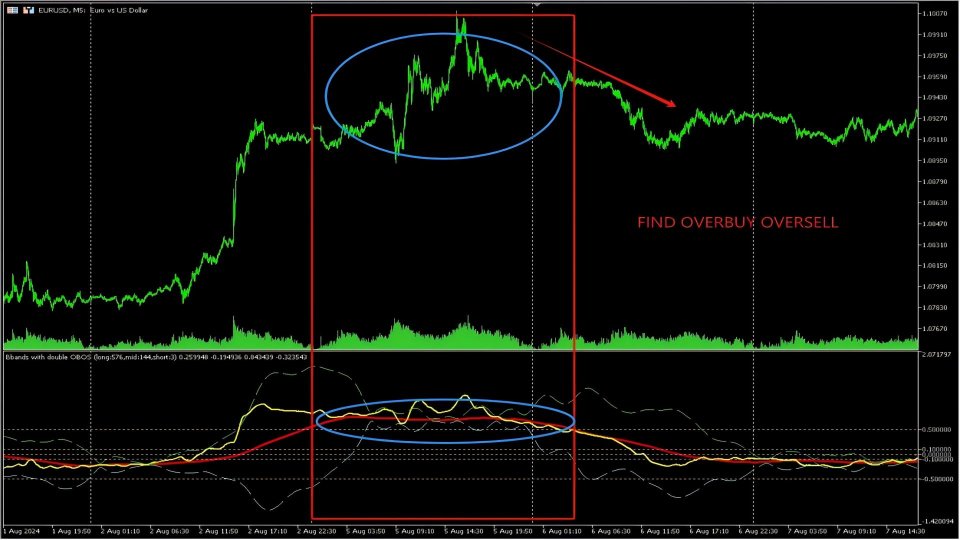
- Detecting overbought and oversold conditions.
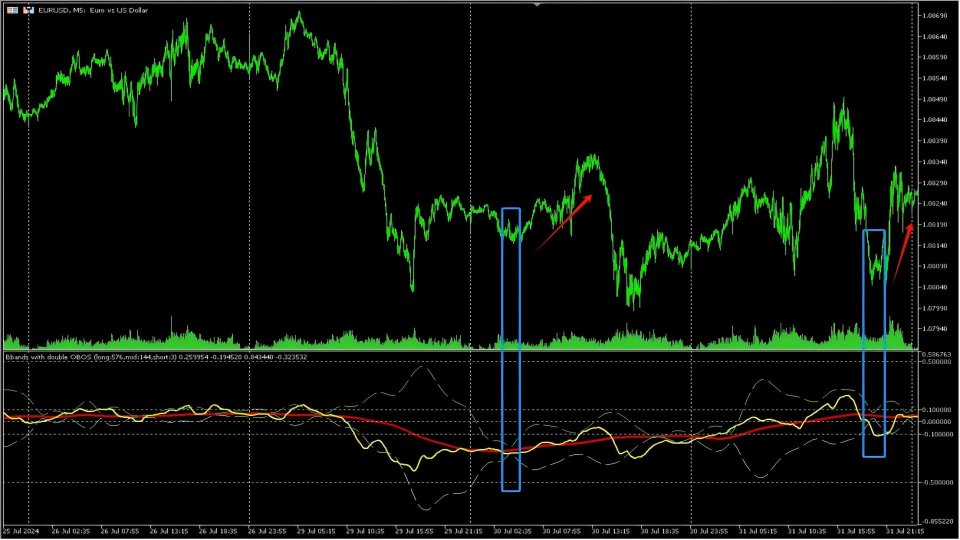
- Determining potential reversal points.
Applicable Chart: M5
The indicator is composed of four lines: the Upper Band, Lower Band, Fast Line, and Slow Line.
Usage 1: Identifying Trends
When the yellow line is above the red line and the green and blue lines are expanding, it indicates an upward trend. Conversely, if the yellow line is below the red line and the green and blue lines are expanding, it indicates a downward trend.
Usage 2: Detecting Overbought and Oversold Conditions
When the red line is above 0.5, it indicates that the price is severely overbought, suggesting a good opportunity to short. When the red line is below -0.5, it indicates that the price is severely oversold, suggesting a good opportunity to go long.
Additionally, one should consider the expansion and contraction of the upper and lower bands to determine if the trend has reached its limit.
Usage 3: Determining Potential Reversal Points
When the green upper band and the blue lower band contract after expanding and approach the red line, it indicates that a significant market movement is imminent, and a reversal may occur. At this point, you can consider using strategies that involve opening positions on both sides.
Parameters :Another point to note is the parameters. The default parameters are 576, 144, and 3; these are the optimal parameters discovered through extensive research. If needed, you can modify these parameters. Due to the need to calculate averages, not all bars can be displayed. You can adjust the SHOWNUM_K value to view more indicator data.


